High Trend
- インディケータ
- バージョン: 4.0
- アップデート済み: 20 12月 2023
- アクティベーション: 20

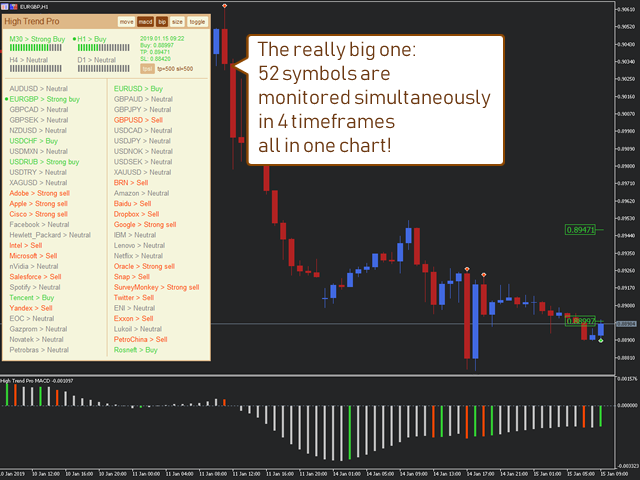
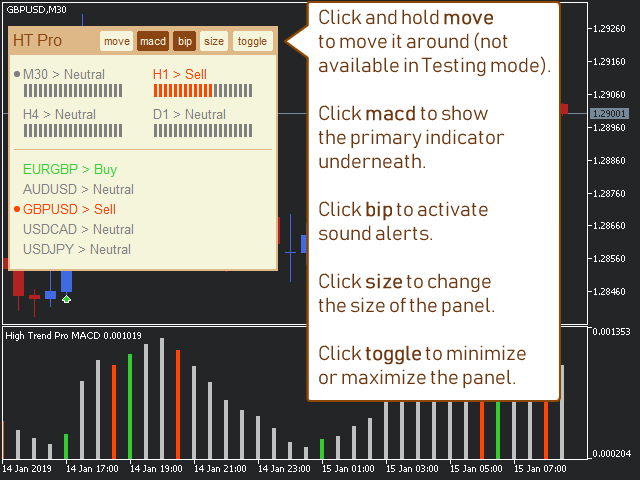
The indicator High Trend Pro monitors a big number of symbols in up to 4 timeframes simultaneously and calculates the strength of their signals. The indicator notifies you when a signal is the same in different timeframes. The indicator can do this from just one chart. Therefore, High Trend Pro is a multicurrency and multitimeframe indicator.
High Trend Pro uses emproved versions of popular and highly demanded indicators for calculating its signals.
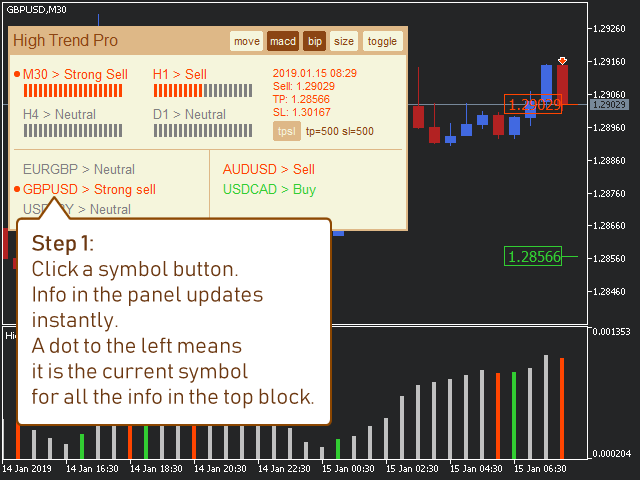
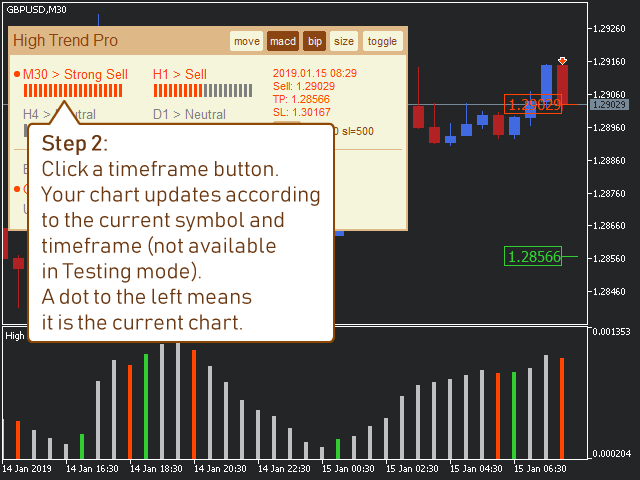
High Trend Pro calculates the signal strength for all selected symbols. Click the symbol button in the indicator interface to quickly access its signal strength in all selected timeframes (up to 4 timeframes).
It is recommended to open a trade when a signal has been confirmed by at least 2 timeframes. The indicator then notifies that it has found a Super buy or a Super sell.
Other signals pulled by the indicator are: Strong buy, Buy, Strong sell, Sell, Neutral or Loading. These signals may change quickly, especially in the lower timeframes. That is why a strong signal is the one confirmed by at least 2 timeframes.
The indicator can notify about a strong signal with a sound bip or a push-notification. You will need to set up push notifications in the menu of MetaTrader.
How to use this indicator
1. I recommend using 2 timeframes - H4 and D1.
2. Your signal should be a Super buy or a Super sell as a result of these 2 timeframes going one direction.
3. A signal should be at the start of the lowest timeframe, so for the first 1-2 hours of the H4 timeframe. If you see a signal at 3-4 hour of the H4 timeframe, you should pass it and see if it is still confirmed in the next period. This confirmation is now possible because a signal may develop for 2 periods, so one signal in the first H4 and same signal in the next H4.
4. Be careful with your profit. For example, USDCHF can make 50 (500) pips for one move. While many symbols based on GBP can make as much as 150 (1500) pips.
Indicator Properties
Color preset - you can choose from four.
Fontsize
Notify mode - Push, Print, Print_and_Push or Muted. A push notification is sent to your smartphone if you set it up. Printing is done to the "Experts" tab.
Notify interval (minutes) - number of minutes after which push notifications about strong signals to your smartphone are sent. Set up push settings via the menu "Tools > Options > Notifications".
Symbols source - there are 2 options: Market_Watch or Custom_List. For the Market_Watch, the indicator monitors and looks for signals for all the symbols currently started in the Market Watch window. For the Custom_List, it is for all symbols listed in the property Symbols custom list.
Symbols custom list - it is a comma-separated list of your symbols which the indicator monitors and for which it looks for signals. You need to choose Custom_List for the property Symbols source.
Timeframe 1
Timeframe 2
Timeframe 3
Timeframe 4
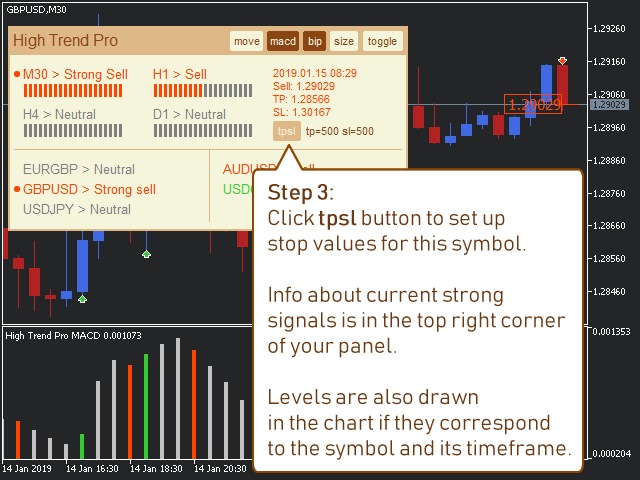
Global stoploss - minimal distance from the current price, after which the High Trend Pro tries to find a stoploss level by the nearest bar extrema in the current chart. Use pips.
Global takeprofit - minimal distance from the current price, after which the High Trend Pro tries to find a takeprofit level by the nearest bar extrema in the current chart. Use pips.