Follow The Line PRO MT5
- インディケータ
- バージョン: 1.0
- アクティベーション: 20

Follow The Line PRO
FOLLOW THE LINE (PRO VERSION)
This powerful indicator is the full and complete version of my free indicator called "Follow The Line". IT IS BASED ON the popular maxim that: "THE TREND IS YOUR FRIEND" It gives alarms and alerts of all kinds. IT DOES NOT REPAINT and can be used for all currency pairs and timeframes.
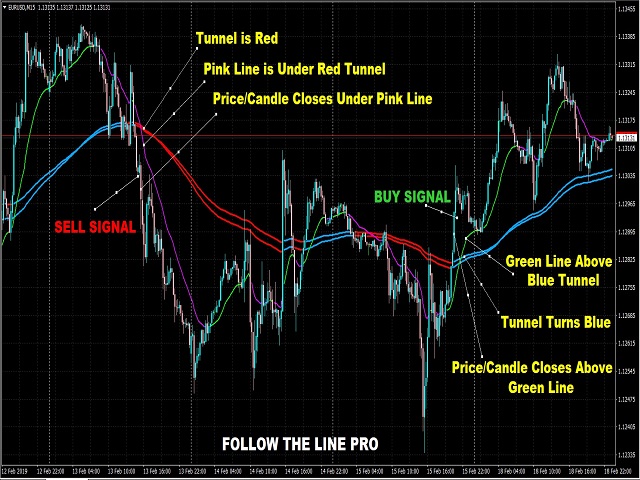
AVOID FALSE SIGNALS:
BUY ONLY when price closes above the green line and the green line is above the blue channel.
SELL ONLY when price closes below the pink line and the pink line is below the red channel.
If you have been using the free version, this is the time to move on (graduate) to this Pro version for great results in your forex trading.