ARIMA Trend Forecaster
- インディケータ
- バージョン: 9.0
- アップデート済み: 16 4月 2018
- アクティベーション: 5

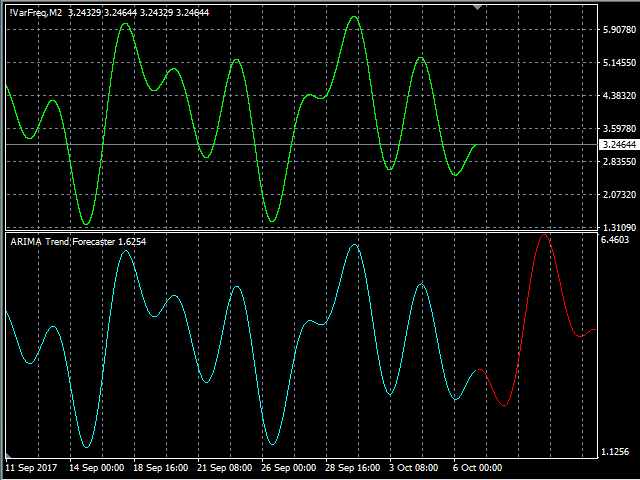
The ARIMA Trend Forecaster indicator is designed for analyzing and forecasting the trend component of a financial instrument based on the integrated ARIMA autoregressive model. The ARIMA methodology aims at identifying the presence of unit roots and the order of time series integration. In financial markets, autoregressive models are used for working with price time series to predict future price points.
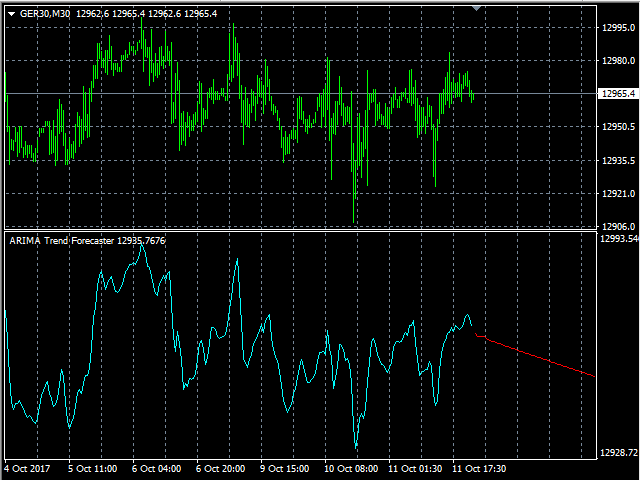
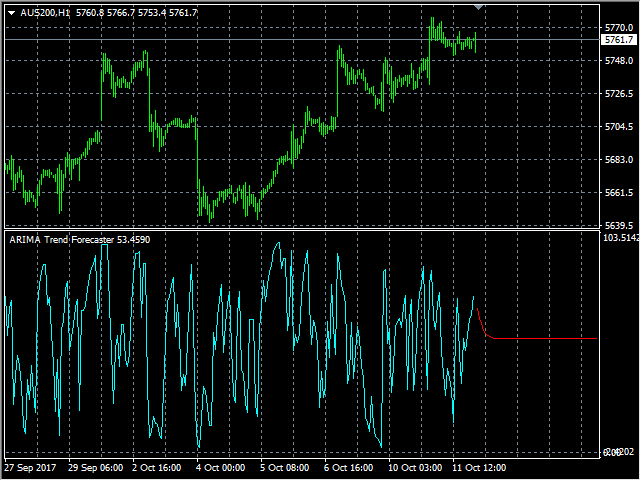
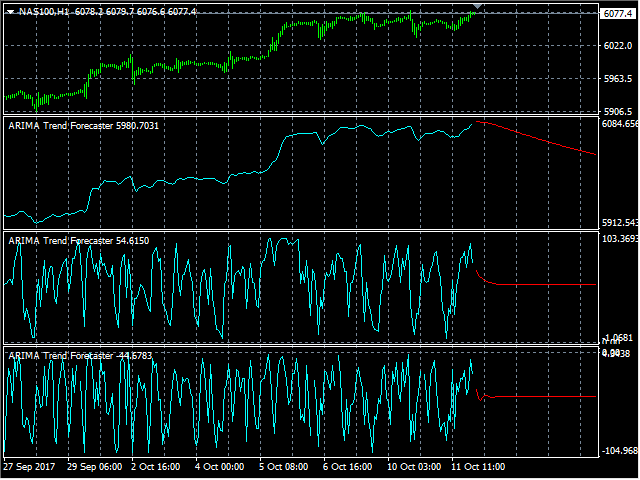
The ARIMA Trend Forecaster indicator using all the advantages of the ARIMA method allows to accurately forecast a trend component behavior and to see potential market entry points. The indicator can be used either separately or in combination with other trading indicators or systems to improve the overall results of trading.
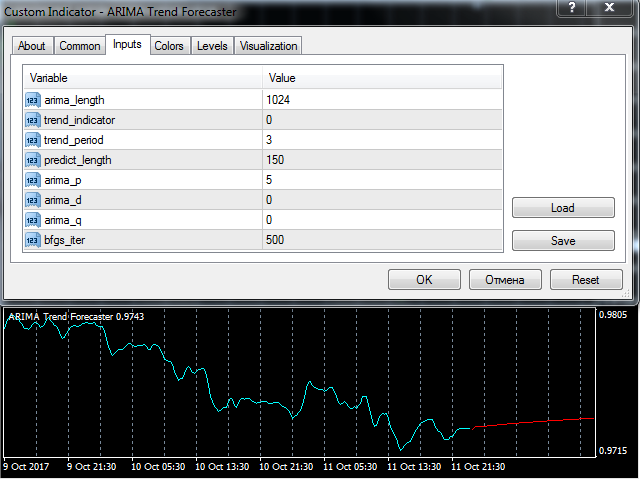
Adjustable Parameters
- start_bar - bar to calculate the forecast for;
- arima_length - the length of the time series for the calculation of the ARIMA autoregressive model;
- trend_indicator - indicator type (from 0 to 3)
- trend_period - indicator period;
- predict_length - the length of the forecast;
- arima_p - the order of the autoregressive part of the model;
- arima_d - the order of the integrated part of the model;
- arima_q - the order of the moving average;
- bfgs_iter - the number of iterations in root optimization by the BFGS method.