Fractals ST Patterns Strategy

5

Fractals ST Patterns Strategy is a modification of Bill Williams' Fractals indicator. It allows setting any number of bars to find a fractal. This simple indicator corresponds to the parameters specified in the ST Patterns Strategy (https://stpatterns.com/). Structural Target Patterns are essentially the market itself, which is consistently divided into components. To form ST Patterns, no trend lines, geometric proportions of the model itself, trading volume or open market interest are needed. They are easily recognized and built solely on the basis of breaking through the fractal levels and the distance to the Target. ST Patterns remove the uncertainty from the market, which is inherent in the previously known graphic compositions, and simplify the work of the trader.

The fractal consists of two sets of arrows - up (upper fractals) and down (lower fractals). Each fractal satisfies the following conditions:

  • Upper fractal - maximum (high) of a signal bar exceeds or is equal to maximums of all bars from the range to the left and to the right;
  • Lower fractal - minimum (low) of a signal bar is less or equal to minimums of all bars from the range to the left and to the right.


Input parameters

  • Bars around - the number of bars before and after the central bar.
  • Arrow offset - visual offset of the arrow from the bar's High/Low in points.

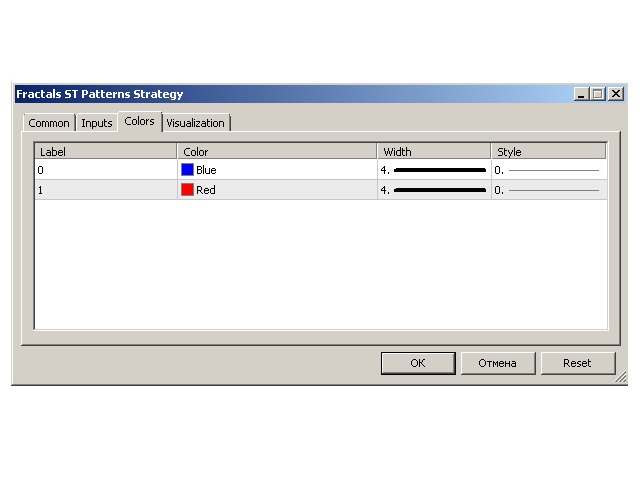
You can set the arrows' color and size separately for upper and lower fractals in the Colors tab.

レビュー 10
Edison Munoz
47
Edison Munoz 2022.01.31 21:17 
 

Dear Vladimir, I need your help. I read your book from amazon kindle and implement a robot using your theory in CFDs. I'm testing rigth now, but I need a new compillation from your indicator becouse MQL5 say me that "Fractals ST Patterns Strategy.ex5 version is too old, it should be recompiled" Could you please help me?

------

Now with the update indicator works great again! thank you for your support!!! :)

おすすめのプロダクト
This indicator displays buy or sell signals according to Bill Williams' definition of the Trading Zone. [ Installation Guide | Update Guide | Troubleshooting | FAQ | All Products ] Easy to use and understand Avoid trading flat markets Deterministic indicator with clear rules The indicator is non-repainting It implements alerts of all kinds It has straightforward trading implications. A blue arrow is a buy signal A red arrow is a sell signal According to Bill Williams trading in the zone helps t
FREE
The indicator plots a curve of the difference between the values ​​of two trading instruments (currency pairs). The purpose of the indicator is to observe the processes of divergence and convergence of the values ​​of two trading instruments. The results obtained can be used for trading strategies of statistical arbitrage, pair trading, correlation, and others. Trading strategy The indicator is attached to the chart of any trading instrument. In the input parameters, the names of trading instr
FREE
Fractals Direction ST Patterns MT5 is a modification of Bill Williams' Fractals indicator, which allows you to specify any number of bars for finding a fractal. In the settings, it is also possible to set the number of points for determining the trend direction. The upward direction is determined if the last upper fractal is higher than the penultimate upper fractal. The downward direction is determined if the last lower fractal is lower than the penultimate lower fractal. This simple indicator
FREE
This indicator is a straight port of a well known MetaTrader 4 indicator that is freely available on the Internet. It does not redraw at all. It implements a type of breakout strategy. The arrows indicate market direction. Use the indicator on M15 charts and higher. The indicator draws two bands near price action and generates signals when the price closes below the lower band and also above the upper band. The indicator uses periodic highs and lows to calculate upper and lower threshold bands.
FREE
インジケーター   Haven FVG   は、市場を分析するためのツールで、チャート上で非効率性の領域(Fair Value Gaps、FVG)を特定することができ、トレーダーに価格分析と取引決定のための主要なレベルを提供します。 他の製品 ->  ココ 主な特徴: 個別のカラー設定: ブルFVGの色   (Bullish FVG Color)。 ベアFVGの色   (Bearish FVG Color)。 柔軟なFVGの視覚化: FVGを検索するための最大ローソク足数。 FVGゾーンの追加延長(特定のバー数)。 FVGの塗りつぶしを有効にするオプション。 中央線(Middle Line): 線の色とスタイルの選択(例:点線)。 線の太さの調整。 一般設定: FVGを現在のバーまで拡張。 塗りつぶしのある歴史的なFVGを除外し、最新のデータに焦点を当てる。 チャート上の非効率性の領域を分析し、根拠のある取引決定を行う簡単で効果的な方法。
FREE
RSI with alerts BDA
Laron Demetris Burrows
4.88 (26)
このアルゴリズムは、86%*の精度で価格の短期的な変化を予測します。 ATRによって決定されるように大きな動きがある場合,買われ過ぎや売られ過ぎの状態の間に,インジケータはあなたに警告します. 価格が信号キャンドルよりも高いか低いかを予測します。 より大きな時間枠で平均復帰取引、バイナリオプションや先物契約のための完璧な。 この指標は5年間のデータに基づいてバックテストされ、時間の経過とともに価格の逆転を予測するための90%の精度を持っています。 特徴: 簡単なセットアップ 任意のグラフにドラッグアンドドロップ お好みに合わせてパラメータを調整(オプション) アラートを有効にする(オプション) そして、あなたは完了です! 視覚的および音声的な警告 お使いの携帯電話に直接送信されるアラート 端末に送信されるポップアップ警告 高いwinrate 取引の最大90%を獲得 バックテストされた5年と複数の通貨。 (バックテストの詳細と分析については、ウェブサイトを参照してください)。 多数の信号 シンボル*ごとに1日に2つの信号を期待しています。 *これは30分の蝋燭の表示器があればありま
FREE
This indicator finds and displays the Double Bottom and Double Top technical analysis patterns. Signals (displays a message on the screen) if the shape was formed recently. Often after the appearance of these patterns, the trend reverses or a correction occurs. In order not to search for them yourself, or not to miss their appearance, it is enough to add an indicator to the chart. The indicator can be used on different timeframes and currency pairs, there are settings for a better search on a c
FREE
This indicator is an automated version of the Fibonacci retracement (Fib) indicator. Deciding the best areas to use when drawing the fib can be tricky and this  indicator was made with that in mind. When you drop it on the chart it will automatically choose the best points to draw the fib with, but in case you aren't satisfied with those regions, you can adjust it as you wish.
FREE
Ideal for scalpers, day traders and swing trades. Automatically identifies key support and resistance levels based on historical price data. It displays real-time trading zones and a precise countdown timer for each candle, helping traders make faster and more confident decisions. Fully customizable for multiple timeframes and instruments. The indicator analyzes historical price data to draw horizontal levels that represent key trading areas. It also displays, in real time, the current zone whe
FREE
Easy GOLD MT5
Franck Martin
4.03 (40)
Easy Gold is the latest addition to the BotGPT family. It is surprising and very powerful. It is ideal for beginners due to its simplicity.  There is absolutely nothing to do, it's 100% automated, simply indicate the percentage of risk you want to take per trade and the EA is ready. Whatever your capital, the EA takes care of everything. Optimized on (XAUUSD).  Unleash all the power with the professional version (AGI Gold) and its connection to the neural network, available in my store. My othe
FREE
ADR ST Patterns Strategy  is a modification of the classical  ADR  indicator. This simple indicator corresponds to the parameters specified in the  ST Patterns Strategy ( https://stpatterns.com/ ) .  Structural Target Patterns represents the market consistently divided into components. No trend lines, geometric proportions of the model itself, trading volume, or open market interest are needed for the formation of  ST Patterns . They are easily recognized and built only on the basis of breaking
FREE
Divergence Force
Alessandro Riggi
4.5 (2)
Divergence Force ダイバージェンスインジケーター 1.0 説明 Divergence Force  は、資産の価格とMACD(移動平均収束拡散)との間のダイバージェンスを識別するために設計されたインジケーターです。このインジケーターは、価格とMACDの高値と安値に自動的にトレンドラインを描き、潜在的な取引機会を強調します。 主な機能 ダイバージェンスの自動識別 : インジケーターは、価格とMACDの間の強気と弱気のダイバージェンスを自動的に検出します。 トレンドラインの追跡 : 価格の連続する高値と安値に自動的にトレンドラインを描き、MACDの高値と安値と比較します。 買いと売りのシグナル : ダイバージェンスが識別されると、グラフに明確に買い("Buy")と売り("Sell")のシグナルを表示します。ダイバージェンスが検出されない場合は"Neutral"を表示します。 標準MACDパラメータ : 標準のMACDパラメータ(12, 26, 9)を使用して計算し、信頼性のある認知された結果を保証します。 異なるタイムフレームとの互換性 : 1時間のタイムフレームで動作する
FREE
RenkoExpert
Andrey Goida
3.8 (5)
Renko Expert Advisor based on Renko bar simulation.    The EA has two options for building Renko bars. Classic and ATR. In the classic version, renko bars are marked with areas on the main chart; in the ATR version, renko bars are modeled and drawn in the indicator window. Modeling renko bars inside the EA allows you to optimize the robot better than drawing renko bars offline.   Our new product based on artificial intelligence   https://www.mql5.com/ru/market/product/127820   Telegramm channel
FREE
「Haven Key Levels PDH PDL」   インジケーターは、トレーダーがチャート上の主要なレベルを視覚化するのに役立ちます。次のレベルを自動的にマークします: DO (Daily Open)   — 日足の始値。 NYM (New York Midnight)   — ニューヨーク時間の深夜0時のレベル。 PDH (Previous Day High)   — 前日の高値。 PDL (Previous Day Low)   — 前日の安値。 WO (Weekly Open)   — 週足の始値。 MO (Monthly Open)   — 月足の始値。 PWH (Previous Week High)   — 前週の高値。 PWL (Previous Week Low)   — 前週の安値。 CMH (Current Month High)   — 当月の高値。 CML (Current Month Low)   — 当月の安値。 PMH (Previous Month High)   — 前月の高値。 PML (Previous Month Low)   — 前月の
FREE
This indicator is based on the Fractals indicator. It helps the user identifying whether to buy or sell. It comes with an alert that will sound whenever a new signal appears. It also features an email facility. Your email address and SMTP Server settings should be specified in the settings window of the "Mailbox" tab in your MetaTrader 5. Blue arrow up = Buy. Red arrow down = Sell. Line = Trailing Stop. You can use one of my Trailing Stop products that automatically move the Stop Loss and includ
FREE
Индикатор, показывающий момент преодоления нулевой отметки индикатора MACD. Индикатор стрелочный и может быть использован для торговли бинарными опционами. Входные параметры Period of SMA1  - Период 1 скользящей средней Period of SMA2 -  Период 2 скользящей средней Period of SMA3 -  Период 3 скользящей средней Inform about finding the signal  - подавать уведомление, при нахождении сигнала
FREE
Revolution Martingale is an indicator designed for trading binary options on the M5 timeframe. Features: M5 Timeframe: It is recommended to use the indicator on the M5 timeframe for optimal trading. Trade Entry: Trades should only be opened on the first candle after a signal appears. Signals: A blue diamond indicates a buying opportunity for upward movement, while a red diamond indicates a buying opportunity for downward movement. Configured for Effective Binary Options Trading: The indicator i
FREE
This is the latest iteration of my famous indicator, Reversal Fractals, published for the first time almost a decade ago. It examines the price structure of fractals to determine possible reversal points in the market, providing timing to positional traders that already have a fundamental or technical valuation model. [ Installation Guide | Update Guide | Troubleshooting | FAQ | All Products ] Reversal fractals can start long trends The indicator is non repainting It implements alerts of all ki
FREE
APICT Chart Patterns – Trend Line & Pattern Recognition for MT5 Enhance your technical analysis with the APICT Chart Patterns Indicator — an advanced tool for automatic pattern and trend line detection in MetaTrader 5. Key Features Automatic Pattern Detection: Identifies over 10 classic chart patterns, including pennants, wedges, channels, and double tops/bottoms. Real-Time Trend Lines: Draws support and resistance lines using smart algorithms. Custom Sensitivity: Adjust detection for major or
FREE
The indicator is based on Robert Miner's methodology described in his book "High probability trading strategies" and displays signals along with momentum of 2 timeframes. A Stochastic oscillator is used as a momentum indicator. The settings speak for themselves period_1 is the current timeframe, 'current' period_2 is indicated - the senior timeframe is 4 or 5 times larger than the current one. For example, if the current one is 5 minutes, then the older one will be 20 minutes The rest of the s
FREE
A professional tool for trading - the divergence indicator between the RSI and the price, which allows you to receive a signal about a trend reversal in a timely manner or catch price pullback movements (depending on the settings). The indicator settings allow you to adjust the strength of the divergence due to the angle of the RSI peaks and the percentage change in price, which makes it possible to fine-tune the signal strength. The indicator code is optimized and is tested very quickly as par
FREE
This is a demo version of the Candle Absorption Full indicator. It has limitations on operation. This indicator detects the Engulfing candlestick pattern and draws the corresponding market entry signal. Features It works only with EURUSD on timeframes M1 and M5. The indicator analyzes a combination of 2 or 3 candlesticks depending on settings. The number of pre-calculated bars (signals) is configurable. The indicator can send an alert to notify of a found signal. Signal can be filtered by setti
FREE
This indicator is based on the Parabolic SAR indicator. It helps the user identifying whether to buy or sell. It comes with an alert that will sound whenever a new signal appears. It also features an email facility. Your email address and SMTP Server settings should be specified in the settings window of the "Mailbox" tab in your MetaTrader 5. Blue arrow up = Buy. Red arrow down = Sell. Line = Trailing Stop. You can use one of my Trailing Stop products that automatically move the Stop Loss and i
FREE
ToolBot Probabilistic Analysis - FREE   An effective indicator for your negotiations The toolbot indicator brings the calculation of candles and a probabilistic analysis so that you have more security on your own. Also test our  FREE tops and bottoms indicator: :   https://www.mql5.com/pt/market/product/52385#description Also test our  FREE (RSI, ATR, ADX, OBV) indicator:   https://www.mql5.com/pt/market/product/53448#description Try our EA ToolBot for free:   https://www.mql5.com/market/prod
FREE
Donchian Pro
Paulo Henrique Faquineli Garcia
5 (3)
The Donchian Channel Channels are among the most popular tools of technical analysis, as they visually convey to the analyst the limits within which most price movement tends to occur. Channel users know that valuable information can be obtained at any time, whether prices are in the central region of a band or close to one of the border lines. One of the best known techniques to explore these concepts is Bollinger Bands. However, John Bollinger was not the only one to research the application
FREE
Indicator and Expert Adviser  EA Available in the comments section of this product. Download with Indicator must have indicator installed for EA to work. Mt5 indicator alerts for bollinger band and envelope extremes occurring at the same time. Buy signal alerts occur when A bullish candle has formed below both the lower bollinger band and the lower envelope  Bar must open and close below both these indicators. Sell signal occur when A bear bar is formed above the upper bollinger band and upper
FREE
This indicator is designed to detect high probability reversal patterns: Double Tops/Bottoms with fake breakouts . This is the FREE version of the indicator: https://www.mql5.com/en/market/product/29957 The free version works only on EURUSD and GBPUSD! Double top and bottom patterns are chart patterns that occur when the trading instrument moves in a similar pattern to the letter "W" (double bottom) or "M" (double top). The patterns usually occur at the end of a trend and are used to signal tren
FREE
MACD Enhanced
Nikita Berdnikov
5 (2)
Introducing the MACD  Enhanced – an advanced MACD (Moving Average Convergence Divergence) indicator that provides traders with extended capabilities for trend and momentum analysis in financial markets. The indicator uses the difference between the fast and slow exponential moving averages to determine momentum, direction, and strength of the trend, creating clear visual signals for potential entry and exit points. Attention! To achieve the best results, it is recommended to adapt the indicator
FREE
Follow The Line MT5
Oliver Gideon Amofa Appiah
4.6 (35)
This indicator obeys the popular maxim that: "THE TREND IS YOUR FRIEND" It paints a GREEN line for BUY and also paints a RED line for SELL. (you can change the colors). It gives alarms and alerts of all kinds. IT DOES NOT REPAINT and can be used for all currency pairs and timeframes. Yes, as easy and simple as that. Even a newbie can use it to make great and reliable trades. NB: For best results, get my other premium indicators for more powerful and reliable signals. Get them here: https://www.m
FREE
Pivot Points Indicator – a fast, reliable, and fully customizable pivot detection for MetaTrader 5. This indicator uses MetaTrader’s native iHighest and iLowest functions to identify pivot highs and lows by scanning for the highest and lowest prices within a user-defined window of bars. A pivot is confirmed only when the current bar is the absolute maximum or minimum within the selected range, ensuring accurate and timely signals based on robust built-in logic. Key Features No Repainting : Onc
FREE
このプロダクトを購入した人は以下も購入しています
このインジケーターを購入すると、プロ仕様のトレードマネージャーを無料で差し上げます。 まず第一に、このトレーディングシステムがノンリペイント、ノンリドロー、ノンラグのインジケーターであることを強調する価値がある。これにより、手動取引とロボット取引の両方に理想的なものになっています。 オンラインコース、マニュアル、プリセットのダウンロード。 「スマートトレンドトレーディングシステム MT5」は、新規および経験豊富なトレーダー向けにカスタマイズされた包括的なトレーディングソリューションです。10以上のプレミアムインジケーターを組み合わせ、7つ以上の堅実なトレーディング戦略を備えており、多様な市場状況に対応する多目的な選択肢となっています。 トレンドフォロー戦略:トレンドを効果的に乗り越えるための正確なエントリーとストップロス管理を提供します。 リバーサル戦略:潜在的なトレンドの反転を特定し、トレーダーがレンジ相場を活用できるようにします。 スキャルピング戦略:高速で正確なデイトレードおよび短期取引のために設計されています。 安定性:すべてのインジケーターはノンリペイント、ノンリドロー、ノ
Power Candles – あらゆる市場に対応した強度ベースのエントリーシグナル Power Candles は、Stein Investments が長年培ってきた強度分析を価格チャート上に直接反映します。価格だけに反応するのではなく、各ローソク足は実際の市場の強さに基づいて色分けされ、モメンタムの蓄積、強度の加速、明確なトレンド転換を瞬時に把握できます。 すべての市場に共通する単一ロジック Power Candles は すべての取引シンボル で自動的に動作します。現在のシンボルが Forex か非 Forex 市場かを自動判別し、内部で適切な強度モデルを適用します。 Forex および Gold :FX Power のデルタ値を使用(絶対値レンジ最大 100) 指数、暗号資産、CFD :IX Power の強度値を使用(絶対値レンジ最大 50) 必要な強度計算は Power Candles に直接組み込まれています。ローソク足のカラーリングやシグナルロジックに、追加のインジケーターは不要です。 価格ノイズではなく「強度状態」 各ローソク足は、以下の 9 つの明確に定義された強
このインジケーターを購入された方には、以下の特典を 無料 で提供しています: 各トレードを自動で管理し、ストップロスとテイクプロフィットを設定し、戦略ルールに基づいてポジションを決済する補助ツール 「Bomber Utility」 様々な銘柄に合わせたインジケーターの設定ファイル(セットファイル) 「最小リスク」、「バランスリスク」、「待機戦略」 の3つのモードで使用できる Bomber Utility 用の設定ファイル このトレーディング戦略をすぐに導入・設定・開始できる ステップバイステップのビデオマニュアル ご注意: 上記の特典を受け取るには、MQL5のプライベートメッセージシステムを通じて販売者にご連絡ください。 オリジナルのカスタムインジケーター 「Divergence Bomber(ダイバージェンス・ボンバー)」 をご紹介します。これは、MACDのダイバージェンス(乖離)戦略に基づいた 「オールインワン」型のトレーディングシステム です。 このテクニカルインジケーターの主な目的は、価格とMACDインジケーターの間に発生するダイバージェンスを検出 し、将来の価格の動きを示す
FX Power: 通貨の強弱を分析して、より賢い取引を実現 概要 FX Power は主要通貨と金の実際の強弱をあらゆる市場状況で理解するための必須ツールです。強い通貨を買い、弱い通貨を売ることで、 FX Power は取引の意思決定を簡素化し、高い確率の取引機会を見出します。トレンドを追従する場合でも、極端なデルタ値を使用して反転を予測する場合でも、このツールはあなたの取引スタイルに完全に適応します。ただ取引するだけではなく、 FX Power で賢く取引をしましょう。 1. なぜ FX Power がトレーダーにとって非常に有益なのか 通貨と金のリアルタイム強弱分析 • FX Power は主要通貨と金の相対的な強弱を計算し、マーケットダイナミクスに関する明確な洞察を提供します。 • どの資産がリードしているか、または後れを取っているかを監視して、取引するペアを賢く選びましょう。 マルチタイムフレームの包括的なビュー • 短期、中期、長期のタイムフレームで通貨と金の強弱を追跡し、マーケットトレンドに基づいて取引戦略を調整できます。 • スキャルピングからスイングトレード
Entry In The Zone and SMC Multi Timeframe は、Smart Money Concepts(SMC)に基づいて開発された リアルタイム市場分析ツール です。 本システムは、トレーダーがマーケットストラクチャーを体系的に分析し、市場全体の方向性をより明確に把握できるよう設計されています。 システムは複数の時間軸にわたり、 反転ポイント(Reversal Points)・主要ゾーン(Key Zones)・マーケットストラクチャー を自動的に解析します。さらに、 POI(Point of Interest)・ノーリペイントシグナル・Auto Fibonacci Levels を表示し、プルバックや反転ポイントを高精度で検出します。 リアルタイムシグナルとアラートにより、価格が主要ゾーンに到達したときや、ゾーン内で反転シグナルが発生した際に、重要な機会を逃すことはありません。 また、本システムは インジケーター と シグナルシステム の両方の機能を兼ね備えた 2-in-1ツール であり、ゾーン分析とリアルタイムエントリーシグナルを一体化しています。 さらに
AriX
Temirlan Kdyrkhan
1 (4)
AriX Indicator for MT5 A powerful trend-following and signal-evaluation tool AriX is a custom MT5 indicator that combines Moving Averages and ATR-based risk/reward logic to generate clear buy/sell signals. It visualizes dynamic SL/TP levels, evaluates past trade outcomes, and displays win/loss statistics in a clean on-chart panel. Key features include: Buy/Sell signals based on MA crossovers ATR-based SL/TP1/TP2/TP3 levels with visual lines and labels Signal outcome tracking with real-time stat
Game Changerは、あらゆる金融商品で使用できる革新的なトレンドインジケーターです。メタトレーダーを強力なトレンドアナライザーへと変貌させます。このインジケーターは再描画や遅延がありません。あらゆる時間枠で動作し、トレンドの特定、反転の可能性のシグナル、トレーリングストップ機能、そして迅速な市場反応のためのリアルタイムアラートを提供します。経験豊富なプロ、あるいは優位性を求める初心者の方でも、このツールは自信と規律を持ち、トレンドの根底にあるダイナミクスを明確に理解した上で取引を行うための力となります。 購入後すぐにご連絡いただくと、個人ボーナスを進呈いたします!強力なサポートとトレンドスキャナーインジケーターの無料コピーもご用意しておりますので、お気軽にプライベートメッセージでご連絡くださ. 私のEAやスペシャルセットはTelegramでは販売しておりません。Mql5のみで販売しており、セットファイルはこちらのブログでのみ公開し ております 。詐欺師にはご注意ください。他の方からセットを購入しないでください。 設定 トレンド変化時のアラートを有効にする - True/Fals
ARICoin is a powerful trading companion designed to generate high-probability entry signals with dynamic TP/SL/DP levels based on volatility. Built-in performance tracking shows win/loss stats, PP1/PP2 hits, and success rates all updated live. Key Features: Buy/Sell signals with adaptive volatility bands Real-time TP/SL/DP levels based on ATR Built-in MA Filter with optional ATR/StdDev volatility Performance stats panel (Success, Profit/Loss, PP1/PP2) Alerts via popup, sound, push, or email Cust
まず第一に、この取引インジケーターは再描画されず、再描画されず、遅延しないことを強調する価値があります。これにより、手動取引とロボット取引の両方に理想的なものになります。 ユーザーマニュアル:設定、入力、戦略。 アトミックアナリストは、価格の強さとモメンタムを利用して市場でより良いエッジを見つけるためのPA価格アクションインジケーターです。ノイズや誤ったシグナルを除去し、取引ポテンシャルを高めるための高度なフィルターを備えています。複雑なインジケーターの複数のレイヤーを使用して、アトミックアナリストはチャートをスキャンし、複雑な数学的計算をシンプルなシグナルと色に変換します。これにより、どのような初心者トレーダーでも理解して使用し、一貫した取引の決定を行うことができます。 「アトミックアナリスト」は、新規および経験豊富なトレーダー向けにカスタマイズされた包括的な取引ソリューションです。プレミアムインジケーターとトップノッチの機能を1つの取引戦略に組み合わせ、すべてのタイプのトレーダーにとって汎用性のある選択肢にします。 デイリートレーディングとスキャルピング戦略:高速で正確なデイ
Gold Sniper Scalper Pro - MetaTrader 5 用 ゴールド (XAU/USD) トレーディングシステム 真剣なトレーダーのために: 複数の市場分析要因を組み合わせた、構造化され、データ駆動型の方法論でゴールド取引に取り組みます。このツールは、あなたのゴールド取引分析をサポートするために構築されています。 限定価格の機会 これは、価格が上昇する前に Gold Sniper Scalper Pro を所有するチャンスです。 その後の購入 10 件ごとに $50 ずつ上昇します。 最終価格: $498 あなたの分析的優位性を定義する機能 Gold Sniper Scalper Pro は、深い洞察と明確な統計的優位性を提供するために設計された包括的なツールキットです: システム、入力のカスタマイズ、およびインジケーター使用時の注意事項を含む詳細なインジケーター使用ガイドは、以下の MQL 記事に記載されています。ドキュメントを参照してください。 Gold Sniper Scalper Pro - Gold (XAU/USD) Trading System o
トレンド スクリーナー インジケーターでトレンド取引の力を解き放ちます。ファジー ロジックと複数通貨システムを活用した究極のトレンド取引ソリューションです。 ファジー ロジックを活用した革新的なトレンド インジケーターである Trend Screener を使用して、トレンド取引を向上させます。 これは、13 を超えるプレミアム ツールと機能、および 3 つの取引戦略を組み合わせた強力なトレンド追跡インジケーターであり、Metatrader をトレンド アナライザーにする多用途の選択肢となります。 期間限定オファー : トレンド スクリーナー インジケーターは、わずか 100 ドルで生涯ご利用いただけます。 (元の価格 50$ ) (オファー延長) Trend Screener の 100% 非再描画精度の揺るぎない精度を体験して、取引の決定が過去の価格変動の影響を受けないようにしてください。 マルチタイムフレームおよびマルチ通貨機能の多用途性を解放し、比類のない自信を持って外国為替、商品、暗号通貨、インデックスの世界を取引できるようにします。 Trend Screener の包括的な
Azimuth Pro
Ottaviano De Cicco
5 (1)
発売プロモーション Azimuth Proは先着 100 名様限定で 299 ドルでご提供します。 最終価格は 499 ドルとなります。 リテールとインスティテューショナルのエントリーの違いはインジケーターではなく、ロケーションにあります。 多くのトレーダーは、モメンタムを追いかけたり、遅行シグナルに反応して、任意の価格レベルでエントリーします。機関投資家は、需給が実際にシフトする構造的なレベルに価格が到達するのを待ちます。 Azimuth Proはこれらのレベルを自動的にマッピングします:スイングアンカーVWAP、マルチタイムフレーム構造ライン、高確率ロケーションにのみ出現するABCパターン。 Azimuth Proは、構造分析とインテリジェントな自動化の両方を求めるプロフェッショナルトレーダー向けに構築されています。 Azimuthが外科的精度で市場構造をマッピングする一方、Azimuth Proはインテリジェンスレイヤーを追加します:トレーディングスタイルの自動検出、スマート設定された移動平均線、20年のデータでバックテストされた最適化パラメータ。その結果、お使いの
Smart Stop Indicator – チャート上で実現するインテリジェントなストップロス精度 概要 Smart Stop Indicator は、ストップロスを勘や感情ではなく、明確で体系的に設定したいトレーダーのために設計されています。本ツールは、クラシックなプライスアクション(高値更新・安値切り下げ)と最新のブレイクアウト認識ロジックを組み合わせ、次に来るべき論理的なストップレベルを正確に特定します。トレンド相場、レンジ、急速なブレイクアウト局面のいずれであっても、最適な SL ゾーンとその状態(“new”、“broken”、“valid”)をチャート上に直接表示します。さらに今回、SL 距離の %ADR 表示も新たに追加されています。 主な特徴 マーケット構造に基づく自動ストップ配置 • 市場構造とリアルタイムの値動きに基づき、意味のあるストップロスレベルを自動検出します。 スマートなブレイクアウト感知 • 急激な方向転換やブレイクアウトにも柔軟に対応し、早すぎるストップ調整を避けます。 SL %ADR の表示 • ストップロスまでの距離を ADR(Averag
ARIScalp is a powerful trading companion designed to generate high-probability entry signals with dynamic TP/SL/DP levels based on volatility. Built-in performance tracking shows win/loss stats, PP1/PP2 hits, and success rates all updated live. Key Features: Buy/Sell signals with adaptive volatility bands Real-time TP/SL/DP levels based on ATR Built-in MA Filter with optional ATR/StdDev volatility Performance stats panel (Success, Profit/Loss, PP1/PP2) Alerts via popup, sound, push, or email Cus
FX Levels: あらゆる市場における非常に高精度なサポート&レジスタンス 概要 通貨ペア、株式指数、個別銘柄やコモディティなど、どのような市場でも信頼できるサポートとレジスタンスを特定したいですか? FX Levels は伝統的な “Lighthouse” メソッドと先進的な動的アプローチを融合し、ほぼ汎用的な精度を実現します。ブローカーの実務経験を活かし、自動化されたデイリー更新とリアルタイム更新を組み合わせることで、 FX Levels は反転ポイントを見つけ、利益目標を設定し、自信をもってトレードを管理するための手助けをします。今すぐ試してみて、サポート/レジスタンス分析の正確性がどれほどトレードを向上させるかを実感してください! 1. FX Levels がトレーダーにとって非常に有用な理由 非常に正確なサポート&レジスタンスゾーン • FX Levels は異なるブローカー環境でもほぼ同一のゾーンを生成するよう設計されており、データフィードの差異や時刻設定のずれによる不一致を解消します。 • つまり、どのブローカーを利用していても一貫したレベルが得られるため、戦
Trend Ai indicatorは、トレンドの識別と実用的なエントリポイントと反転アラートを組み合わせることで、トレーダーの市場分析を強化する優れたツールです。 この指標は、ユーザーが自信と正確さで外国為替市場の複雑さをナビゲートすることを可能にします トレンドAiインジケーターは、主要なシグナル以外にも、プルバックやリトレースメント中に発生するセカンダリエントリポイントを識別し、トレーダーが確立されたトレンド内の価格修正を活用できるようにします。 重要な利点: *MT4およびMT5の仕事 *明確な買いまたは売りシグナル *再描画しません ·すべての資産で動作します 私はeaやセットをtelegram it詐欺で販売しないように注意してください。 すべての設定はここでブログで無料です。  重要! 指示とボーナスを得るために購入後すぐに私に連絡してください! 私の他のプロダクトと同様、実質操作の監視はここに見つけることができます: https://www.mql5.com/en/users/mechanic/seller&nbsp ; 設定および入力: すべての
SynaptixQuant Dominance Matrix: Institutional-Grade Market State Extraction Engineered for traders who require a data-driven view of market behaviour beyond surface-level indicators. The Synaptix Quant (SQ) Dominance Matrix is not a conventional currency strength display. Behind its intentionally streamlined interface runs a sophisticated analytical architecture designed to quantify market conditions with precision. Every output is generated through layered signal processing built to identify d
- Real price is 80$ - 45% Discount (It is 45$ now) Contact me for extra bonus   indicator, instruction or any questions! - Lifetime update free - Non-repaint - Related product: Gann Gold EA - I just sell my products in Elif Kaya Profile, any other websites are stolen old versions, So no any new updates or support. Advantages of  M1 Scalper Pro  Profitability: M1 Scalper Pro is highly profitable with a strict exit strategy. Frequent Opportunities: M1 Scalper Pro  takes advantage of numerous smal
IX Power MT5
Daniel Stein
4.92 (12)
IX Power: 指数、商品、暗号資産、外国為替市場の洞察を発見 概要 IX Power は、指数、商品、暗号資産、外国為替市場の強弱を分析するための多用途ツールです。 FX Power が全ての利用可能な通貨ペアデータを活用して外為ペアで最高の精度を提供する一方、 IX Power は基礎資産の市場データにのみ焦点を当てています。この特性により、 IX Power は非外為市場に最適であり、単純な外為分析にも信頼性の高いツールです。どのチャートでもスムーズに機能し、取引判断を向上させるための明確で実行可能な洞察を提供します。 1. IX Power がトレーダーにとって価値がある理由 複数市場での強弱分析 • IX Power は指数、商品、暗号資産、外為シンボルの強弱を計算し、それぞれの市場に合わせた洞察を提供します。 • US30、WTI、ゴールド、ビットコイン、または通貨ペアなどの資産を監視して取引機会を発見できます。 幅広い市場に適応 • 外為取引では、 FX Power が関連する全ての通貨ペアを分析することで比類のない精度を提供します。 • IX Power
優れたテクニカルインジケーター「Grabber」をご紹介します。これは、すぐに使える「オールインワン」トレーディング戦略として機能します。 ひとつのコードに、市場のテクニカル分析ツール、取引シグナル(矢印)、アラート機能、プッシュ通知が強力に統合されています。 このインジケーターを購入された方には、以下の特典を無料で提供します: Grabberユーティリティ:オープンポジションを自動で管理するツール ステップバイステップのビデオマニュアル:インジケーターのインストール、設定、取引方法を解説 カスタムセットファイル:インジケーターをすばやく自動設定し、最大限の成果を出すための設定ファイル 他の戦略はもう忘れてください!Grabberだけが、あなたを新たなトレードの高みへと導いてくれるのです。 Grabber戦略の主な特徴: 推奨タイムフレーム:M5〜H4 対応通貨ペア・資産:どれでも使用可能ですが、私が実際に検証した以下を推奨します(GBPUSD、GBPCAD、GBPCHF、AUDCAD、AUDUSD、AUDSGD、AUDCHF、NZDUSD、NZDCAD、EURCAD、EURUSD、E
Quantum TrendPulse を ご紹介します。これは、   SuperTrend   、   RSI   、および Stochastic のパワーを 1 つの包括的なインジケーターに組み合わせて、取引の可能性を最大限に引き出す究極の取引ツールです。精度と効率を求めるトレーダー向けに設計されたこのインジケーターは、市場のトレンド、勢いの変化、最適なエントリー ポイントとエグジット ポイントを自信を持って特定するのに役立ちます。 主な特徴: SuperTrend 統合: 現在の市場動向に簡単に追従し、収益性の波に乗ることができます。 RSI精度: 買われすぎと売られすぎのレベルを検出し、市場の反転のタイミングに最適で、SuperTrendのフィルターとして使用されます。 確率的精度: 確率的振動を活用して、変動の激しい市場で隠れたチャンスを見つけます。SuperTrend のフィルターとして使用されます。 マルチタイムフレーム分析:   M5 から H1 または H4 まで、さまざまなタイムフレームで市場を常に把握します。 カスタマイズ可能なアラート: カスタム取引条件が満たされ
ARIPoint
Temirlan Kdyrkhan
1 (1)
ARIPoint is a powerful trading companion designed to generate high-probability entry signals with dynamic TP/SL/DP levels based on volatility. Built-in performance tracking shows win/loss stats, PP1/PP2 hits, and success rates all updated live. Key Features: Buy/Sell signals with adaptive volatility bands Real-time TP/SL/DP levels based on ATR Built-in MA Filter with optional ATR/StdDev volatility Performance stats panel (Success, Profit/Loss, PP1/PP2) Alerts via popup, sound, push, or email Cu
Gartley Hunter Multi - An indicator for searching for harmonic patterns simultaneously on dozens of trading instruments and on all possible timeframes. Manual (Be sure to read before purchasing) | Version for MT4 Advantages 1. Patterns: Gartley, Butterfly, Shark, Crab. Bat, Alternate Bat, Deep Crab, Cypher 2. Simultaneous search for patterns on dozens of trading instruments and on all possible timeframes 3. Search for patterns of all possible sizes. From the smallest to the largest 4. All fou
Weis Wave with Alert MT5
Trade The Volume Waves Single Member P.C.
4.94 (17)
Rental/Lifetime Package Options and Privileges  Rent Monthly Six Months   Yearly/Lifetime Weis Wave with Speed with Alert+Speed Index x x x Manual  x x x Quick Set up Video x x x Blog x x x Lifetime Updates x x x Setup and Training Material x x Discord Access Channel "The SI traders"          x Rectangle Break Alert Tool      x How to trade with it:    http://www.tradethevolumewaves.com   ** If you purchase please contact me to setup your  : Training Room and  complete manual access.  Wei
まず第一に、この取引ツールはノンリペイント、ノンリドロー、ノンラグの指標であり、プロの取引に理想的ですことを強調する価値があります。 オンラインコース、ユーザーマニュアル、デモ。 スマートプライスアクションコンセプトインジケーターは、新米から経験豊富なトレーダーまで、非常 に強力なツールです。Inner Circle Trader AnalysisやSmart Money Concepts Trading Strategiesなど、20以上の有用な指標を1つに組み合わせています。このインジケーターはスマートマネーコンセプトに焦点を当て、大手機関の取引方法を提供し、彼らの動きを予測するのに役立ちます。 特に、流動性分析に優れており、機関がどのように取引しているかを理解しやすくしています。市場のトレンドを予測し、価格の動きを慎重に分析するのに優れています。機関の戦略とトレードを合わせることで、市場の動向についてより正確な予測ができます。このインジケーターは多目的であり、市場構造を分析し、重要な注文ブロックを特定し、さまざまなパターンを認識するのに優れています。 このインジケーター
次世代の自動化された需要と供給のゾーン。どのチャートでも機能する新しい革新的なアルゴリズム。すべてのゾーンは、市場の価格行動に従って動的に作成されています。 2種類のアラート --> 1) 価格がゾーンに達したとき 2) 新しいゾーンが形成されたとき もう 1 つの役に立たない指標はありません。実績のある完全な取引戦略を手に入れることができます。     新機能:     価格が需給ゾーンに達したときにアラートを出す     新しい需給ゾーンが作成されたときにアラートを発します     プッシュ通知アラート     ピップ単位のゾーン幅ラベル     MTF のもう 1 つのタイムフレーム。したがって、現在より 2 時間足高いのではなく、現在より 3 時間足し上に見えるようになります。     アラート/ゾーン/MTF 機能を有効/無効にするボタン あなたが得る利点:     取引から感情を取り除きます。     取引エントリをオブジェクト化します。     確率の高いセットアップで利益を上げましょう。     描画ゾーンから時間を節約します。
ACB Breakout Arrows MT5
KEENBASE SOFTWARE SOLUTIONS
5 (1)
ACB Breakout Arrows インジケーターは、特別なブレイクアウトパターンを検出することで、市場における重要なエントリーシグナルを提供します。このインジケーターはチャートを常に監視し、一方向に勢いが定着してきた段階で、主要な値動きの直前に精度の高いエントリーシグナルを表示します。 マルチシンボル・マルチタイムフレームスキャナーはこちらから - ACB Breakout Arrows MT5 用スキャナー 主な機能 ストップロスとテイクプロフィットの水準が自動で表示されます。 すべての時間足のブレイクアウトシグナルを監視できるMTFスキャナーダッシュボードを搭載。 デイトレーダー、スイングトレーダー、スキャルパーに最適。 シグナル精度を高めるための最適化されたアルゴリズム。 損益分岐点やスキャルピングターゲットに使える特別なライン(クイックプロフィットライン)。 勝率、平均利益などのパフォーマンス分析メトリクスを表示。 リペイントなし。 トレードの確認 - 低確率のトレードを除外するために ACB Trade Filter インジケーター を使用してください。 強い買い:
The Trend Forecaster indicator utilizes a unique proprietary algorithm to determine entry points for a breakout trading strategy. The indicator identifies price clusters, analyzes price movement near levels, and provides a signal when the price breaks through a level. The Trend Forecaster indicator is suitable for all financial assets, including currencies (Forex), metals, stocks, indices, and cryptocurrencies. You can also adjust the indicator to work on any time frames, although it is recommen
TREND FLOW PRO は、市場が実際に方向転換するポイントを特定するのに役立ちます。このインジケーターは、トレンドの反転や、大口の市場参加者が再び参入するエリアを可視化します。 チャート上の BOS マークは、真のトレンド転換および上位時間足の重要なレベルを示します。インジケーターのデータはリペイントされず、各バーの確定後もチャート上に残ります。 インジケーターの主な要素: BOS FLOW – トレンド波動および実際のトレンド転換。大口の市場参加者のエントリーと、その存在の確認を示します(数字で表示)。 BOS FILL – トレンドの方向に沿ってバーを色分けします。 「大口プレイヤー」のエントリーポイントや、トレンドが変化するポイントを示します。 シグナルレベル: BOS – 強さが未確定の参加者によるエントリー(多くの場合、メイントレンド内の調整)。 Move SL – 大口参加者がポジションをどのように移動させているかを視覚的に表示します。トレーダーがストップロスを調整する際の参考として使用できます。 Super BOS – 通常の BOS よりも優先度の高い大口参加者
これはほぼ間違いなく、MetaTraderプラットフォームで見つけることができる最も完全な調和価格形成自動認識インジケーターです。 19種類のパターンを検出し、フィボナッチプロジェクションをあなたと同じように真剣に受け止め、潜在的逆転ゾーン(PRZ)を表示し、適切なストップロスとテイクプロフィットレベルを見つけます。 [ インストールガイド | 更新ガイド | トラブルシューティング | よくある質問 | すべての製品 ] 19の異なる調和価格形成を検出します プライマリ、派生および補完フィボナッチ投影(PRZ)をプロットします 過去の価格行動を評価し、過去のすべてのパターンを表示します この指標は、独自の品質とパフォーマンスを分析します 適切なストップロスとテイクプロフィットのレベルを表示します ブレイクアウトを使用して適切な取引を通知します すべてのパターン比をグラフにプロットします 電子メール/音声/視覚アラートを実装します スコット・M・カーニーの本に着想を得て、この指標は最も純粋で急を要するトレーダーのニーズを満たすように設計されています。ただし、トレードを容易にする
作者のその他のプロダクト
ADR ST Patterns Strategy  is a modification of the classical  ADR  indicator. This simple indicator corresponds to the parameters specified in the  ST Patterns Strategy ( https://stpatterns.com/ ) .  Structural Target Patterns represents the market consistently divided into components. No trend lines, geometric proportions of the model itself, trading volume, or open market interest are needed for the formation of  ST Patterns . They are easily recognized and built only on the basis of breaking
FREE
Fractals Direction ST Patterns MT4 is a modification of Bill Williams' Fractals indicator, which allows you to specify any number of bars for finding a fractal. In the settings, it is also possible to set the number of points for determining the trend direction. The upward direction is determined if the last upper fractal is higher than the penultimate upper fractal. The downward direction is determined if the last lower fractal is lower than the penultimate lower fractal. This simple indicator
FREE
Fractals Direction ST Patterns MT5 is a modification of Bill Williams' Fractals indicator, which allows you to specify any number of bars for finding a fractal. In the settings, it is also possible to set the number of points for determining the trend direction. The upward direction is determined if the last upper fractal is higher than the penultimate upper fractal. The downward direction is determined if the last lower fractal is lower than the penultimate lower fractal. This simple indicator
FREE
ADR ST Patterns
Vladimir Poltoratskiy
4.5 (2)
ADR ST patterns is a modification of the classical ADR indicator. This simple indicator corresponds to the parameters specified in the ST patterns Strategy ( https://stpatterns.com/ ).   Structural Target patterns are the market itself, which is consistently divided into components. For the formation of ST patterns , no trend lines, geometric proportions of the model itself, trading volume, or open market interest are needed. They are easily recognized and built only on the basis of breaking thr
FREE
Fractals ST Patterns
Vladimir Poltoratskiy
4.5 (2)
Fractals ST Patterns is a modification of Bill Williams' Fractals indicator. Unlike a standard Fractals indicator, Fractals ST Patterns allows setting any number of bars to find a fractal. This simple indicator corresponds to the parameters specified in the ST Patterns Strategy ( https://stpatterns.com/ ) . Structural Target patterns are the market itself, which is consistently divided into components. For the formation of ST Patterns , no trend lines, geometric proportions of the model itself,
FREE
フィルタ:
DimitarMB
34
DimitarMB 2022.02.10 10:55 
 

ユーザーは評価に対して何もコメントを残しませんでした

Edison Munoz
47
Edison Munoz 2022.01.31 21:17 
 

Dear Vladimir, I need your help. I read your book from amazon kindle and implement a robot using your theory in CFDs. I'm testing rigth now, but I need a new compillation from your indicator becouse MQL5 say me that "Fractals ST Patterns Strategy.ex5 version is too old, it should be recompiled" Could you please help me?

------

Now with the update indicator works great again! thank you for your support!!! :)

Vladimir Poltoratskiy
8496
開発者からの返信 Vladimir Poltoratskiy 2022.02.01 15:06
Dear Edison. Updated version 3.0 from 2022.02.01 is ready!
削除済み 2020.08.15 12:28 
 

ユーザーは評価に対して何もコメントを残しませんでした

削除済み 2020.06.22 10:05 
 

ユーザーは評価に対して何もコメントを残しませんでした

3316589p
870
3316589p 2020.05.15 17:40 
 

ユーザーは評価に対して何もコメントを残しませんでした

削除済み 2019.01.14 06:39 
 

ユーザーは評価に対して何もコメントを残しませんでした

削除済み 2018.11.17 12:54 
 

ユーザーは評価に対して何もコメントを残しませんでした

Gennadiy Voltornist
11909
Gennadiy Voltornist 2018.02.04 19:01 
 

ユーザーは評価に対して何もコメントを残しませんでした

AleX0077
44
AleX0077 2017.11.15 12:28 
 

ユーザーは評価に対して何もコメントを残しませんでした

Daniel Andrejczuk
5597
Daniel Andrejczuk 2017.11.09 13:50 
 

ユーザーは評価に対して何もコメントを残しませんでした

レビューに返信