SMC Structure Analytics

SMC Structure Analytics

Professional Smart Money Concepts Market Structure Indicator for MetaTrader 5

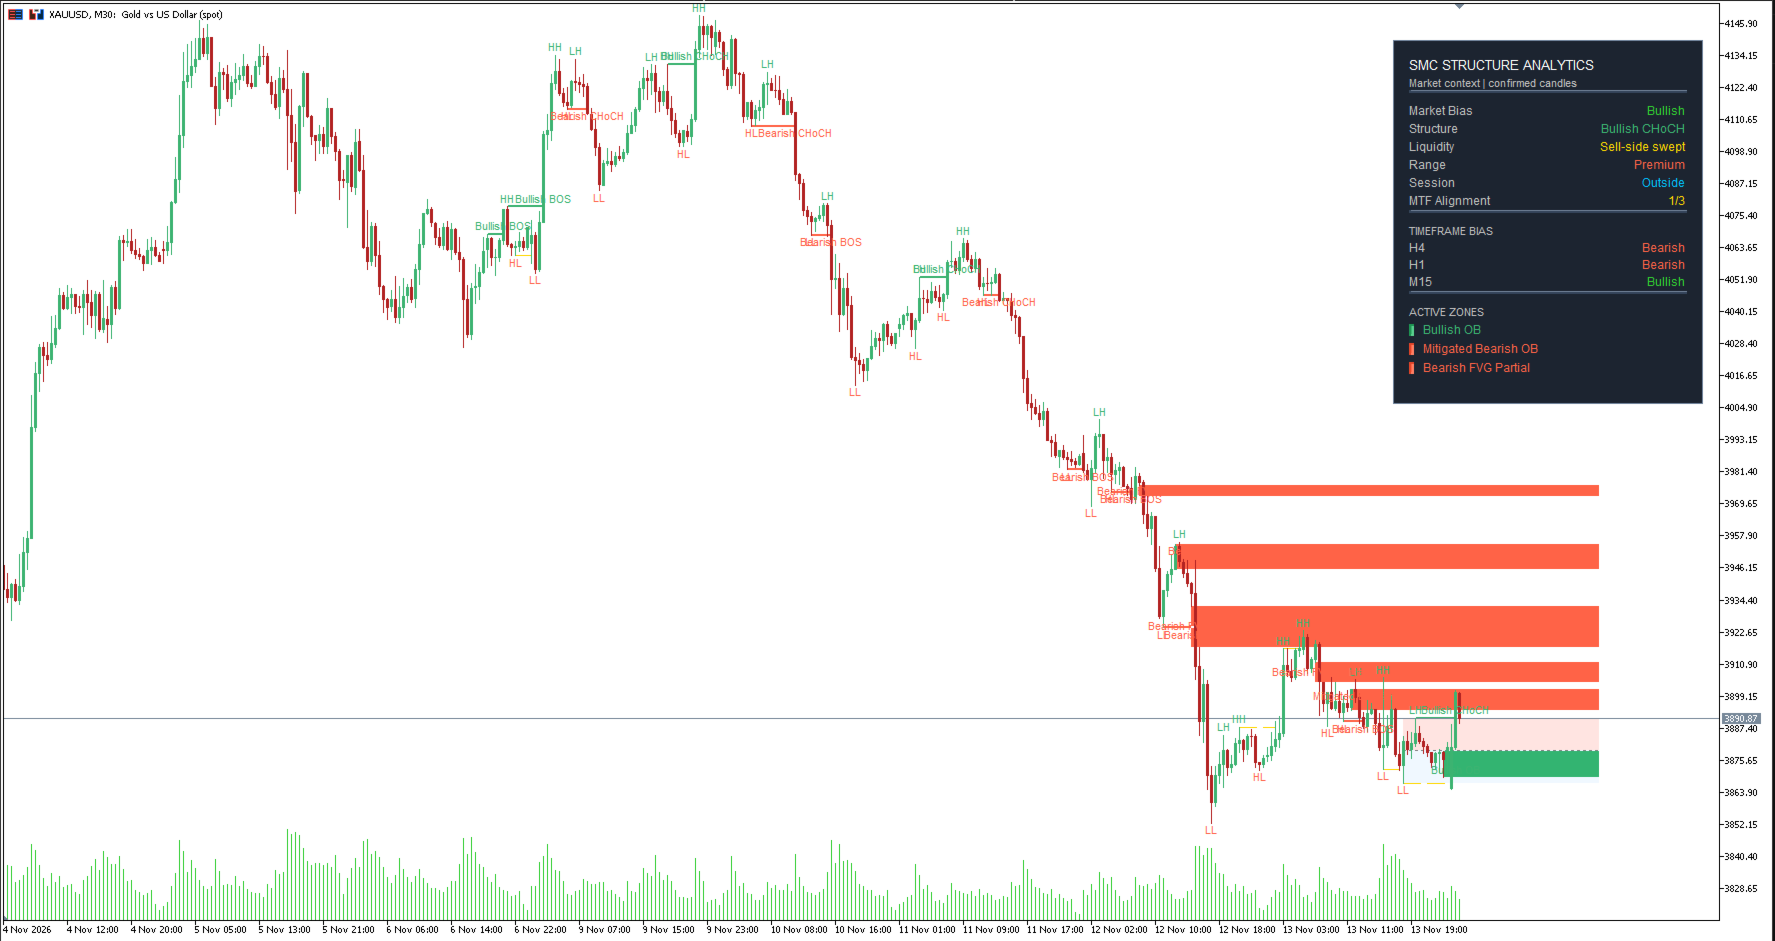
SMC Structure Analytics is a professional chart analysis indicator designed to simplify Smart Money Concepts analysis on MetaTrader 5.

The indicator combines market structure, BOS, CHoCH, Order Blocks, Fair Value Gaps, liquidity levels, liquidity sweeps, Premium and Discount zones, session levels, and multi-timeframe bias into one clean and organized interface.

It is designed for traders who want a clearer view of price structure without filling the chart with unnecessary objects and overlapping signals.

SMC Structure Analytics is an analysis tool. It does not place trades automatically, does not manage positions, and does not guarantee trading results.

Main Features

Market Structure Analysis

The indicator identifies and displays the main market structure points:

  • Higher High
  • Higher Low
  • Lower High
  • Lower Low
  • Bullish Market Structure
  • Bearish Market Structure
  • Major Structure
  • Optional Internal Structure

Market structure is calculated using confirmed swing points. A swing point is displayed only after the required number of confirmation candles has passed.

This confirmation process helps reduce unstable signals and prevents the indicator from relying on future candles for confirmed historical structure.

Break of Structure

The indicator detects bullish and bearish Break of Structure events.

Supported signals include:

  • Bullish BOS
  • Bearish BOS
  • Structure continuation
  • Break confirmation based on candle close

BOS events can be displayed directly on the chart and can also trigger optional alerts.

Change of Character

The indicator detects potential changes in market direction through Change of Character events.

Supported signals include:

  • Bullish CHoCH
  • Bearish CHoCH
  • Possible transition from bearish to bullish structure
  • Possible transition from bullish to bearish structure

CHoCH signals are displayed only when the defined structure rules are confirmed.

Order Blocks

SMC Structure Analytics identifies potential bullish and bearish Order Blocks based on the candle structure before a confirmed market structure break.

The indicator supports:

  • Bullish Order Blocks
  • Bearish Order Blocks
  • Fresh Order Blocks
  • Mitigated Order Blocks
  • Invalidated Order Blocks
  • Automatic removal of invalidated zones
  • Configurable Order Block lookback
  • Configurable maximum active zones
  • Configurable right-side zone extension

An Order Block can be removed automatically after price invalidates the zone according to the selected rules.

Order Blocks are intended to be used as areas of interest and should be combined with market structure, liquidity, and risk management.

Fair Value Gaps

The indicator detects bullish and bearish Fair Value Gaps using a three-candle price imbalance structure.

Each Fair Value Gap can be classified as:

  • Fresh
  • Partially Filled
  • Filled

Users can choose whether filled Fair Value Gaps remain visible on the chart.

Supported controls include:

  • Enable or disable Fair Value Gaps
  • Minimum Fair Value Gap size
  • Show or hide filled gaps
  • Maximum active Fair Value Gaps
  • Right-side extension
  • Optional creation and fill alerts

Liquidity Analysis

The indicator identifies several types of liquidity areas:

  • Equal Highs
  • Equal Lows
  • Buy-side Liquidity
  • Sell-side Liquidity
  • Previous Day High
  • Previous Day Low
  • London Session High and Low
  • New York Session High and Low

Liquidity levels are shown as clean horizontal levels and can be used to identify possible liquidity targets and reaction areas.

Liquidity Sweeps

The indicator detects potential liquidity sweeps when price takes liquidity beyond a previous high or low and closes back through the level.

Supported events include:

  • Buy-side Liquidity Sweep
  • Sell-side Liquidity Sweep
  • Optional sweep labels
  • Optional sweep alerts
  • Visual liquidity sweep lines

Sweep labels are disabled by default to keep the chart clean, but they can be enabled from the indicator settings.

Premium and Discount Zones

The indicator automatically calculates the latest confirmed market range and divides it into:

  • Premium Zone
  • Equilibrium
  • Discount Zone

Premium and Discount zones provide additional context for evaluating whether price is trading in the upper or lower half of the latest structure range.

Users can show or hide Premium and Discount labels while keeping the zones visible.

Multi-Timeframe Dashboard

The built-in dashboard provides a compact overview of the current market context.

The dashboard can display:

  • Current Market Bias
  • Current Structure
  • Liquidity Status
  • Premium or Discount Status
  • Current Session
  • Multi-Timeframe Alignment
  • Active Order Block count
  • Active Fair Value Gap count
  • Higher timeframe bias
  • Entry timeframe bias

The default dashboard timeframes are:

  • H4
  • H1
  • M15

These timeframes can be changed according to the trader's strategy.

The dashboard is designed to remain compact and readable without covering a large portion of the chart.

Chart Appearance

The indicator includes optional chart appearance controls:

  • Hide the chart grid
  • Use standard candlestick mode
  • Apply custom bullish candle color
  • Apply custom bearish candle color
  • Enable chart AutoScroll
  • Enable Chart Shift
  • Configure Chart Shift size

Chart appearance settings are applied once when the indicator is loaded.

The indicator stores the original chart settings and restores them when the indicator is removed, provided the user has not manually changed those settings while the indicator was active.

Alerts

Alerts are optional and disabled by default.

The indicator can alert the trader when:

  • Bullish BOS is detected
  • Bearish BOS is detected
  • Bullish CHoCH is detected
  • Bearish CHoCH is detected
  • Buy-side liquidity is swept
  • Sell-side liquidity is swept
  • A new Order Block is created
  • Price enters an Order Block
  • A Fair Value Gap is created
  • A Fair Value Gap is filled

Available alert methods include:

  • MetaTrader alert window
  • Push notifications
  • Email notifications
  • Optional sound notification through the terminal alert system

Alerts are deduplicated by event and candle time to reduce repeated notifications.

Confirmed Candle Analysis

The indicator is designed around confirmed candle analysis.

Confirmed events are based on closed candles and confirmed swing points. This means some signals may appear after a natural confirmation delay.

This delay is intentional. It helps avoid using future information for confirmed historical signals.

The indicator does not promise that every displayed event will remain relevant to future price movement. Market structure can change, zones can fail, and liquidity can be taken without producing a reversal.

Clean Chart Design

The indicator includes visual limits to prevent excessive chart clutter.

Default visual controls include:

  • Analysis history limited to a defined number of bars
  • Visual history limited to recent bars
  • Internal structure disabled by default
  • Sweep labels disabled by default
  • Maximum active zones limited
  • Filled Fair Value Gaps hidden by default
  • Session and Previous Day labels hidden by default
  • Compact Dashboard layout
  • Separate colors for bullish, bearish, liquidity, and contextual zones

These defaults are designed to give traders a clean starting layout while still allowing deeper customization.

Recommended Workflow

A possible workflow is:

  1. Start with the higher timeframe structure.
  2. Check the Dashboard market bias.
  3. Review the H4 and H1 structure.
  4. Identify the latest BOS or CHoCH.
  5. Check whether liquidity has been swept.
  6. Locate fresh Order Blocks or Fair Value Gaps.
  7. Check whether price is in Premium, Equilibrium, or Discount.
  8. Use a lower timeframe for additional confirmation.
  9. Apply independent risk management before entering any trade.

The indicator should be used as a market structure and context tool, not as an automatic entry system.

Recommended Default Settings

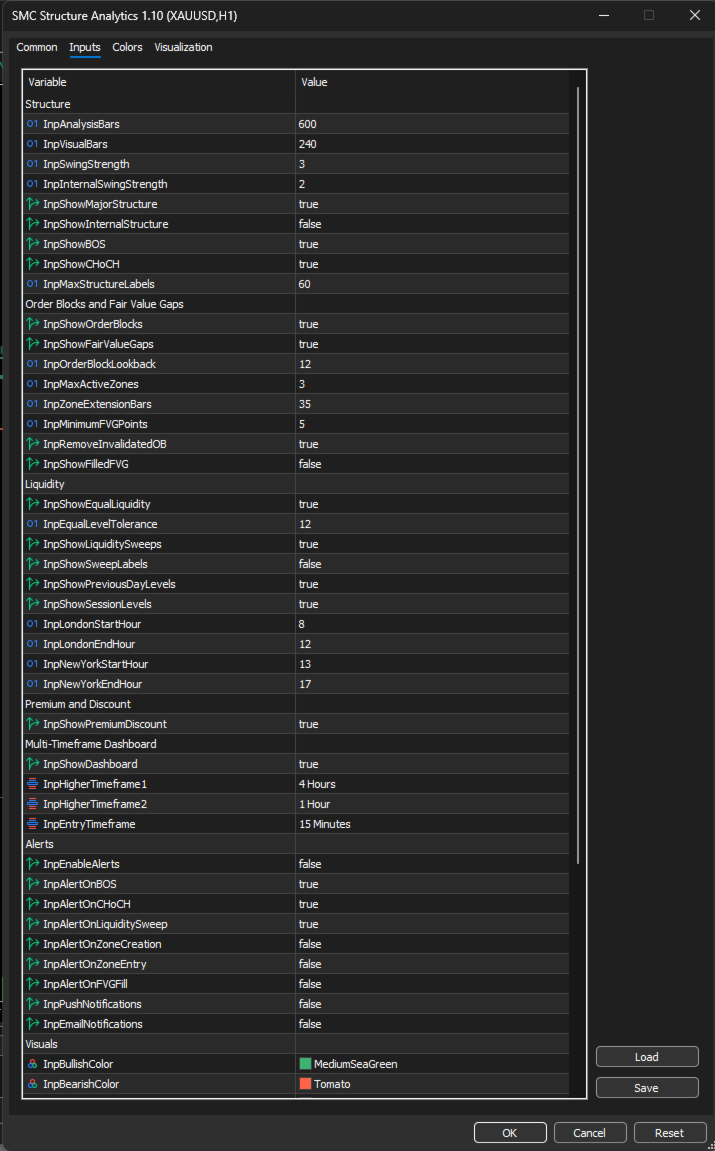
Recommended starting settings:

  • Analysis Bars: 600
  • Visual Bars: 240
  • Swing Strength: 3
  • Internal Swing Strength: 2
  • Show Major Structure: Enabled
  • Show Internal Structure: Disabled
  • Show BOS: Enabled
  • Show CHoCH: Enabled
  • Maximum Active Zones: 3
  • Order Block Lookback: 12
  • Zone Extension Bars: 35
  • Show Sweep Labels: Disabled
  • Show Level Labels: Disabled
  • Show Filled FVG: Disabled
  • Dashboard: Enabled
  • Chart Style: Enabled

These settings are only starting points. Different symbols and timeframes may require different values.

Supported Markets

The indicator is designed to work on a wide range of MetaTrader 5 symbols, including:

  • Forex
  • Gold
  • Silver
  • Indices
  • Commodities
  • Cryptocurrencies
  • CFDs
  • Other broker-supported instruments

Session calculations use broker server time. Traders should adjust the London and New York session inputs according to their broker's server timezone.

Supported Timeframes

The indicator can be used on all standard MetaTrader 5 timeframes.

It can be used for:

  • Scalping
  • Intraday analysis
  • Swing trading
  • Higher timeframe analysis
  • Multi-timeframe confirmation

The quality and frequency of signals depend on the selected symbol, timeframe, market volatility, and available historical data.

Performance

The indicator is designed to limit unnecessary chart objects and calculations.

Performance controls include:

  • Limited analysis history
  • Limited visual history
  • Limited active zones
  • Optional internal structure
  • Optional labels
  • No external DLLs
  • No WebRequest calls
  • No automatic trading functions
  • No external files required for normal operation

The indicator recalculates on new chart bars and uses confirmed candle logic for its main analysis.

Input Validation

The indicator validates important settings before loading.

Invalid settings such as incorrect swing strengths, invalid session hours, negative thresholds, or invalid chart shift values are rejected during initialization.

This helps prevent unexpected behavior caused by incorrect user parameters.

Important Limitations

Smart Money Concepts are not globally standardized. Different traders may define BOS, CHoCH, Order Blocks, Liquidity, and Fair Value Gaps differently.

This indicator uses deterministic internal rules to produce consistent results, but its definitions may differ from another trader's methodology.

Swing points require confirmation. Therefore, a swing high or swing low may appear later than the actual turning point.

A valid structure break does not guarantee continuation.

An Order Block does not guarantee a reaction.

A Fair Value Gap does not guarantee that price will fill or respect the zone.

A liquidity sweep does not guarantee a reversal.

The indicator does not provide financial advice and does not guarantee profits.

No Automatic Trading

SMC Structure Analytics does not:

  • Open trades
  • Close trades
  • Modify orders
  • Set stop loss
  • Set take profit
  • Manage account risk
  • Use martingale
  • Use recovery systems
  • Send orders to the broker

All trading decisions remain under the user's control.

Risk Disclaimer

Trading financial markets involves substantial risk. Past market behavior does not guarantee future results.

This indicator is provided for technical analysis and educational purposes only. Always perform your own analysis, use appropriate risk management, and test the indicator on a demo account before using it in live trading.
おすすめのプロダクト
CosmiCLab SMC FIBO CosmiCLab SMC FIBO is a professional trading indicator designed for traders who use Smart Money Concepts (SMC), market structure analysis and Fibonacci retracement levels. The indicator automatically detects market swings and builds Fibonacci levels based on the latest impulse movement. It also identifies market structure changes such as BOS (Break of Structure) and CHOCH (Change of Character), helping traders understand the current market direction. CosmiCLab SMC FIBO also pr
RBreaker Gold Indicatorsは、金先物の短期日内取引戦略であり、トレンドフォローと日内反転の2つの取引手法を組み合わせたものです。トレンド相場での利益を捉えるだけでなく、相場が反転した際には迅速に利確し、その流れに沿ってポジションを反転させることができます。 この戦略は、アメリカの雑誌『Futures Truth』において、15年連続で最も収益性の高い取引戦略トップ10に選ばれた実績を持ち、非常に長いライフサイクルを誇り、現在も国内外で広く使用・研究されています。 本インディケーターは、2026年の金先物の値動きに対応し、14日間のATR指標に基づいて、ブレイクアウト係数A、観察係数B、リバーサル係数Rをより合理的な値で定義しています。非常に優れたインディケーターであり、安定的な年間収益を実現しています。ぜひおすすめします〜
Structure King AI Signal Structure King AI Signal is a professional MetaTrader 5 trading indicator designed to help traders analyze market structure, trend direction, multi-timeframe confirmation and trade management from one clean dashboard. Key Features • Market Structure & Trend Analysis • BUY / SELL Signals • Multi-Timeframe (HTF) Confirmation • Entry Price Levels • Dynamic Stop Loss (SL) • TP1 / TP2 / TP3 Levels • ATR Volatility Analysis • ADX Trend Strength Filter • Adaptive Market Filter
Reversal Master for MT5 Reversal Master for MT5 は、MetaTrader 5 向けのノンリペイント型リバーサルインジケーターです。潜在的な市場の転換ポイントを検出し、各ヒストリカルシグナルの後に発生した最大の有利な値動きを表示することで、過去の類似した局面で価格がどのように動いたかをより深く理解するのに役立ちます。 MT5 版では、元の MT4 版 Reversal Master のおなじみの反転シグナルロジックを維持しつつ、ビジュアル面の強化、ヒストリカル統計、ポイントベースのサマリーパネルを追加しています。MetaTrader 5 がサポートするあらゆる銘柄・時間足で動作し、単体のリバーサルツールとしてはもちろん、既存ストラテジー内の追加フィルターや、Expert Advisor 用のシグナルソースとしても利用できます。 Key Features 潜在的なトレンド転換ポイントを自動検出。 ノンリペイントの矢印シグナル:バーが確定した後は位置が変わらず、消えません。 2 つの動作モード:Mode 1 Classic(従来型 MT4 ロジ
# DRAWDOWN INDICATOR V4.0 - The Essential Tool to Master Your Trading ## Transform Your Trading with a Complete Real-Time Performance Overview In the demanding world of Forex and CFD trading, **knowing your real-time performance** isn't a luxury—it's an **absolute necessity**. The **Drawdown Indicator V4.0** is much more than a simple indicator: it's your **professional dashboard** that gives you a clear, precise, and instant view of your trading account status. --- ## Why This Indicator
"Impulses and Corrections 5" is created to help traders navigate the market situation. The indicator shows multi-time frame upward and downward "Impulses" of price movements. These impulses are the basis for determining the "Base" , which is composed of zones of corrections of price movements, as well as "Potential" zones for possible scenarios of price movement. Up and down impulses are determined based on a modified formula of Bill Williams' "Fractals" indicator. The last impulse is always "U
SMART TRADING SIGNALS MT5 Precision. Clarity. Confidence. Elevate Your Trading Experience with Smart Trading Signals Smart Trading Signals MT5 is a professional trading indicator designed to provide traders with a clearer, more organized view of market movements. Through an elegant visual interface, it presents trading opportunities and essential price levels in a comprehensive design that combines precision, clarity, and ease of use. Developed to be a practical trading companion, Smart Trad
STRICTLY FOR BOOM INDEX ONLY!!!!! Here I bring the Maximum Trend Arrows OT1.0 MT5 indicator. This indicator is made up of a combination of different trend indicators for entries and exits, for entries an orange arrow will paint on the chart below the current market and a red flag for closing of trades and it produces buy arrows only. When the orange arrow appears, it will appear along with it's sound to notify you. The 1H timeframe is recommended, don't use it anywhere else than on the 1H timefr
What Is Trend Master Pro? Trend Master Pro   is a professional-grade trend trading indicator built for MetaTrader 5. It was designed with one goal in mind — to keep you on the right side of the market at all times by combining three powerful technical tools into a single, clean, easy-to-read display directly on your price chart. Instead of cluttering your screen with multiple separate indicators, Trend Master Pro fuses an   EMA Ribbon trend filter , a   ZigZag swing point engine , and a   breako
Your Trend Friend
Luigi Nunes Labigalini
5 (1)
The trend is your friend! Look at the color of the indicator and trade on that direction. It does not  repaint. After each candle is closed, that's the color of the trend. You can focus on shorter faster trends or major trends, just test what's most suitable for the symbol and timeframe you trade. Simply change the "Length" parameter and the indicator will automatically adapt. You can also change the color, thickness and style of the lines. Download and give it a try! There are big movements w
The indicator is designed to help in making a decision on the direction of trading (buy or sell). It is a history scanner that searches for matches of the current pattern (combination of several current bars) with historical data in percentage terms by the relative vertical position of candles relative to each other, the size of each candle, the size of the candle body and the candle shadows. In history, the matches found are indicated by vertical lines on the candle of the beginning of the soug
プレミアムレベルは、正しい予測の精度が80%を超える独自の指標です。 この指標は、最高のトレーディングスペシャリストによって2か月以上テストされています。 あなたが他のどこにも見つけられない作者の指標! スクリーンショットから、このツールの正確さを自分で確認できます。 1は、1キャンドルの有効期限を持つバイナリーオプションの取引に最適です。 2はすべての通貨ペア、株式、商品、暗号通貨で機能します 手順: 赤い矢印が表示されたらすぐにダウントレードを開き、青い矢印が表示されたら閉じます。青い矢印の後に開くこともできます。 試してテストしてください!推奨設定はデフォルトです! 日足チャートで最高の精度を示します! インディケータは、2600 Pipsの収益性に対して、約10Pipsという非常に小さなマージンを使用します。
NeuralTickによるCleanTrend — 過去を決して書き換えないトレンド指標。履歴上は美しいのに、ライブトレードではシグナルを書き換えてしまう指標にうんざりしていませんか? ノイズと欺瞞にうんざりしているトレーダーがCleanTrendを選ぶ3つの理由: 100%再描画なし。 ラインの色は永久に固定されます。過去のバーが後から変わることは一切ありません — ストラテジーテスターでご確認ください。 デュアルノイズフィルター。 価格が設定したしきい値(MinMove)を超えかつ複数のバーにわたって方向を維持した(ConfirmBars)場合にのみシグナルが出現します。レンジ相場での「ノコギリ刃」とはおさらばです。 状況を逃さないアラートシステム。 ポップアップウィンドウ、サウンド、ジャーナル記録、スマートフォンへのプッシュ通知(MetaTrader 5アプリ)。ターミナルが閉じていても、トレンド変化を即座に把握できます。 CleanTrendはチャートをパネルで埋め尽くしません — シンプルなカラーラインのみ:青(買い) または 赤(売り)。エントリー価
TRI Visualizer Enhanced - 熱力学的市場分析の革命 概要 TRI(Thermal Range Indicator)Visualizer Enhanced は、従来のテクニカル分析を超越した、物理学の熱力学理論を応用した革新的なマーケット分析インジケーターです。市場の価格変動を「熱力学的エネルギー」として捉え、これまで見落とされていた市場の微細な変化を高精度で検出します。 革新的な仕組み 1. デュアル計算エンジン クラシックTRIモード 基本公式: |終値-始値| + (高値-安値) ローソク足の実体とヒゲを統合した純粋なボラティリティ測定 シンプルで直感的、あらゆる市場環境で安定動作 熱力学的TRIモード(独自開発) 価格加速度 :2次微分による価格変化の勢いを測定 出来高変化率 :相対的な出来高の変化を動的に評価 ポジションエネルギー :正規化された価格変動エネルギーを計算 熱力学的係数 :物理学の熱力学法則を市場分析に応用 2. 高度な平滑化システム SMA(単純移動平均) :基本的なノイズ除去 EMA(指数移動平均) :最新データ重視の平滑化
これはほぼ間違いなく、MetaTraderプラットフォームで見つけることができる最も完全な調和価格形成自動認識インジケーターです。 19種類のパターンを検出し、フィボナッチプロジェクションをあなたと同じように真剣に受け止め、潜在的逆転ゾーン(PRZ)を表示し、適切なストップロスとテイクプロフィットレベルを見つけます。 [ インストールガイド | 更新ガイド | トラブルシューティング | よくある質問 | すべての製品 ] 19の異なる調和価格形成を検出します プライマリ、派生および補完フィボナッチ投影(PRZ)をプロットします 過去の価格行動を評価し、過去のすべてのパターンを表示します この指標は、独自の品質とパフォーマンスを分析します 適切なストップロスとテイクプロフィットのレベルを表示します ブレイクアウトを使用して適切な取引を通知します すべてのパターン比をグラフにプロットします 電子メール/音声/視覚アラートを実装します スコット・M・カーニーの本に着想を得て、この指標は最も純粋で急を要するトレーダーのニーズを満たすように設計されています。ただし、トレードを容易にする
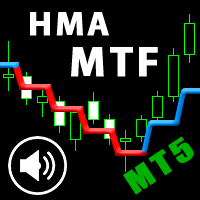
This is an advanced multi-timeframe version of the popular Hull Moving Average (HMA) Features Two lines of the Hull indicator of different timeframes on the same chart. The HMA line of the higher timeframe defines the trend, and the HMA line of the current timeframe defines the short-term price movements. A graphical panel with HMA indicator data from all timeframes at the same time . If the HMA switched its direction on any timeframe, the panel displays a question or exclamation mark with a tex
PatternScope — Multi-Pattern Recognition for MT5 PatternScope is a multi-pattern recognition indicator for MetaTrader 5. It scans price action for classic chart patterns, confirms breakouts, and draws clear   Entry, Stop Loss and Take Profit   levels. A compact dashboard shows the latest pattern, bias and Risk:Reward. Patterns:   Double Top/Bottom, Triple Top/Bottom, Head and Shoulders (and inverted), Bullish & Bearish Flag, Pennant, Rising & Falling Wedge, Triangle, Rectangle, Cup and Handle —
Noize Absorption Index - is the manual trading system that measures the difference of pressure between bears forces and bulls forces. Green line - is a noize free index that showing curent situation. Zero value of index shows totally choppy/flat market.Values above zero level shows how powerfull bullish wave is and values below zero measures bearish forces.Up arrow appears on bearish market when it's ready to reverse, dn arrow appears on weak bullish market, as a result of reverse expectation.
Inverted_Chart_EA Utility Expert Advisor Inverted_Chart_EA creates and maintains a mirror-inverted chart of any symbol and timeframe. It automatically generates a custom instrument (e.g. US30_INV ) and keeps its price history updated in real time, with bars mirrored around a chosen pivot. This utility gives traders a new way to analyze the market from a different perspective by flipping the chart upside down. Why use an inverted chart? Highlight hidden patterns – price formations that look ordin
PipFinite Trend PRO MT5
Karlo Wilson Vendiola
4.84 (562)
Breakthrough Solution For Trend Trading And Filtering With All Important Features Built Inside One Tool! Trend PRO's smart algorithm detects the trend, filters out market noise and gives entry signals with exit levels. The new features with enhanced rules for statistical calculation improved the overall performance of this indicator. Important Information Revealed Maximize the potential of Trend Pro, please visit www.mql5.com/en/blogs/post/713938 The Powerful Expert Advisor Version Automatin
Trend Monitor MT5
Pavel Zamoshnikov
4.5 (2)
The indicator generates early signals basing on ADX reading data combined with elements of price patterns. Works on all symbols and timeframes. The indicator does not redraw its signals. You see the same things on history and in real time. For better visual perception signals are displayed as arrows (in order not to overload the chart). Features The best results are obtained when the indicator works on two timeframes. For example: M30 – the indicator shows the main trend; M5 – the indicator gen
HAS RSI Signal — SL/TP自動計算機能付き プロフェッショナル・トレンドインジケーター HAS RSI Signal は、信頼性の高いクラシックな手法と最新のノイズ除去アルゴリズムを融合させた強力なトレーディングツールです。 平均足スムーズド(Heiken Ashi Smoothed) と RSI を組み合わせることで、トレンドの転換点や買われすぎ・売られすぎ圏からの脱出タイミングを正確に捉え、明確なエントリーシグナルを提示します。 主な特徴: 二重のフィルタリング: 平均足スムーズドで市場の「ノイズ」を除去し、RSIで勢い(モメンタム)の強さを確認します。 損切り・利確ラインの自動計算: 単にシグナルを出すだけでなく、ボラティリティ( ATR )に基づいた最適なストップロス(SL) と テイクプロフィット(TP)を自動で算出します。 視覚的な分かりやすさ: シグナルはチャート上にカラーキャンドルとして表示されるため、一目でトレンドを把握でき、取引画面をスッキリと保てます。 充実の通知機能: アラート、音声、スマートフォンへのプッシュ通知機能を搭載。チャンスを逃すこと
Heiken_Ashi_Bars - MT5用 高度なトレンド可視化ツール 概要 Heiken_Ashi_Bars は、市場のノイズを取り除き、真のトレンドを浮き彫りにするために設計された、強力で視覚的に直感的なカスタムインジケーターです。従来のローソク足チャートは不規則な動きが多く、ダマシのシグナルにつながることがよくあります。価格データを平均化することで、このインジケーターはプライスアクションを滑らかにし、トレンドの継続、反転、および利益の出るエントリーポイントを非常に簡単に見つけることができます。 主な機能と利点 究極のノイズリダクション: 小さな価格のスパイクや持ち合いのノイズをフィルタリングします。 明確な視覚的シグナル: 色分けされたバーにより、強気および弱気のモメンタムを一目で確認できます。 リペイントなし (No Repaint): バーが確定するとシグナルは固定され、過去のバーを再計算しません。 高度に最適化: ターミナルの遅延をゼロにするクリーンなコード。 多用途: すべての金融商品 (FX、インデックス、貴金属、仮想通貨) で完璧に機能します。 トレード方法 上昇
Auto Optimized RSI   は、正確な売買シグナルを提供するために設計された、使いやすいスマートな矢印インジケーターです。過去のデータを使ったトレードシミュレーションに基づき、各通貨ペアや時間足に最適なRSIの買い/売りレベルを自動で見つけ出します。 このインジケーターは、独立したトレードシステムとしても、既存の戦略の一部としても使用できます。特に短期トレーダーにとって便利なツールです。 従来のRSI(70/30など)の固定レベルとは異なり、 Auto Optimized RSI   はリアルな価格の動きとバックテスト結果に基づき、ダイナミックにレベルを調整します。勝率、ドローダウン、平均利益/損失といった重要な統計をモニターし、現在の市場に適応して、本当に機能するシグナルを提供します。 RSIが最適化されたレベルをクロスすると、チャート上に買い・売りの矢印が表示され、成功率の高いエントリーポイントを見つけるのに役立ちます。 ご購入後にご連絡いただければ、追加のツールや特別なトレードのヒントを無料でお渡しいたします! 皆様のトレードが成功しますように!
サポート線と抵抗線のプロットにうんざりしていませんか? サポートレジスタンス は、非常に興味深いひねりを加えてチャート内のサポートとレジスタンスラインを自動検出およびプロットするマルチタイムフレームインジケーターです。価格レベルは時間とともにテストされ、その重要性が高まるにつれて、ラインは太くなり、暗くなります。 [ インストールガイド | 更新ガイド | トラブルシューティング | よくある質問 | すべての製品 ] 一晩でテクニカル分析を強化 チャートを閲覧せずに重要な価格レベルを検出 一目ですべての価格レベルの相対的な強さを認識する すべての取引で最大30時間のプロットラインを節約 インジケーターは、すべての価格レベルの年齢を表示します インジケーターは再描画されていません 過去および現在の価格レベルは近接によって崩壊し、現在の市場行動に合わせて調整されます。動作は、必ずしもピークではない場所に線が引かれます。 価格レベルは、時間とともに拒否されるにつれて、より暗く、より広くなります ノイズを避けるために、重要でない価格レベルは定期的にクリアされます カスタマイズ可能な時間枠の
VELOS Trading Indicator Precision. Speed. Confidence. The VELOS Trading Indicator is a professional, non-repainting MT5 trading system developed by DC Trading to help traders identify high-probability trading opportunities with confidence. Designed for both beginner and experienced traders, VELOS combines trend analysis, momentum confirmation, and volatility filtering into one intelligent indicator, delivering precise entry and exit signals while reducing false setups. Built for fast-moving m
Harmonic Pattern Hunter Harmonic Pattern Hunter is a technical indicator for MetaTrader 5 that automatically identifies and draws high-probability harmonic patterns directly on the chart. It is designed to assist traders who use harmonic analysis as part of their trading methodology. How It Works The indicator scans historical and live price data for completed XABCD harmonic structures using Fibonacci ratio validation. When a valid pattern is detected, it draws the full pattern geometry, marks t
CosmiCLab METEORIT — SMC Fibo ZigZag CosmiCLab METEORIT is a professional Smart Money Concepts indicator designed for traders who want to identify institutional market movements. The indicator combines market structure analysis, liquidity sweeps, automatic Fibonacci levels and a smart ZigZag engine to help traders detect high-probability trading zones. It is designed for intraday trading on M15 and H1 , but also works well on other timeframes. Key Features Smart ZigZag market structure engine
WBS SMC Without Repaint – Ultimate XAUUSD Scalping Engine (M5 Timeframe) Take your Gold trading to the institutional level with "WBS SMC Without Repaint", a highly advanced premium indicator engineered specifically for XAUUSD (Gold) on the M5 (5-Minute) timeframe.  Built upon the core pillars of Smart Money Concepts (SMC) combined with precise algorithmic candle pattern recognition, this tool identifies high-probability institutional footprints in real-time. Best of all: 100% ABSOLUTELY
SMC Indicator BOS & CHoCH analyze market structure using Smart Money Concepts The indicator combines BOS (Break of Structure), CHoCH (Change of Character), Fair Value Gaps (FVG), Liquidity Sweep logic and ATR filtering to provide a structured view of market movements and potential trading opportunities. The indicator automatically identifies swing highs and swing lows and monitors structural breaks in the market. BOS (Break of Structure) identifies potential continuation of the current market st
このプロダクトを購入した人は以下も購入しています
Trend Sniper X
Sarvarbek Abduvoxobov
4.86 (44)
Trend Sniper X は、トレードの方向性と潜在的な反転ポイントを明確かつ正確に特定するのに役立つ、MetaTrader 5 用のマルチタイムフレーム・トレンドフォロー指標です。 MT4用: https://www.mql5.com/en/market/product/193245 価格情報: 現在の価格はプロモーション価格であり、今後のアップデートや新機能のリリースに伴い変更される場合があります。 ボーナス特典: このインジケーター用の無料自動売買アシスタントEAを入手するには、購入後に an 著者(開発者)へメッセージをお送りください。 Code2Profit チャンネル マルチタイムフレーム分析で相場をマスターしよう! Trend Sniper X で勝率を最大化する方法:重要なルールとセッションのコツ 技術仕様 プラットフォーム MetaTrader 5 インジケータータイプ マルチタイムフレーム・トレンドインジケーター 操作タイムフレーム あらゆるチャートタイムフレームに対応。個別に選択可能な上位タイムフレーム (M1–MN1) を搭載 主要銘柄 FX、ゴールド (X
新たな王者が登場 - インジケーター + 注文管理表示(TP1 + TP2 + TP3)+ オプションのTelegramシグナル送信機能付き(無料) (完全なトレード&シグナルシステム) ゴールド向け最高のEA: Gold Slayer このインジケーターには、高度な戦略、カスタマイズ可能な注文管理システム、そしてエンベロープ拡張を組み合わせた平均回帰システムが搭載されています。さらに、RSIなど複数のインテリジェントな確認フィルターによって、高確率の反転エントリーをBUY・SELLシグナルとして検出します。 単にトレードを学ぶだけでなく、複数ポジションを効果的に管理し、過去に利益を出しているオープンポジションで損失トレードをカバーする方法も学べます。 M5向けに構築・最適化されており、流動性が高くシグナルの精度が安定しているBTCUSDとXAUUSDで優れたパフォーマンスを発揮します。 このインジケーターは、ATRを基に自動計算されたエントリー、ストップロス、テイクプロフィットレベルを備えた明確なLong・Shortシグナルを提供するため、リスク管理が最初から組み込まれています。 マ
Entry Points Proは、注文を出す前に、どこでエントリーし、どこにストップを置き、どのロットで取引するかを示します。 価格 現在 199 USD、この価格での販売は 8 本です。その後は 249 USD、最終価格は 349 USD です。 私は相場のトレードで収入を得ており、それを公開しています。だから、このインジケーターを誰にでも売る必要はありません。自分の頭で考えるトレーダーのためのツールであり、魔法のボタンではありません。 ブレイクがなければ取引もありません。グレーの矢印はキャンセルされたシグナルです。価格がシグナル足をブレイクしなかったため、エントリーも損失もありません。 矢印はローソク足の確定時に表示され、リペイントしません。設定は2つ:あなたの資金と1回のトレードあたりのリスクです。 お支払い前にご確認ください:無料デモはMT5のストラテジーテスターで動作し、2分で済みます。ご購入後は、私が個人的に設定をお手伝いします。 2019年、私はこのインジケーターの実力を世界中に示しました。そのシグナルに従って手動で、リアル口座で、公開の場でトレードしたのです。口座は
あなたのトレード優位性を視界に入れよう! M5 Sniper は MeanFX による新しいインジケーターです。 正確なトレードシグナル と 適応型TP/SLレベル を組み合わせることで、結果として可能な限り最高の統計的トレードを実現します! 5回購入されるごとに価格が上昇し、次の価格は69$です 購入後に私にメッセージを送っていただければ、ヒント/ガイドとボーナスEAをお受け取りいただけます 何が他と違うのでしょうか? Gold XAUUSDにおける 実証済みの統計的パフォーマンス ( ほぼすべてのアセットで機能します 。一貫した結果が得られないまま何でも扱おうとするのではなく、1つの時間足をマスターすることに重点を置いています) 1日あたり1~8回のトレード を各シンボルで実行し、高い勝率と、すべての統計的優位性をこちら側に持つことができます チャート上には 確認済みの BUYおよびSELLシグナルのみを表示 適応型TPおよびSLレベル を各トレードごとにインジケーターが生成 平均Winrate 75%+ 平均 Signal Ratio 最低1.1+ アラーム と通知を 携帯電話
ULTRAは、「オールインワン」方式で機能するテクニカル指標です。市場を独自に分析し、売買シグナルを生成し、ストップロス注文を設定するための水準を表示し、利益を確定したり損失を最小限に抑えたりするためにポジションを決済すべきタイミングを提案します。 つまり、市場の分析方法や、水準(ストップロスをどこに設定すべきか)の見極め方がわからなくても、あるいは資金管理に苦労していても問題ありません。ULTRAがすべて代行してくれます! 購入者限定特典 :「ULTRA」インジケーターをご購入後、私にプライベートメッセージをお送りいただければ、「ULTRA BOT」を無料プレゼントとしてお受け取りいただけます。これは、このインジケーターからのシグナルに基づいて、オープンしたトレードを管理するのに役立つ特別なツールです(各トレードにストップロスを設定し、最適な結果が得られるよう、戦略のルールに従って自動的にトレードを決済します)。  また、インジケーターを最大限に活用できるよう、さまざまな資産向けの既成の設定も購入者の皆様に提供しています。これらの「超お得な特典」を無料で入手するには、私へダイレクトメ
Gann Made Easy   は、ミスター・ギャンの理論を使用した取引の最良の原則に基づいた、プロフェッショナルで使いやすい外国為替取引システムです。 W・D・ガン。このインジケーターは、ストップロスとテイクプロフィットレベルを含む正確な買いと売りのシグナルを提供します。 PUSH通知を利用して外出先でも取引可能です。 ご購入後、取引方法の説明と優れた追加インジケーターを無料で入手するには、私にご連絡ください! おそらく、ギャンの取引手法についてはすでに何度も聞いたことがあるでしょう。通常、ギャンの理論は初心者のトレーダーだけでなく、すでにある程度の取引経験がある人にとっても非常に複雑なものです。なぜなら、ギャンの取引手法は理論的にはそれほど簡単に適用できるものではないからです。私はその知識を磨き、最良の原則を私の外国為替インジケーターに組み込むために数年を費やしました。 このインジケーターは非常に簡単に適用できます。必要なのは、それをチャートに添付し、簡単な取引推奨事項に従うだけです。このインジケーターは常に市場分析の仕事を行い、取引の機会を探します。適切なエントリーポイントを検
SMC Intraday Formula
VividMind Digital Solutions
5 (26)
まず正直に言いましょう。 どんなインジケーターも、それ単体であなたを利益化させることはできません。もしそう言う人がいるなら、それは夢を売っているだけです。完璧な売買シグナル(矢印)を表示するインジケーターは、いくらでも“完璧に見せる”ことができます。正しい過去の区間を拡大して、勝ちトレードだけを切り取ればいいだけです。私たちはそれをしません。 SMC Intraday Formula はツールです。 市場構造を読み取り、最も高い確率の価格ゾーンを特定し、今この瞬間のスマートマネーの痕跡をシンプルな言葉で正確に示します。最終判断はあなたが行います。トレードを実行するのもあなたです。しかし今は「希望」ではなく「精度」でエントリーできます。 私たちはこのインジケーターを、ゴールド(XAUUSD)および主要FX通貨ペアで約3年間、日々のスキャルピングに使用してきました。M1、M5、M15、M30の主要ツールです。これは未来を予測しようとするのではなく、今まさに形成されている高確率セットアップを示し、その理由を説明します。 他のすべてのインジケーターと何が違うのか? ほとんどのトレーディングイ
SuperScalp Pro
Van Minh Nguyen
4.54 (37)
SuperScalp Pro - Professional Multi-Layer Confluence Scalping System SuperScalp Proは、複数の高度な確認フィルターを追加することで、従来のSupertrendを強化したスキャルピング向けインジケーターです。誤ったシグナルを大幅に減らしながら、成功する可能性がより高いBuy/Sellの取引機会を見つけるのに役立ちます。 BuyとSellの矢印がチャート上に明確に表示され、ATRに基づくStop LossとTake Profitのレベルもリアルタイムで自動計算されます。 ご購入後、MQL5で私にメッセージを送っていただくと、SuperScalp Pro Auto Trader EAを無料で受け取れるほか、ユーザーガイドとプライベートグループへのアクセスもご利用いただけます。 推奨設定ファイルをダウンロード: [Set File] 詳細なドキュメントは製品ブログでご覧いただけます: [User Guide] 最新情報を受け取るには公式チャンネルにご参加ください: [Official Channel] Sup
Gold Trend Coach MT5
Cristhian Alexander Gaibor Cuasquer
4.27 (11)
MetaTrader 5 向け、ゴールド(XAUUSD)のリペイントしない売買シグナル。すべてのシグナルに損切りラインと3つの利確ラインが付きます。BOS と CHoCH を使った Smart Money Concepts フィルターで、相場の構造に逆らわず、構造に沿ってトレードできます。パネル上のライブ・メンターが、エントリーから TP3 まで一歩ずつナビゲート。アラートはスマホとあなた自身の Telegram チャンネルに直接届きます。それが Gold Trend Coach。もう一人でトレードすることはありません。 ご購入特典・無料の購入者キット: 1. Telegram Alert Bridge: シグナルをあなた自身の Telegram チャンネルへ。チャートのスクリーンショットと日次レポート付き。 2. ユーザーマニュアルと設定ガイド。 受け取り方: キットはダウンロードファイルには含まれていません。購入後に MQL5 のメッセージでご連絡ください。当日中にお送りします。 $39 と $45 のローンチ価格分は完売しました。現在は次の10本まで $59、その後は $79
Boba Analysis Suite
Trade Ready Solutions LLC
5 (2)
Boba Analysis Suite Boba Analysis Suite は、MetaTrader 5 向けの分析インジケーターです。市場構造、重要な価格帯、相場全体の状況を、一つのチャート画面にまとめて表示します。 トレーダーおよびトレーディング指導者としての実務経験をもとに開発され、市場の方向性の評価、重要な価格水準の特定、複数の時間足を組み合わせた分析など、体系的な分析プロセスを支援します。 相場の背景を踏まえた分析 個々のシグナルの意味は、相場の状況によって変わります。Boba Analysis Suite は、現在のチャート状況をより大きな市場構造と関連付け、あらかじめ定めたルールに沿って取引アイデアを検討するための分析を支援します。 主な分析機能: トレンドと市場構造: 市場の方向性と、その背景にある構造を評価します。 重要な価格帯と価格水準: さらに分析すべき重要な領域を視覚的に表示します。 複数の時間足: 異なる時間足の情報を組み合わせ、相場全体の状況を評価します。 視覚的な分析プロセス: 分析情報をチャート上で直接確認できます。 自主的な取引判断を支援 Boba
FX Power: 通貨の強弱を分析して、より賢い取引を実現 概要 FX Power は主要通貨と金の実際の強弱をあらゆる市場状況で理解するための必須ツールです。強い通貨を買い、弱い通貨を売ることで、 FX Power は取引の意思決定を簡素化し、高い確率の取引機会を見出します。トレンドを追従する場合でも、極端なデルタ値を使用して反転を予測する場合でも、このツールはあなたの取引スタイルに完全に適応します。ただ取引するだけではなく、 FX Power で賢く取引をしましょう。 1. なぜ FX Power がトレーダーにとって非常に有益なのか 通貨と金のリアルタイム強弱分析 • FX Power は主要通貨と金の相対的な強弱を計算し、マーケットダイナミクスに関する明確な洞察を提供します。 • どの資産がリードしているか、または後れを取っているかを監視して、取引するペアを賢く選びましょう。 マルチタイムフレームの包括的なビュー • 短期、中期、長期のタイムフレームで通貨と金の強弱を追跡し、マーケットトレンドに基づいて取引戦略を調整できます。 • スキャルピングからスイングトレード
Azimuth Pro
Ottaviano De Cicco
5 (7)
Azimuth Pro V2:MT5向けシンセティック・フラクタル構造分析と確認済みエントリー 概要 Azimuth Pro は Merkava Labs によるマルチレベルスイング構造インジケーターです。4つのネストされたスイングレイヤー、スイングアンカーVWAP、ABCパターン検出、3タイムフレーム構造フィルタリング、そして確定バーでの確認済みエントリー — 1つのチャートで、ミクロスイングからマクロサイクルまでを網羅するワークフロー。 これはブラインドシグナル製品ではありません。ロケーション、コンテキスト、タイミングを重視するトレーダーのための構造ファーストワークフローです。 1. V2での変更点 シンセティック・マルチタイムフレームエンジン 上位タイムフレーム分析をMeridian Proと同じ独自のシンセティックアーキテクチャで一から再構築。よりクリーンなHTFコンテキスト、安定したライブ動作、従来のMTF同期問題なし。シンセティックエンジンは 固定比率タイムフレームカスケード (x2、x3、x4、x6)も可能にします — ブローカーのタイムフレーム間の任意なジャンプの代
FiboSniper Pro – Multi-Filter Fibonacci System with Auto SL/TP and Control Panel FiboSniper Proは、動的なFibonacci Envelopesと複数の確認フィルターを組み合わせ、選別されたBuyおよびSellシグナルを生成するテクニカルインジケーターです。FibonacciレベルはMoving AverageとATRを基に計算され、その後ADX、EMA、RSI、ATR、Volume、Time、Candle構造によってフィルタリングされます。インジケーターは、ATRに基づく自動Stop LossおよびTake Profitレベルをチャート上に直接表示し、さらに迅速な調整が可能なインタラクティブControl Panelを提供します。 ご購入後、MQL5で私にメッセージを送っていただくと、Auto Trader Xを無料で受け取れるほか、このインジケーターの取引シグナルを自動化する方法についての説明もご利用いただけます。 User GuideとSet Files: [Click here] 完全
M1 SNIPER は使いやすいトレーディングインジケーターシステムです。M1時間足向けに設計された矢印インジケーターです。M1時間足でのスキャルピングのためのスタンドアロンシステムとして、また既存のトレーディングシステムの一部としても使用できます。このトレーディングシステムはM1時間足での取引に特化して設計されていますが、他の時間足でも使用できます。元々、この手法はXAUUSDとBTCUSDの取引用に設計しましたが、他の市場においても役立つと考えています。 インジケーターのシグナルは、トレンドの方向と逆方向に取引できます。インジケーターのシグナルを利用して両方向に取引するのに役立つ特別な取引テクニックをご紹介します。この手法は、特別な動的なサポートとレジスタンスの価格帯を利用することに基づいています。 ご購入後、M1 SNIPER矢印インジケーターをすぐにダウンロードできます。さらに、M1 SNIPERツールのすべてのユーザーに、以下のスクリーンショットに表示されているApollo Dynamic SRインジケーターを無料で提供しています。この2つのインジケーターを組み合わせることで
Sqn Max Indicator Sqn Max is an exclusive indicator to trade the market with high effectiveness. The indicator is based on price action, volatility and trend. This indicator is as simple as possible but not too simple. The indicator can generate alerts to ease the trading process. You don't have to stay all day in front of your screen. The indicator can be used with any class of assets and with any time frame. It is possible to achieve better results trading our list of selected assets. We achi
Auto Optimized SpeedAngle は、継続的なウォークフォワード最適化(WFO:Walk-Forward Optimization)によりカーブフィッティング(過剰最適化)を排除した、機関投資家レベルのモメンタムベクトルシステムです。市場レジームの変化時に効果が低下する静的な入力に依存せず、アウトオブサンプル(OOS)検証を用いてパラメーターを動的に再キャリブレーションすることで、表示されるシグナルが単なる過去の偶然ではなく、確実な統計的優位性に基づいていることを保証します。 主な機関投資家向けフレームワーク ウォークフォワード最適化エンジン: ルックバック期間やしきい値の数千に及ぶ組み合わせを継続的にスキャンし、データをインサンプルとアウトオブサンプルに厳格に分離します。未検証のデータ環境において数学的優位性が証明された場合にのみ、新しいパラメーター設定を採用します。 定量的目的関数: 単なる純利益の追求ではなく、機関投資家レベルの安定性指標をターゲットとします。システム品質ナンバー(SQN)、期待値(1トレードあたりの平均Rマルチプル)、またはネットRの最適化を選
Apex Patterns PRO インジケーターをご購入いただくと、それに基づいたExpert Advisorを無料でご提供します。 自己最適化するチャートパターンおよびブレイクアウト分析システム 従来のパターンスキャナーは固定のパラメータに依存しているため、市場のボラティリティや構造が変化するとパフォーマンスが低下することがよくあります。 Apex Patterns PROは、構造的なチャートパターン認識、モメンタムフィルタリング、および統計的な自己最適化を単一の分析フレームワークに統合することで、変化する市場環境に適応するように設計されています。 適応型スキャンエンジン 自己最適化パターンモード 最近の履歴データから適切なパターンパラメータを自動的に検索し、静的な設定を使用するのではなく、現在の市場の動きに合わせてインジケーターの構造検出を適応させます。 スマートブレイクアウトフィルタリング 古典的なパターン認識と、モメンタム、ボリューム、プライスアクションの指標を組み合わせます。すべてのブレイクアウトを同じように扱うのではなく、システムが根底にある市場構造を評価し、現在の統計
Adaptive Price Action Engine インジケーターを購入すると、EAが無料に マルチタイムフレーム対応・自己最適化トレンド&ローソク足パターン分析 市場環境は常に変化しており、すべてのPrice Actionパターンが、あらゆる市場環境で同じ価値を持つわけではありません。 Adaptive Price Action Engine は、変化する市場環境への適応を目的として、 トレンド構造、マルチタイムフレーム分析、ローソク足パターン、統計的最適化 を1つの分析フレームワークに統合しています。 2つのアダプティブモード Dual Alpha Trend Mode 低い時間足と高い時間足のAlpha Trendパラメータを自動的に探索し、直近の市場動向に合わせてトレンド判定を適応させます。 Candlestick + Alpha Mode Alpha Trendによる市場レジーム判定と、 22種類の強気・弱気ローソク足パターン を組み合わせます。すべてのパターンを同じように扱うのではなく、さまざまなパターンの組み合わせを統計的に評価し、選択された市場環境において過去
次回アップデート — バージョン 2.52 近日公開!【新機能】 市場分析とトレードワークフローを強化する、4つの主要な新機能にご期待ください 皆様のトレードニーズに応える4つの新機能により、市場分析を次のレベルへと引き上げます。新機能をご紹介します: 1. TRADE OVERVIEW DASHBOARD 2. CONFLUENCE AT ZONE 3. STRONG & WEAK HIGH/LOW 4. OTE 1. TRADE OVERVIEW DASHBOARD 市場全体の状況をより簡単に把握できるダッシュボードです。トレード判断をサポートするガイダンスを提供し、市場分析とトレード計画を体系的に行えるよう支援します。すべてを1つの画面で確認できます。 マルチタイムフレーム市場概要(Multi-Timeframe Market Overview) 市場の方向性と価格構造をより明確に把握 市場状況をすばやく確認 体系的な市場分析とエントリー計画のためのガイダンス 2. CONFLUENCE AT ZONE 価格が重要なゾーンに入るとき…いくつのサポート要因が一致しているかを確認で
このインジケーターを購入された方には、以下の特典を 無料 で提供しています: 各トレードを自動で管理し、ストップロスとテイクプロフィットを設定し、戦略ルールに基づいてポジションを決済する補助ツール 「Bomber Utility」 様々な銘柄に合わせたインジケーターの設定ファイル(セットファイル) 「最小リスク」、「バランスリスク」、「待機戦略」 の3つのモードで使用できる Bomber Utility 用の設定ファイル このトレーディング戦略をすぐに導入・設定・開始できる ステップバイステップのビデオマニュアル ご注意: 上記の特典を受け取るには、MQL5のプライベートメッセージシステムを通じて販売者にご連絡ください。 オリジナルのカスタムインジケーター 「Divergence Bomber(ダイバージェンス・ボンバー)」 をご紹介します。これは、MACDのダイバージェンス(乖離)戦略に基づいた 「オールインワン」型のトレーディングシステム です。 このテクニカルインジケーターの主な目的は、価格とMACDインジケーターの間に発生するダイバージェンスを検出 し、将来の価格の動きを示
Power Candles V3 - 自己最適化型強弱インジケーター Power Candles V3は 、通貨や銘柄の強さを、適用されたすべてのチャート上で実行可能なトレードプランに変換します。単にローソク足を色分けするだけでなく、バックグラウンドでリアルタイムの自動最適化を実行し、目の前の銘柄に対して最適なストップロス、テイクプロフィット、およびシグナルの閾値を提示します。ワンクリックで実取引に適用でき、エントリーポイント、ストップロス、テイクプロフィットのラインが正確な価格位置にチャート上に表示され、方向性を示すアラートがリアルタイムで発動します。 このツールは、Stein Investmentsのエコシステムの一部です。  18種類以上のツールをすべて閲覧し、AIを活用したセットアップの推奨事項を入手し、  https://stein.investments でコミュニティに参加しましょう クローズしたバーごとに3,000回以上のトレードシミュレーション。9つの強さの状態。2つの戦略を並行してテスト。勝率の高い設定をワンクリックで適用。 なぜこれが必要なのか ほとんどの強
通貨強さウィザードは、取引を成功させるためのオールインワン ソリューションを提供する非常に強力な指標です。このインジケーターは、複数の時間枠のすべての通貨のデータを使用して、このまたはその外国為替ペアのパワーを計算します。このデータは、使いやすい通貨インデックスと通貨パワーラインの形式で表され、特定の通貨のパワーを確認するために使用できます。 必要なのは、取引したいチャートにインジケーターを接続することだけです。インジケーターは、取引する通貨の実際の強さを示します。このインジケーターは、トレンドに合わせて取引するときに有利に利用できる売買高の圧力の極値も示します。このインジケーターには、フィボナッチに基づく可能なターゲットも表示されます。 このインジケーターは、PUSH 通知を含むあらゆるタイプのアラートを提供します。 購入後ご連絡下さい。私の取引のヒントをあなたと共有し、素晴らしいボーナスインジケーターを無料で提供します! 幸せで有益な取引をお祈りします。
Tokyo Indicatorは、トレンドの方向性、潜在的な取引シグナル、および市場状況を視覚的に分かりやすく表示します。 色分けされた階段状のトレンドラインにより、強気局面(青色)と弱気局面(マゼンタ色)が明確に区別されます。トレンドの変化に合わせて表示される方向矢印は、売買の好機を強調します。 統合されたダッシュボードには、現在のシグナル、市場のバイアス(傾向)、モメンタム、ボラティリティ、シグナルの品質がひと目で分かるようにまとめられています。これにより、トレーダーはパネルを切り替えることなく、価格変動(プライスアクション)とインジケーターの数値を照らし合わせて分析を行うことができます。 すっきりとしたチャート表示と簡潔な市場概要により、Tokyo Indicatorはトレンド分析や取引判断における体系的なアプローチをサポートします。 あらゆる時間足や銘柄に対応しており、特に金(ゴールド)の取引に適しています。 トレンド スキャナーの強力なサポートを利用して、無料のインジケーターを入手し、プライバシーを守ります。あーみー!     設定 ShowHUD - チャート上のパネ
Naked Forex Tweezer Pro Indicator Tweezer Pro Indicator is a pattern recognition indicator for Forex, Stocks, Indices, Futures, Commodities and Cryptos. The standard Tweezer is a two bar pattern. Our enhanced version is a multi-bar pattern. We filter the patterns for you so that you only get the     best and most effective patterns   and ignore the noise. The Tweezer pattern is a simple and effective pattern to trade. The strategy that comes with the Tweezer is based on price action. The Twe
Fx Levels Premium Indicator Support and Resistance are important concepts in trading. Fx Levels Premium was created to easily draw important levels of support and resistance for the active trader. The indicator will give you all important levels (support/resistance) to watch for a wide range of assets. Trading without these levels on your chart is like driving a car for a long journey without a roadmap. You would be confused and blind. Support and resistance levels should be used as guideline
ARICoin is a powerful trading companion designed to generate high-probability entry signals with dynamic TP/SL/DP levels based on volatility. Built-in performance tracking shows win/loss stats, PP1/PP2 hits, and success rates all updated live. Key Features: Buy/Sell signals with adaptive volatility bands Real-time TP/SL/DP levels based on ATR Built-in MA Filter with optional ATR/StdDev volatility Performance stats panel (Success, Profit/Loss, PP1/PP2) Alerts via popup, sound, push, or email Cust
Crystal Heikin Ashi Signals—Professional Trend & Signal Detection Indicator Advanced Heikin Ashi Visualization with Intelligent Signal System for Manual & Automated Trading Final Price: $149 ---------> Price goes up $10 after every 10 sales . Limited slots available — act fast . Overview User Guide PDF Crystal Heikin Ashi Signals is a professional-grade MetaTrader 5 indicator that combines pure Heikin Ashi candle visualization with an advanced momentum-shift detection system. Designed for both m
FX Trend NG:次世代マルチマーケット・トレンドインテリジェンス 概要 FX Trend NG は、複数の時間足に対応したプロフェッショナル向けトレンド分析およびマーケット監視ツールです。 市場全体の構造を数秒で把握することができます。 複数のチャートを切り替える必要はありません。どの銘柄がトレンド中なのか、どこでモメンタムが弱まっているのか、そしてどの時間足で強い整合性があるのかを瞬時に確認できます。 ローンチ特別オファー – FX Trend NG を $30(6ヶ月) または $80 永久ライセンス でご利用いただけます。 すでに Stein Investments のユーザーですか? -> メッセージを送信 して、プライベートグループへアクセスしてください。 セットアップや詳細情報が必要ですか? -> Stein Investments 公式ページ をご覧ください。 1. FX Trend NG が他と異なる理由 3ステート・トレンドロジック ― Buy と Sell だけではない • 多くのインジケーターは Buy または Sell の2状態のみを表示します。
スイングトレーディング は、トレンドの方向のスイングと可能な反転スイングを検出するように設計された最初のインジケーターです。トレーディングの文献で広く説明されているベースラインスイングトレーディングアプローチを使用します。インディケータは、いくつかの価格と時間のベクトルを調査して、全体的なトレンドの方向を追跡し、市場が売られ過ぎまたは買われ過ぎて修正の準備ができている状況を検出します。 [ インストールガイド | 更新ガイド | トラブルシューティング | よくある質問 | すべての製品 ] むち打ちを起こさずに市場スイングの利益 インジケーターは常にトレンドの方向を表示します 色付きの価格帯は機会のベースラインを表します 色付きのダッシュは、可能な反転スイングを表します この指標は、独自の品質とパフォーマンスを分析します 複数時間枠のダッシュボードを実装します カスタマイズ可能なトレンドおよびスイング期間 電子メール/サウンド/プッシュアラートを実装します インジケータは再描画またはバックペインティングではありません Swing Tradingとは Swing Tradingは
FX Volume MT5
Daniel Stein
4.79 (24)
FX Volume:ブローカー視点で捉える本物の市場センチメント クイック概要 トレード手法をさらに高めたいとお考えですか? FX Volume は、リテールトレーダーやブローカーのポジション状況をリアルタイムで提供します。これは、COTのような遅延レポートよりもはるかに早く知ることができます。安定した利益を目指す方も、さらなる優位性を求める方も、 FX Volume は大きな不均衡を見極め、ブレイクアウトを確認し、リスク管理を洗練させるのに役立ちます。今すぐ始めて、実際の出来高データがどのように意思決定を変革するかを体感してください! 1. FX Volume がトレーダーにとって非常に有益な理由 高精度の早期警戒シグナル • 各通貨ペアを売買しているトレーダー数を、他者よりも早く、ほぼリアルタイムで把握できます。 • FX Volume は、複数のリテールブローカーから得られる本物の出来高データを収集し、分かりやすい形式で提供する 唯一 のツールです。 強力なリスク管理 • ロングやショートの大きな偏り(インバランス)を特定し、潜在的なトレンド転換を見逃しません。ストップ
作者のその他のプロダクト
「GA Moving Average」(「GA 移動平均線」)は、移動平均線クロスオーバー戦略を用いたエキスパートアドバイザー(EA)であり、完璧なトレード戦略を実現するための多くの設定が可能です。 「GA Moving Average」の中心コンセプトは、移動平均線インジケーターを利用して潜在的なトレード機会を特定することです。異なる移動平均線の相互作用を分析することで、このEAは市場での買いシグナルと売りシグナルを生成することを目指しています。 主な特徴とカスタマイズオプション: 1. 移動平均線のパラメーター:トレーダーは、短期と長期の移動平均線の特定の期間を設定できます。これにより、トレーディングスタイルや好みに合わせて柔軟に適応することができます。さまざまな市場条件や時間枠に対応することが可能です。 2. クロスシグナルの生成:EAは、短期移動平均線が長期移動平均線を上回ると買いシグナルが生成され、短期移動平均線が長期移動平均線を下回ると売りシグナルが生成されるよう監視します。これにより、潜在的な買いチャンスや売りチャンスを示します。 3. リスク管理:EAにはリス
FREE
Stochastic Oscillator EA is a flexible MT5 Expert Advisor built around the classic Stochastic Oscillator concept, designed for traders who want control, clarity, and customization. Stochastic is one of the most widely used tools in technical analysis because it measures momentum by comparing the close to the recent price range, highlighting overbought/oversold conditions and potential reversals in a simple, testable way. It adapts well across different markets and timeframes (Forex, Metals, Indi
GA Moving Average
Osama Echchakery
4.33 (3)
「GA Moving Average」(「GA 移動平均線」)は、移動平均線クロスオーバー戦略を用いたエキスパートアドバイザー(EA)であり、完璧なトレード戦略を実現するための多くの設定が可能です。 「GA Moving Average」の中心コンセプトは、移動平均線インジケーターを利用して潜在的なトレード機会を特定することです。異なる移動平均線の相互作用を分析することで、このEAは市場での買いシグナルと売りシグナルを生成することを目指しています。 主な特徴とカスタマイズオプション: 1. 移動平均線のパラメーター:トレーダーは、短期と長期の移動平均線の特定の期間を設定できます。これにより、トレーディングスタイルや好みに合わせて柔軟に適応することができます。さまざまな市場条件や時間枠に対応することが可能です。 2. クロスシグナルの生成:EAは、短期移動平均線が長期移動平均線を上回ると買いシグナルが生成され、短期移動平均線が長期移動平均線を下回ると売りシグナルが生成されるよう監視します。これにより、潜在的な買いチャンスや売りチャンスを示します。 3. リスク管理:EAにはリス
FREE
RSI   EA is a   fully automated   Forex trading strategy based on the MACD indicator, one of the most popular and widely used trend-following methods in technical analysis. This expert advisor automatically opens and manages buy and sell trades using RSI to capture market momentum while removing emotional decision-making. Premium advanced   version with   +40 filter!   :   Click Here Or search "RSI ProLab mt5" on the market
FREE
Double Moving Average EA is a fully automated Forex trading strategy based on the double moving average crossover, one of the most popular and widely used trend-following methods in technical analysis. This expert advisor automatically opens and manages buy and sell trades using fast and slow moving averages to capture market momentum while removing emotional decision-making. Premium advanced   version with   +40 filter!   :   Click Here Or search "MA crossover ProLab mt5" on the market
FREE
GA Paraboli SAR
Osama Echchakery
4 (3)
「GA Moving Average」(「GA 移動平均線」)は、移動平均線クロスオーバー戦略を用いたエキスパートアドバイザー(EA)であり、完璧なトレード戦略を実現するための多くの設定が可能です。 「GA Moving Average」の中心コンセプトは、移動平均線インジケーターを利用して潜在的なトレード機会を特定することです。異なる移動平均線の相互作用を分析することで、このEAは市場での買いシグナルと売りシグナルを生成することを目指しています。 主な特徴とカスタマイズオプション: 1. 移動平均線のパラメーター:トレーダーは、短期と長期の移動平均線の特定の期間を設定できます。これにより、トレーディングスタイルや好みに合わせて柔軟に適応することができます。さまざまな市場条件や時間枠に対応することが可能です。 2. クロスシグナルの生成:EAは、短期移動平均線が長期移動平均線を上回ると買いシグナルが生成され、短期移動平均線が長期移動平均線を下回ると売りシグナルが生成されるよう監視します。これにより、潜在的な買いチャンスや売りチャンスを示します。 3. リスク管理:EAにはリス
FREE
MACD   EA is a   fully automated   Forex trading strategy based on the MACD indicator, one of the most popular and widely used trend-following methods in technical analysis. This expert advisor automatically opens and manages buy and sell trades using MACD crossover to capture market momentum while removing emotional decision-making. Premium advanced   version with   +40 filter!   :   Click Here Or search "MACD ProLab mt5" on the market
FREE
GA RSI Project
Osama Echchakery
3.5 (4)
「GA Moving Average」(「GA 移動平均線」)は、移動平均線クロスオーバー戦略を用いたエキスパートアドバイザー(EA)であり、完璧なトレード戦略を実現するための多くの設定が可能です。 「GA Moving Average」の中心コンセプトは、移動平均線インジケーターを利用して潜在的なトレード機会を特定することです。異なる移動平均線の相互作用を分析することで、このEAは市場での買いシグナルと売りシグナルを生成することを目指しています。 主な特徴とカスタマイズオプション: 1. 移動平均線のパラメーター:トレーダーは、短期と長期の移動平均線の特定の期間を設定できます。これにより、トレーディングスタイルや好みに合わせて柔軟に適応することができます。さまざまな市場条件や時間枠に対応することが可能です。 2. クロスシグナルの生成:EAは、短期移動平均線が長期移動平均線を上回ると買いシグナルが生成され、短期移動平均線が長期移動平均線を下回ると売りシグナルが生成されるよう監視します。これにより、潜在的な買いチャンスや売りチャンスを示します。 3. リスク管理:EAにはリス
FREE
「GA Moving Average」(「GA 移動平均線」)は、移動平均線クロスオーバー戦略を用いたエキスパートアドバイザー(EA)であり、完璧なトレード戦略を実現するための多くの設定が可能です。 「GA Moving Average」の中心コンセプトは、移動平均線インジケーターを利用して潜在的なトレード機会を特定することです。異なる移動平均線の相互作用を分析することで、このEAは市場での買いシグナルと売りシグナルを生成することを目指しています。 主な特徴とカスタマイズオプション: 1. 移動平均線のパラメーター:トレーダーは、短期と長期の移動平均線の特定の期間を設定できます。これにより、トレーディングスタイルや好みに合わせて柔軟に適応することができます。さまざまな市場条件や時間枠に対応することが可能です。 2. クロスシグナルの生成:EAは、短期移動平均線が長期移動平均線を上回ると買いシグナルが生成され、短期移動平均線が長期移動平均線を下回ると売りシグナルが生成されるよう監視します。これにより、潜在的な買いチャンスや売りチャンスを示します。 3. リスク管理:EAにはリス
FREE
GA MAcD
Osama Echchakery
「GA Moving Average」(「GA 移動平均線」)は、移動平均線クロスオーバー戦略を用いたエキスパートアドバイザー(EA)であり、完璧なトレード戦略を実現するための多くの設定が可能です。 「GA Moving Average」の中心コンセプトは、移動平均線インジケーターを利用して潜在的なトレード機会を特定することです。異なる移動平均線の相互作用を分析することで、このEAは市場での買いシグナルと売りシグナルを生成することを目指しています。 主な特徴とカスタマイズオプション: 1. 移動平均線のパラメーター:トレーダーは、短期と長期の移動平均線の特定の期間を設定できます。これにより、トレーディングスタイルや好みに合わせて柔軟に適応することができます。さまざまな市場条件や時間枠に対応することが可能です。 2. クロスシグナルの生成:EAは、短期移動平均線が長期移動平均線を上回ると買いシグナルが生成され、短期移動平均線が長期移動平均線を下回ると売りシグナルが生成されるよう監視します。これにより、潜在的な買いチャンスや売りチャンスを示します。 3. リスク管理:EAにはリス
FREE
「GA Moving Average」(「GA 移動平均線」)は、移動平均線クロスオーバー戦略を用いたエキスパートアドバイザー(EA)であり、完璧なトレード戦略を実現するための多くの設定が可能です。 「GA Moving Average」の中心コンセプトは、移動平均線インジケーターを利用して潜在的なトレード機会を特定することです。異なる移動平均線の相互作用を分析することで、このEAは市場での買いシグナルと売りシグナルを生成することを目指しています。 主な特徴とカスタマイズオプション: 1. 移動平均線のパラメーター:トレーダーは、短期と長期の移動平均線の特定の期間を設定できます。これにより、トレーディングスタイルや好みに合わせて柔軟に適応することができます。さまざまな市場条件や時間枠に対応することが可能です。 2. クロスシグナルの生成:EAは、短期移動平均線が長期移動平均線を上回ると買いシグナルが生成され、短期移動平均線が長期移動平均線を下回ると売りシグナルが生成されるよう監視します。これにより、潜在的な買いチャンスや売りチャンスを示します。 3. リスク管理:EAにはリス
FREE
Infi Trade:先進のオートメーションであなたのトレーディングを革新 自動トレーディングの力を解き放ちましょう: Infi Tradeは、Forex市場で効率と利益を求めるトレーダー向けに設計された最先端のエキスパートアドバイザー(EA)です。当社のEAは、取引機会を最大化するために複雑なグリッドヘッジ戦略を利用し、シームレスな自動取引体験を提供します。 インテリジェントなグリッドヘッジ戦略: Infi Tradeの核となるのは、私たちの革新的なグリッドヘッジ戦略です。このアプローチは、市場の変動を利用して様々な価格レベルでポジションのグリッドを作成し、トレードを賢く配置および管理します。EAは市場状況にダイナミックに適応し、リスクを最小限に抑えながら利益を確保することを目指します。 完全自動化でストレスフリーなトレーディング: Infi Tradeは完全に自動化されています。設定後、24時間365日市場を分析し、取引プロセスを引き継ぎます。これは、常に市場を監視する必要なく取引のメリットを楽しむことができることを意味し、他の重要な活動のための時間を解放します。 **ユーザーフレ
私の個人的なベスト 30 EA の 1 つである Last Hope EA を紹介します。トレード方法を変革する画期的な MQL4 エキスパート アドバイザーです。 5年以上の取引経験を持つ私が愛情を込めて開発しました。 重要! 推奨ペア: EURCHF、EURUSD、USDCHF、GBPCAD、EURCAD のみのプロモーション価格     50ドル !価格はすぐに 100 USD に上がり、その後 10 回購入するごとに 50 USD ずつ上がります。 この EA には説明は必要ありません。ご自身で EA をテストして結果を確認してください。 安全な 受動的収入と長期投資をポートフォリオに追加するのに良い選択です。 推奨事項: 通貨ペア: EURCHF 期間: H1 最低入金額 : $100 アカウントの種類: ECN、Raw、または低スプレッドの Razor。 重要: 最良の結果を得るには、LOW SPREAD アカウントを使用することが非常に重要です。 仕様: 貿易 EURCHF グリッド、ヘッジ、または複数のオープントレードは使用しません 最大オープントレードは1つだけ
SMC Pro is a professional Smart Money Concepts indicator designed to help traders read market structure with precision and clarity. It visualizes the core principles used by institutional trading such as Break of Structure (BOS), Change of Character (CHoCH), internal and swing structures, and key liquidity zones directly on the chart in real time. Pricing Launch Price : $33 Incremental Price Increase : The price will increase by $10 after every 10 purchases. Final Price : $69 The indicator autom
ICT Killzones & Pivots Pro is a powerful trading indicator designed to visualize the most important intraday sessions and liquidity zones used by professional traders. It automatically highlights key trading periods such as Asia, London, and New York sessions, allowing traders to clearly see when market activity and volatility are at their highest. Pricing Launch Price : $33 Incremental Price Increase : The price will increase by $10 after every 10 purchases. Final Price : $69 The indicator draw
Support Resistance Pro Toolkit is a professional support and resistance indicator built on advanced Donchian structure logic, designed to provide a clear and structured view of market behavior. It automatically detects key support and resistance zones, tracks their evolution over time, and highlights how price interacts with these levels through sweeps, breakouts, and retests. Pricing Launch Price : $33 Incremental Price Increase : The price will increase by $10 after every 10 purchases. Final P
The Tweezer Bottom candlestick pattern is formed by two candles. Here’s how to identify the Tweezer Bottom candlestick pattern: The first candle is bearish The second candle is bullish The lows from both candles should be pretty much at the same level This 2-candle bullish candlestick pattern is a reversal pattern, meaning that it’s used to find bottoms. For this reason, we want to see this pattern after a move to the downside, showing that bulls are starting to take control. When a Tweezer Bott
The Three Outside Up candlestick pattern is formed by three candles. Here’s how to identify the Three Outside Up candlestick pattern: The first candle is bearish and small The second candle is bullish and engulfs the first one completely The third candle is bullish and closes above the other ones This 3-candle bullish candlestick pattern is a reversal pattern, meaning that it’s used to find bottoms. For this reason, we want to see this pattern after a move to the downside, showing that bulls are
The Bullish Counterattack Line candlestick pattern is formed by two candles. Here’s how to identify the Bullish Counterattack candlestick pattern: The first candle is bearish and big The second candle is bullish and small There’s a gap between the close of the first candle and the open of the second candle They both close at the same level This 2-candle bullish candlestick pattern is a reversal pattern, meaning that it’s used to find bottoms. For this reason, we want to see this pattern after a
Unlock the potential of automated trading with our state-of-the-art Moving Average Crossover Expert Advisor (EA), designed to provide a seamless trading experience. This EA integrates robust filters and comprehensive settings, making it an ideal choice for traders of all experience levels. $32  (3 copy left) next price $99 Key Features and Benefits: Full Control Over Your Trading : No Martingale, Hedging, or Grid : Ensures a safe trading approach without risky strategies. Easy Installation : Ge
Discover the full potential of automated trading with RSI PROject, our cutting-edge MT5 Expert Advisor (EA). This sophisticated tool is designed to streamline your trading journey, offering a user-friendly interface combined with powerful filters and in-depth customization options. Whether you're a novice or an experienced trader, RSI PROject adapts to your needs, helping you optimize strategies and make informed decisions with confidence. $32  (3 copy left) next price $99 Key Features and Benef
Unlock the full potential of trading with the   Parabolic SAR PROject Expert Advisor (EA) , a highly customizable, automated tool built around the widely-used Parabolic SAR indicator. This EA is designed with advanced filters and flexible settings, empowering traders to manage risk effectively through customizable parameters such as lot size, stop-loss, take-profit, and session filters. With multiple trend confirmation options and versatile trailing stop methods, the Parabolic SAR PROject EA ad
Jesus
Osama Echchakery
トレーダーの皆さん、こんにちは! 私は究極の 金取引マシン 、 イエス です。私の戦略は、   XAUUSD で最適なセットアップを抽出するために、何千もの最適化されたローソク足パターンに基づいて構築され、細心の注意を払って改良されています。精度こそが私の基盤であり、私の目標はシンプルです。レーザーのように鋭い精度で金市場を支配することです。私は単なるエキスパートアドバイザーではありません。市場のノイズを遮断し、卓越した結果をもたらすために設計された、金取引における容赦ない力です。ボラティリティの高い急騰相場でも静かなトレンドでも、 イエス は比類なき自信を持って取引を実行します。一緒に金市場を制覇しましょう! 割引   価格 。       10回購入するごとに50ドルずつ値上がりします。最終価格は999ドルです。 - リアルシグナル: 5Kライブ信号:       ここをクリック イエスへの推薦 タイトル 説明 シンボル XAU/USD(ゴールド) 時間枠 どれでも 最低資本金 100ドル レバレッジから 1:20 - 1:500 アカウントの種類 どれでも ブローカ どれでも
Unlock the full potential of trading with the   ADX PROject Expert Advisor (EA) , a highly customizable, automated tool built around the widely-used ADX indicator. This EA is designed with advanced filters and flexible settings, empowering traders to manage risk effectively through customizable parameters such as lot size, stop-loss, take-profit, and session filters. With multiple trend confirmation options and versatile trailing stop methods, the ADX PROject EA adapts seamlessly to various mar
Unlock the full potential of trading with MACD PROject Expert Advisor (EA) , a highly customizable, automated tool based on the popular MACD indicator. The EA is designed with robust filters, allowing traders to manage risks through flexible settings like lot size, stop-loss, take-profit, and session filters. It offers multiple trend confirmation options and trailing stop methods, making it suitable for diverse market conditions. Price : $32 (3 copies left), Next: $99 Full Control Over Your Tra
Unlock the full potential of trading with the   Bollinger Bands Expert Advisor (EA) , a highly customizable, automated tool built around the widely-used Bollinger Bands indicator. This EA is designed with advanced filters and flexible settings, empowering traders to manage risk effectively through customizable parameters such as lot size, stop-loss, take-profit, and session filters. With multiple trend confirmation options and versatile trailing stop methods, the Bollinger Bands PROject EA adap
Maximize your trading efficiency with the Fibonacci Retracement Assistant for MetaTrader 5. This powerful tool automates the process of setting Buy Limit and Sell Limit orders as soon as you draw your Fibonacci retracement levels. Designed for traders seeking precision and speed, it eliminates the manual effort of order placement, letting you focus on market analysis. Key Features: Automatic Order Placement : Instantly set Buy Limit and Sell Limit orders when you drag Fibonacci retracement leve
Unlock the power of automated trading with the Fully Automated Fibonacci Retracement EA for MetaTrader 5. This Expert Advisor dynamically identifies Fibonacci retracement levels and places trades based on candle formations—completely hands-free. Designed to simplify your trading process, it ensures accurate and timely execution without the need for constant monitoring. Key Features: Automated Trade Execution : The EA automatically analyzes Fibonacci retracement levels and enters trades based on
Hello, traders!  I am  Jesus , the ultimate  GBP  trading machine . My strategy is built on thousands of optimized candle patterns, meticulously refined to extract the best setups on  GBPUSD . Precision is my foundation, and my goal is simple: to dominate the GBPUSD market with laser-sharp accuracy. I’m not just an Expert Advisor—I’m a relentless force in GPBUSD trading, designed to cut through market noise and deliver exceptional results. Whether it’s volatile spikes or quiet trends,  Jesus  i
Unlock the full potential of trading with the   Stochastic Oscillator PROject Expert Advisor (EA) , a highly customizable, automated tool built around the widely-used Stochastic Oscillator indicator. This EA is designed with advanced filters and flexible settings, empowering traders to manage risk effectively through customizable parameters such as lot size, stop-loss, take-profit, and session filters. With multiple trend confirmation options and versatile trailing stop methods, the Stochastic
フィルタ:
レビューなし
レビューに返信