SMC Structure Analytics
- 指标
- 版本: 1.10
- 激活: 20

SMC Structure Analytics
Professional Smart Money Concepts Market Structure Indicator for MetaTrader 5
SMC Structure Analytics is a professional chart analysis indicator designed to simplify Smart Money Concepts analysis on MetaTrader 5.
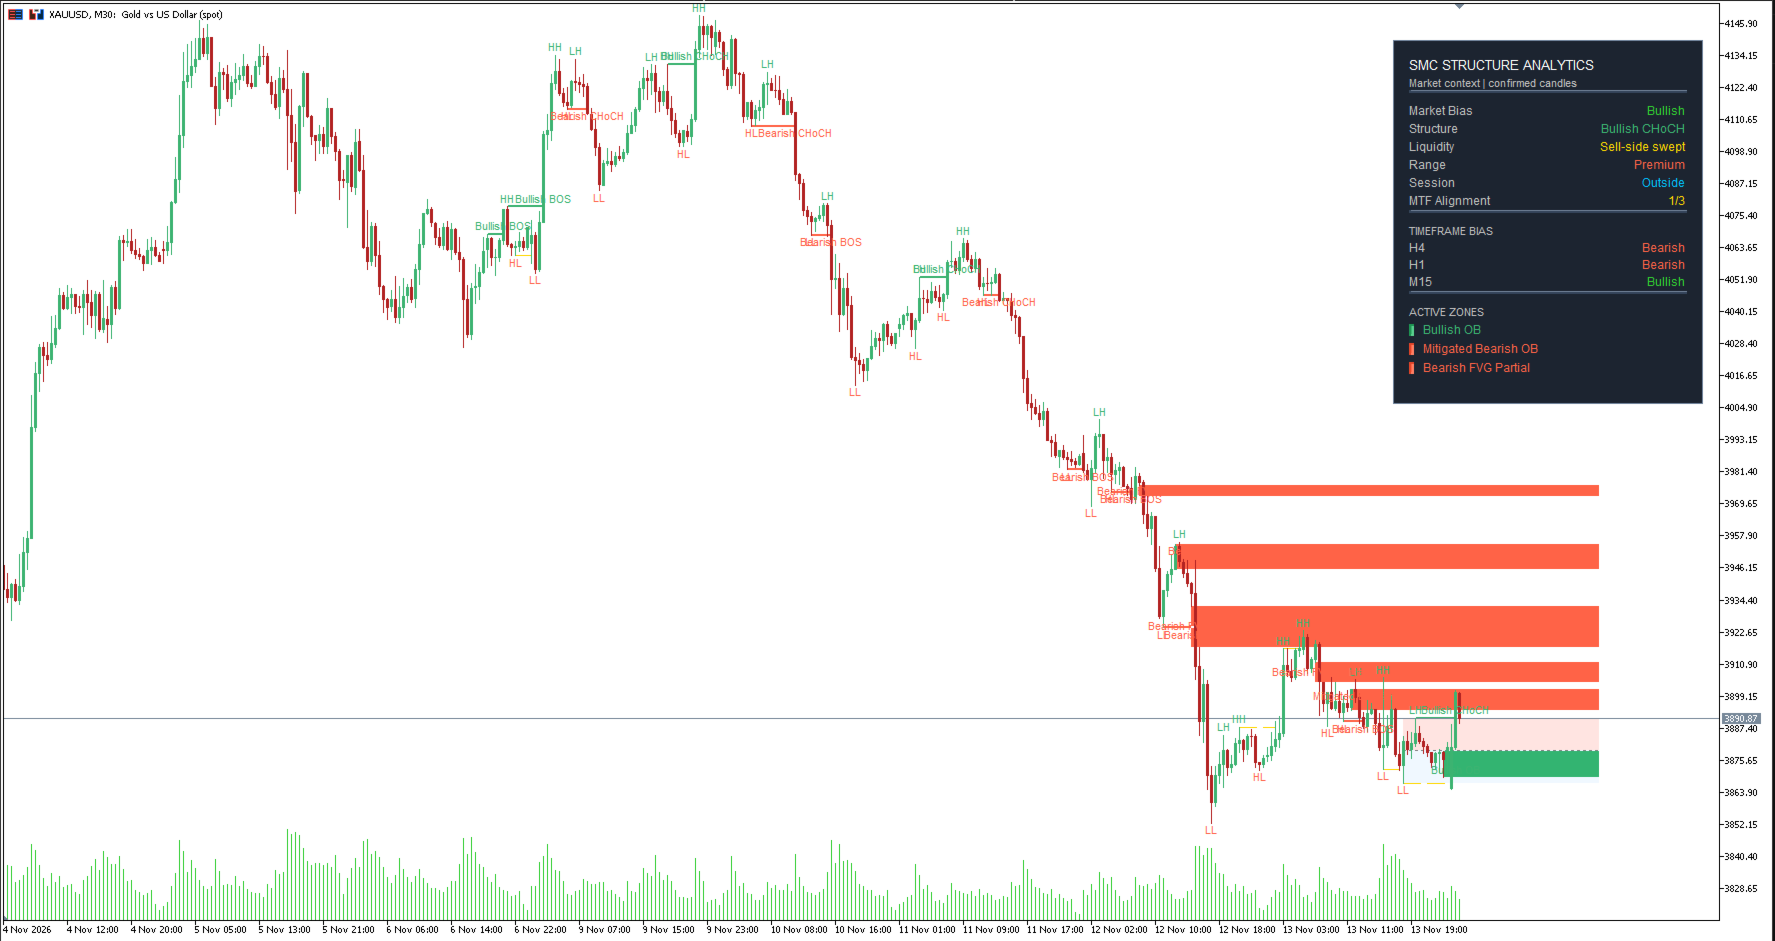
The indicator combines market structure, BOS, CHoCH, Order Blocks, Fair Value Gaps, liquidity levels, liquidity sweeps, Premium and Discount zones, session levels, and multi-timeframe bias into one clean and organized interface.
It is designed for traders who want a clearer view of price structure without filling the chart with unnecessary objects and overlapping signals.
SMC Structure Analytics is an analysis tool. It does not place trades automatically, does not manage positions, and does not guarantee trading results.
Main Features
Market Structure Analysis
The indicator identifies and displays the main market structure points:
- Higher High
- Higher Low
- Lower High
- Lower Low
- Bullish Market Structure
- Bearish Market Structure
- Major Structure
- Optional Internal Structure
Market structure is calculated using confirmed swing points. A swing point is displayed only after the required number of confirmation candles has passed.
This confirmation process helps reduce unstable signals and prevents the indicator from relying on future candles for confirmed historical structure.
Break of Structure
The indicator detects bullish and bearish Break of Structure events.
Supported signals include:
- Bullish BOS
- Bearish BOS
- Structure continuation
- Break confirmation based on candle close
BOS events can be displayed directly on the chart and can also trigger optional alerts.
Change of Character
The indicator detects potential changes in market direction through Change of Character events.
Supported signals include:
- Bullish CHoCH
- Bearish CHoCH
- Possible transition from bearish to bullish structure
- Possible transition from bullish to bearish structure
CHoCH signals are displayed only when the defined structure rules are confirmed.
Order Blocks
SMC Structure Analytics identifies potential bullish and bearish Order Blocks based on the candle structure before a confirmed market structure break.
The indicator supports:
- Bullish Order Blocks
- Bearish Order Blocks
- Fresh Order Blocks
- Mitigated Order Blocks
- Invalidated Order Blocks
- Automatic removal of invalidated zones
- Configurable Order Block lookback
- Configurable maximum active zones
- Configurable right-side zone extension
An Order Block can be removed automatically after price invalidates the zone according to the selected rules.
Order Blocks are intended to be used as areas of interest and should be combined with market structure, liquidity, and risk management.
Fair Value Gaps
The indicator detects bullish and bearish Fair Value Gaps using a three-candle price imbalance structure.
Each Fair Value Gap can be classified as:
- Fresh
- Partially Filled
- Filled
Users can choose whether filled Fair Value Gaps remain visible on the chart.
Supported controls include:
- Enable or disable Fair Value Gaps
- Minimum Fair Value Gap size
- Show or hide filled gaps
- Maximum active Fair Value Gaps
- Right-side extension
- Optional creation and fill alerts
Liquidity Analysis
The indicator identifies several types of liquidity areas:
- Equal Highs
- Equal Lows
- Buy-side Liquidity
- Sell-side Liquidity
- Previous Day High
- Previous Day Low
- London Session High and Low
- New York Session High and Low
Liquidity levels are shown as clean horizontal levels and can be used to identify possible liquidity targets and reaction areas.
Liquidity Sweeps
The indicator detects potential liquidity sweeps when price takes liquidity beyond a previous high or low and closes back through the level.
Supported events include:
- Buy-side Liquidity Sweep
- Sell-side Liquidity Sweep
- Optional sweep labels
- Optional sweep alerts
- Visual liquidity sweep lines
Sweep labels are disabled by default to keep the chart clean, but they can be enabled from the indicator settings.
Premium and Discount Zones
The indicator automatically calculates the latest confirmed market range and divides it into:
- Premium Zone
- Equilibrium
- Discount Zone
Premium and Discount zones provide additional context for evaluating whether price is trading in the upper or lower half of the latest structure range.
Users can show or hide Premium and Discount labels while keeping the zones visible.
Multi-Timeframe Dashboard
The built-in dashboard provides a compact overview of the current market context.
The dashboard can display:
- Current Market Bias
- Current Structure
- Liquidity Status
- Premium or Discount Status
- Current Session
- Multi-Timeframe Alignment
- Active Order Block count
- Active Fair Value Gap count
- Higher timeframe bias
- Entry timeframe bias
The default dashboard timeframes are:
- H4
- H1
- M15
These timeframes can be changed according to the trader's strategy.
The dashboard is designed to remain compact and readable without covering a large portion of the chart.
Chart Appearance
The indicator includes optional chart appearance controls:
- Hide the chart grid
- Use standard candlestick mode
- Apply custom bullish candle color
- Apply custom bearish candle color
- Enable chart AutoScroll
- Enable Chart Shift
- Configure Chart Shift size
Chart appearance settings are applied once when the indicator is loaded.
The indicator stores the original chart settings and restores them when the indicator is removed, provided the user has not manually changed those settings while the indicator was active.
Alerts
Alerts are optional and disabled by default.
The indicator can alert the trader when:
- Bullish BOS is detected
- Bearish BOS is detected
- Bullish CHoCH is detected
- Bearish CHoCH is detected
- Buy-side liquidity is swept
- Sell-side liquidity is swept
- A new Order Block is created
- Price enters an Order Block
- A Fair Value Gap is created
- A Fair Value Gap is filled
Available alert methods include:
- MetaTrader alert window
- Push notifications
- Email notifications
- Optional sound notification through the terminal alert system
Alerts are deduplicated by event and candle time to reduce repeated notifications.
Confirmed Candle Analysis
The indicator is designed around confirmed candle analysis.
Confirmed events are based on closed candles and confirmed swing points. This means some signals may appear after a natural confirmation delay.
This delay is intentional. It helps avoid using future information for confirmed historical signals.
The indicator does not promise that every displayed event will remain relevant to future price movement. Market structure can change, zones can fail, and liquidity can be taken without producing a reversal.
Clean Chart Design
The indicator includes visual limits to prevent excessive chart clutter.
Default visual controls include:
- Analysis history limited to a defined number of bars
- Visual history limited to recent bars
- Internal structure disabled by default
- Sweep labels disabled by default
- Maximum active zones limited
- Filled Fair Value Gaps hidden by default
- Session and Previous Day labels hidden by default
- Compact Dashboard layout
- Separate colors for bullish, bearish, liquidity, and contextual zones
These defaults are designed to give traders a clean starting layout while still allowing deeper customization.
Recommended Workflow
A possible workflow is:
- Start with the higher timeframe structure.
- Check the Dashboard market bias.
- Review the H4 and H1 structure.
- Identify the latest BOS or CHoCH.
- Check whether liquidity has been swept.
- Locate fresh Order Blocks or Fair Value Gaps.
- Check whether price is in Premium, Equilibrium, or Discount.
- Use a lower timeframe for additional confirmation.
- Apply independent risk management before entering any trade.
The indicator should be used as a market structure and context tool, not as an automatic entry system.
Recommended Default Settings
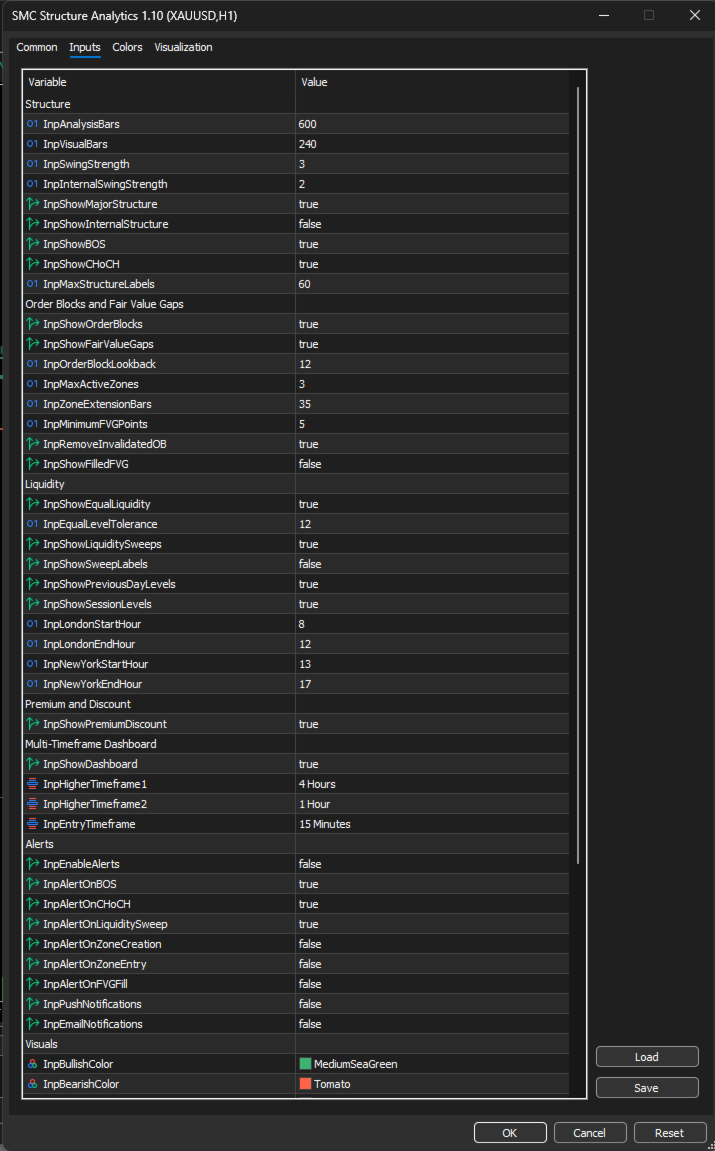
Recommended starting settings:
- Analysis Bars: 600
- Visual Bars: 240
- Swing Strength: 3
- Internal Swing Strength: 2
- Show Major Structure: Enabled
- Show Internal Structure: Disabled
- Show BOS: Enabled
- Show CHoCH: Enabled
- Maximum Active Zones: 3
- Order Block Lookback: 12
- Zone Extension Bars: 35
- Show Sweep Labels: Disabled
- Show Level Labels: Disabled
- Show Filled FVG: Disabled
- Dashboard: Enabled
- Chart Style: Enabled
These settings are only starting points. Different symbols and timeframes may require different values.
Supported Markets
The indicator is designed to work on a wide range of MetaTrader 5 symbols, including:
- Forex
- Gold
- Silver
- Indices
- Commodities
- Cryptocurrencies
- CFDs
- Other broker-supported instruments
Session calculations use broker server time. Traders should adjust the London and New York session inputs according to their broker's server timezone.
Supported Timeframes
The indicator can be used on all standard MetaTrader 5 timeframes.
It can be used for:
- Scalping
- Intraday analysis
- Swing trading
- Higher timeframe analysis
- Multi-timeframe confirmation
The quality and frequency of signals depend on the selected symbol, timeframe, market volatility, and available historical data.
Performance
The indicator is designed to limit unnecessary chart objects and calculations.
Performance controls include:
- Limited analysis history
- Limited visual history
- Limited active zones
- Optional internal structure
- Optional labels
- No external DLLs
- No WebRequest calls
- No automatic trading functions
- No external files required for normal operation
The indicator recalculates on new chart bars and uses confirmed candle logic for its main analysis.
Input Validation
The indicator validates important settings before loading.
Invalid settings such as incorrect swing strengths, invalid session hours, negative thresholds, or invalid chart shift values are rejected during initialization.
This helps prevent unexpected behavior caused by incorrect user parameters.
Important Limitations
Smart Money Concepts are not globally standardized. Different traders may define BOS, CHoCH, Order Blocks, Liquidity, and Fair Value Gaps differently.
This indicator uses deterministic internal rules to produce consistent results, but its definitions may differ from another trader's methodology.
Swing points require confirmation. Therefore, a swing high or swing low may appear later than the actual turning point.
A valid structure break does not guarantee continuation.
An Order Block does not guarantee a reaction.
A Fair Value Gap does not guarantee that price will fill or respect the zone.
A liquidity sweep does not guarantee a reversal.
The indicator does not provide financial advice and does not guarantee profits.
No Automatic Trading
SMC Structure Analytics does not:
- Open trades
- Close trades
- Modify orders
- Set stop loss
- Set take profit
- Manage account risk
- Use martingale
- Use recovery systems
- Send orders to the broker
All trading decisions remain under the user's control.
Risk Disclaimer
Trading financial markets involves substantial risk. Past market behavior does not guarantee future results.
This indicator is provided for technical analysis and educational purposes only. Always perform your own analysis, use appropriate risk management, and test the indicator on a demo account before using it in live trading.