Fx Gamma Profile

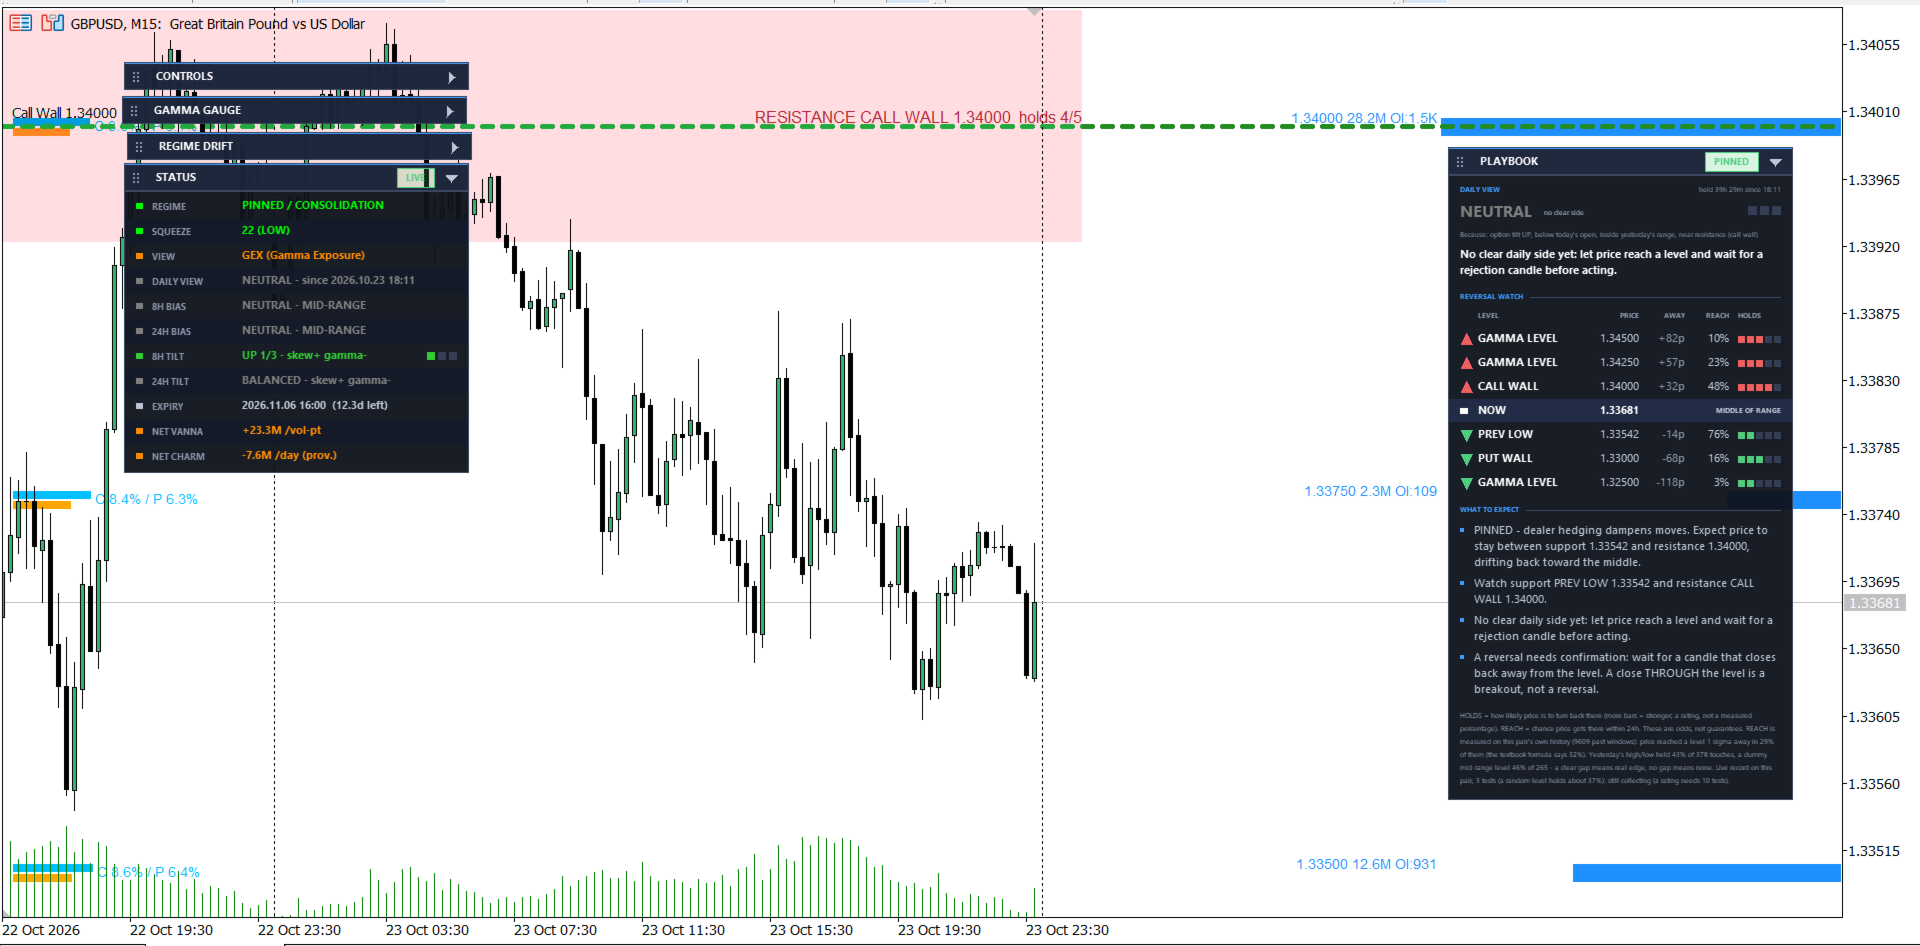
Fx Gamma Profile - see where the options market is positioned, directly on your MetaTrader 5 chart.

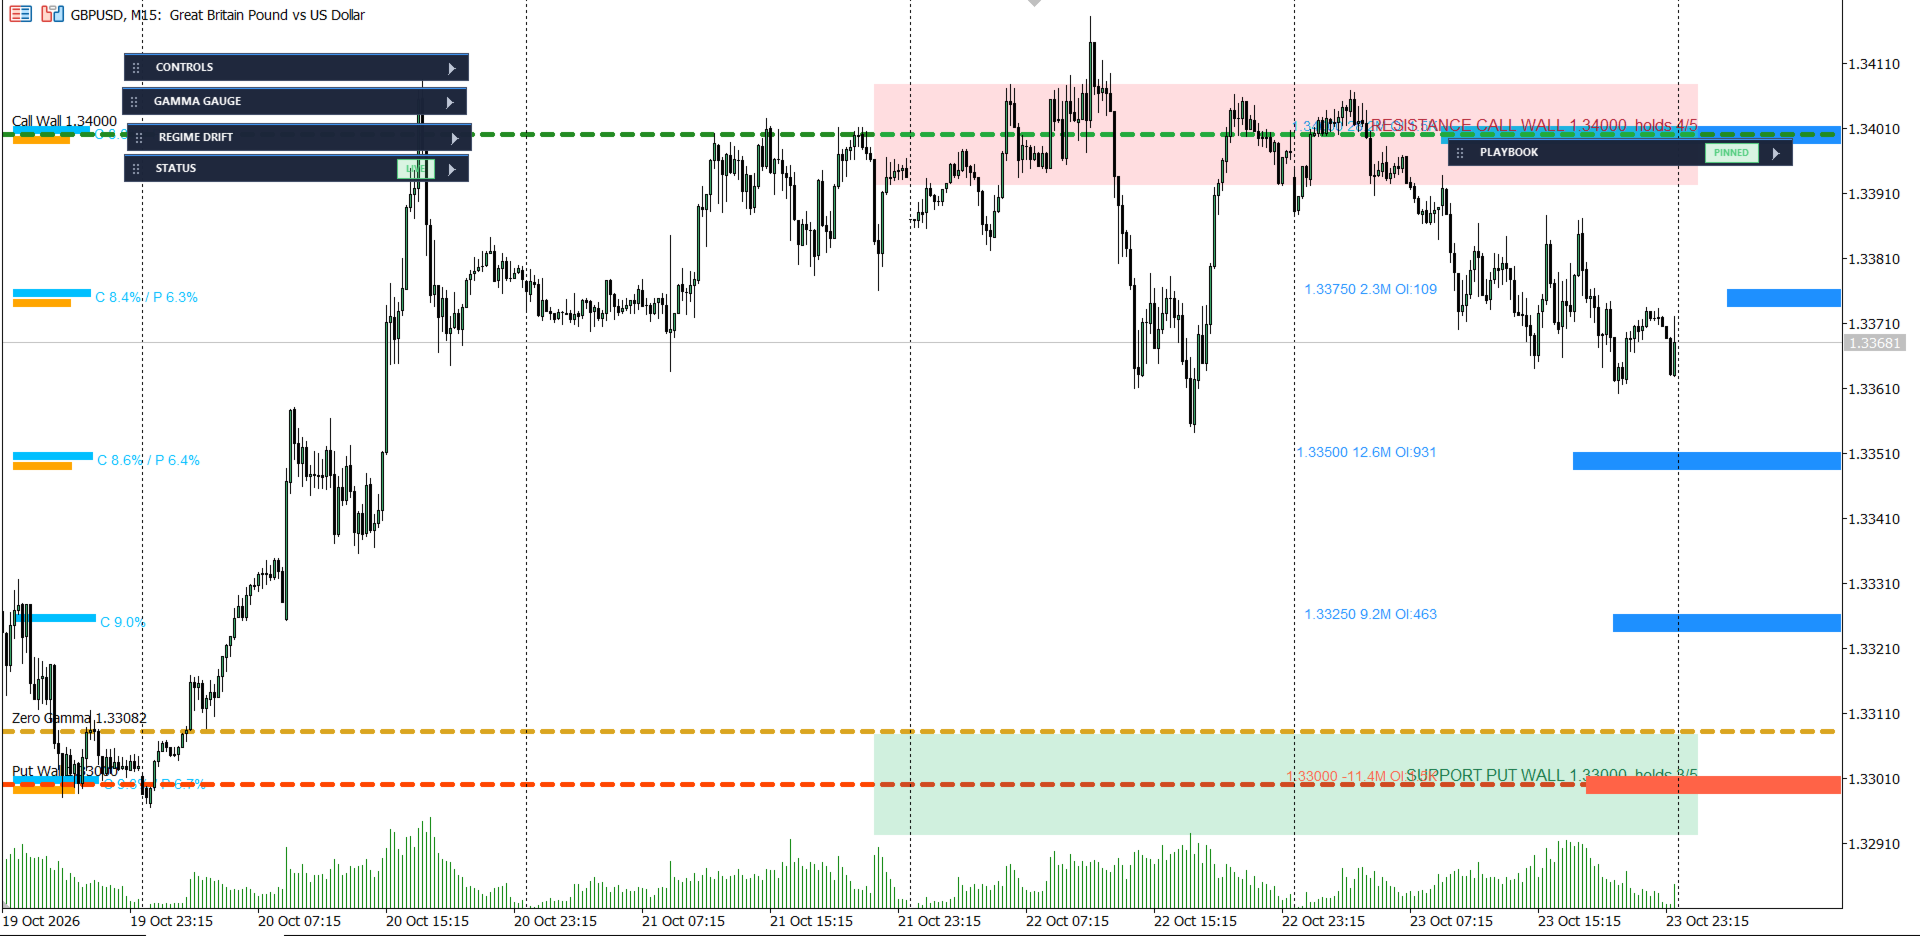
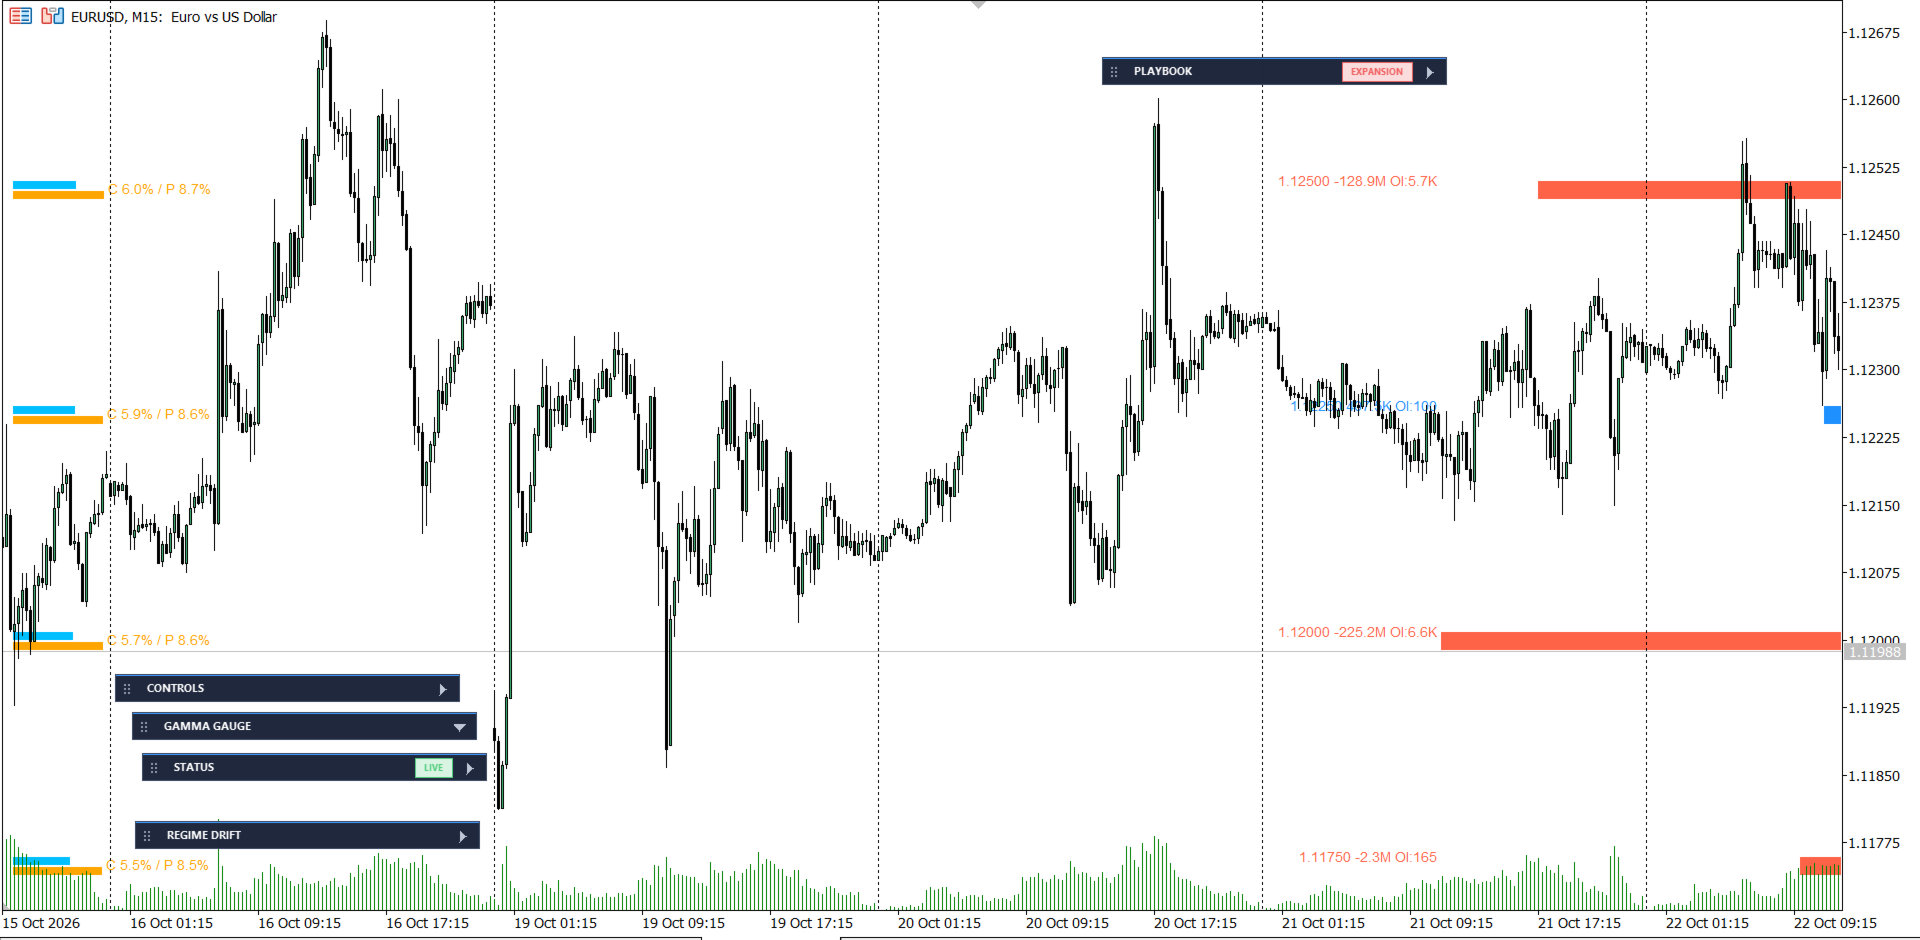
Fx Gamma Profile turns an options-chain file into a gamma-exposure (GEX) map and draws it beside price: a bar for every strike, the call wall, the put wall and the zero-gamma level, plus a status panel that explains in plain words what the numbers imply. It is a decision-support tool for discretionary traders who want options-market context for FX pairs.

⚠ READ BEFORE YOU BUY - THIS INDICATOR NEEDS A DATA FILE

  • The indicator reads an options-chain CSV in Barchart format (for example the EURUSD or GBPUSD options chain) that you download and save into your terminal's MQL5\Files folder.
  • Name the file SYMBOL_options.csv, for example GBPUSD_options.csv. Broker suffixes such as GBPUSD.m are handled.
  • The indicator does not download data and uses no internet access, no DLLs and no WebRequest. The data source and its terms of use are your responsibility.
  • Options data is a daily snapshot, so levels are fixed for the day while the reading against live price updates continuously. Replace the CSV regularly to keep the chain fresh.

BUILT-IN DEMO MODE - TRY IT BEFORE YOU ADD YOUR OWN DATA

  • If no CSV file is found, the indicator shows a clearly labelled DEMO chain so you can see every panel working immediately after you attach it.
  • The demo is sample data only. It is not real market data and has no connection to current options positioning. It is marked on the chart with a "DEMO - NOT REAL" banner, a DATA row in the status panel, a DEMO health flag and a "DEMO DATA - sample numbers, not real" prefix in the Playbook.
  • Demo numbers are never saved, never counted in the statistics and never mixed with real data.
  • As soon as your real CSV appears in the Files folder, the indicator switches to it automatically (within about 10 seconds) and the demo disappears. You can also press the on-chart Reload button.
  • Never trade on demo numbers. You can switch the demo off at any time with the input DEMO WHEN NO CSV.
  • The demo is built for pairs quoted in the usual way (for example EURUSD, GBPUSD, AUDUSD). It is not supported on inverted-quote pairs.

WHAT YOU GET

  • Gamma profile bars - net gamma exposure for every strike, with extra view modes: DEX, IV skew and Volume vs Open Interest.
  • Call wall, put wall and zero-gamma level - plus a short trail showing how the walls have moved during the session.
  • REGIME read-out - positive or negative gamma and how strong it is. A weak regime is labelled as weak and a hysteresis filter stops the label flipping on noise.
  • Dollar-gamma gauge, expected-move cones and a vanna / charm panel.
  • Playbook panel - a slow, stable Daily View, a Reversal Watch listing the levels to watch with distance and historical hold-rate (compared against a dummy level), and a What To Expect summary.
  • 8H and 24H bias engine and a Monte Carlo odds card.
  • Data-health display - file age, expiry (flagged ASSUMED when the indicator had to guess it) and number of strikes, so you always know how much to trust what you see.
  • Clean panel mode - draggable, collapsible cards that work on white and dark chart backgrounds.
  • Six indicator buffers for your own EA through iCustom: call wall, put wall, zero-gamma, net GEX, 8H bias and daily bias.
  • Light on resources - cached and throttled drawing: only changed objects are rewritten, off-screen strikes are removed, and chart redraws are combined so the chart stays smooth.

HOW IT WORKS

Implied volatility is solved from the chain's prices, gamma is calculated with the Black-76 model, and net GEX is call gamma minus put gamma. This follows the common simplification that dealers are long calls and short puts. That assumption cannot be verified for FX (there is no public dealer-positioning data), so treat the sign of net gamma as a model output, not a fact. When net gamma is small compared with gross gamma, or price is near the zero-gamma level, the sign can change with small input changes - the indicator labels these cases rather than hiding them.

HOW TO DOWNLOAD THE CORRECT FILE FROM BARCHART (step by step)

  1. Open the Barchart futures-options page for your currency future. Example for British Pound (GBPUSD): https://www.barchart.com/futures/quotes/B6Z26/options/nov-26
    Barchart's futures codes: B6 = British Pound (GBPUSD), E6 = Euro (EURUSD), A6 = Australian Dollar (AUDUSD). The ending is the futures month and year (Z26 = December 2026). Search the symbol box on Barchart if you need another pair or month.
  2. Click Options Prices in the left menu (under OPTIONS).
  3. Set the selectors above the table exactly like this:
    • Options Type: Monthly Options
    • Expiration: the expiry you want to trade around (normally the nearest monthly, for example Nov 2026). The page shows "xx Days to expiration on mm/dd/yy" - note that date.
    • Strikes: Show All (not just near-the-money strikes)
    • View: Stacked (calls and puts together in one table, so the file has one row per option with a Call/Put Type column)
  4. Click download at the top right of the table. Barchart usually requires a free account and being logged in to download.
  5. Rename the file to SYMBOL_options.csv - for example GBPUSD_options.csv - and copy it to File > Open Data Folder > MQL5 > Files. Do not edit the contents; the last line starting with "Downloaded from Barchart.com" is normal and is used to show the data age.
  6. Within about 10 seconds the DEMO banner disappears and your real chain loads. Check the EXPIRY row in the status panel matches the expiry date you chose; if it says ASSUMED, set EXPIRY MODE to Manual and enter that date.

Tips for good data: download after the market has closed or at least once per day, and replace the file every day (AUTO RELOAD DAILY picks up the new file). Use one expiry per file. The Bid and Ask columns can show N/A in the evening - the indicator then uses the settlement / last price, which is why the data age is shown in the panel. Use the unmodified Barchart download (columns Strike, Open, High, Low, Latest, Change, Bid, Ask, Volume, Open Int, Premium, Time, Type). If you use another data source, convert it to this same layout first.

Barchart is a third-party website that is not affiliated with this product. Its data is subject to Barchart's own terms of use; you are responsible for having the right to download and use it.

GETTING STARTED IN 3 STEPS

  1. Attach the indicator to a chart. You will see the demo chain straight away.
  2. Download your options-chain CSV from Barchart (see the step-by-step section above) and save it as SYMBOL_options.csv in File > Open Data Folder > MQL5 > Files. The demo switches to your data by itself.
  3. Check the EXPIRY row in the status panel. If it says ASSUMED, set EXPIRY MODE to Manual and enter your chain's expiry date.

MAIN INPUTS

  • CSV FILE NAME TEMPLATE / OVERRIDE - which file to read ({SYMBOL} is replaced automatically).
  • USE COMMON FOLDER - read the CSV from the shared Common\Files folder (needed for the Strategy Tester).
  • DEMO WHEN NO CSV - show the labelled sample chain while no CSV is present.
  • EXPIRY MODE / EXPIRY DATE / EXPIRY CUTOFF - Auto (CSV, file name, your date, else the next CME monthly, flagged ASSUMED) or Manual.
  • SHOW PLAYBOOK, view mode, panel corner and colours - every input has a capitalised feature name so it is easy to find.
  • AUTO RELOAD DAILY - reload the CSV at the start of each new day.
  • UI DIAGNOSTICS - writes redraw and repaint rates to the Experts log for troubleshooting.

STRATEGY TESTER NOTE

The Strategy Tester uses its own private Files folder, so a CSV in your normal MQL5\Files folder is not visible there. Enable USE COMMON FOLDER and place the CSV in Terminal\Common\Files to test with real data. Without a file the tester shows the labelled demo chain. This is a levels-and-context indicator - the chain is a single current snapshot, so it does not reconstruct historical gamma for backtesting.

FREQUENTLY ASKED QUESTIONS

Does it work without a CSV? It shows the labelled demo so you can explore the panels, but it needs your own CSV for real levels.
Does it connect to the internet? No. It reads a local file only.
Which symbols? Any symbol for which you provide a matching options CSV.
Is it an auto-trading system? No. It draws information on the chart and offers buffers if you want to use it in your own EA. It never opens or closes trades.
Why does the regime often read negative or near the flip? When the chain is balanced, net gamma is close to zero and the sign is close to a coin flip. The indicator marks these readings as weak instead of presenting them as signals.

IMPORTANT DISCLAIMER

This product is an analytical tool provided for information and education only. It is not financial, investment or trading advice, and it is not a recommendation to buy or sell any instrument. All levels, regimes, biases, odds, hold-rates and probabilities are model-based estimates that depend on the quality and timeliness of the data you provide and on modelling assumptions (including the unverifiable dealer-positioning assumption) that may not hold. They are not predictions and not guarantees. Historical behaviour of price around a level does not guarantee future behaviour, and some levels show no measurable edge over a random level.

Trading leveraged products such as forex and CFDs carries a high risk of loss and may not be suitable for everyone. You can lose more than your initial deposit. Only trade with money you can afford to lose, test on a demo account first, and use your own risk management. No profit is promised or implied. The developer accepts no liability for any loss arising from use of this product. Demo-mode numbers are sample data and must never be used for trading decisions. Options data from third parties remains subject to that provider's terms; you are responsible for having the right to use the data you load.

SUPPORT

Questions or problems? Send me a private message on my MQL5 profile or use the product's Comments tab. Please include your terminal build, the symbol and the relevant lines from the Experts log. Updates are published through the Market, and you can see what changed on the Versions tab.
おすすめのプロダクト
Hello, This is an easy symbol change panel. This is a full version of Symbol1 2Changer Symbols must be active on your Market Watch list. Parameters: SymbolList - you can add more symbols with a comma(,) ratio - change the size LineNumber - you can set that how many symbols are displayed per line. button_width - modify the button size button_height - modify the button size Thank you.
Bohemia Gold MT5
Vladislav Taska
4.8 (5)
Bohemia Gold MT5 is  Trend & Volatility EA trading system designed specifically for Gold (XAUUSD) . It combines higher-timeframe trend filtering , trend detection , volatility-based SL management , and advanced trade management to adapt market conditions. It uses style logic focused on trend strength, volatility, and capital protection. NOTE:   Based on backtests, I found better trading results with the following setup: D1/H4/H2 (Trend/ADX/ATR & trade). The SET file can be downloaded here … bohe
FREE
Apex Point is a trend-following indicator for MetaTrader 5, transforming complex market data into signals for traders. It displays blue dots for uptrends, red dots for downtrends, and yellow crosses at potential reversals, helping users identify momentum shifts quickly. Key features include a confirmation system requiring multiple bars (default: 3) to validate changes, reducing false signals; dynamic ATR-based offsets for adaptive trailing, with instant ratcheting in the trend direction and smo
FREE
NeuroExt
Dmytryi Voitukhov
4 (11)
https://t.me/mql5_neuroExt   actual version Signal https://www.mql5.com/ru/signals/1511461 You can use any tool. The bases will be automatically created at the start of the Learn. If you need to start learning from 0 - just delete the base files. Initial deposit - from 200 ye. Options: DO NOT ATTEMPT TO TEST WITHOUT NEURAL NETWORK TRAINING! it is enough for the balance graph after training to be horizontal. generating a training base is extremely simple.  there is a ready-made training for U
FREE
Master Editionは、ボリュームとマネーフローの視点を通じて市場構造を可視化するために設計されたプロフェッショナルグレードの分析ツールです。標準のボリュームインジケーターとは異なり、このツールはチャート上に日足ボリュームプロファイルを直接表示し、価格発見がどこで行われたか、そして「スマートマネー」がどこに位置しているかを正確に確認できます。 このMaster Editionは、明確さとスピードを考慮して設計されており、ロード時にチャートレイアウトを即座に美化するユニークな自動テーマ同期システムを備えています。 主な機能: 真のマネーフロー計算: 標準のティックボリュームを超えます。「Use Money Flow」を有効にすると、ボリュームは価格によって重み付けされ、特定の価格レベルでの実際の資本コミットメントが明らかになります。 バリューエリア (VA) の可視化: バリューエリア(デフォルトではボリュームの70%)を自動的に計算します。 VA Fill: コントロールゾーンを即座に識別するために、バリューエリアの背景をシェーディングします。 主要レベル: コントロールポイン
Profit/Loss Visual Indicator – MetaTrader 5 Turn your chart into a real-time trade dashboard! This exclusive MT5 indicator allows you to instantly see the performance of your open positions without opening multiple windows or manually calculating profits and losses. Perfect for traders who want full control and a quick visual overview of their results. How It Works Every open position is automatically highlighted on the chart with a trend line connecting the entry price to the current price. Sma
Prop Session Risk Guard MT5 は、アクティブな市場セッション中に統合されたリスク認識を備えた、より明確なエントリーおよび出口ガイダンスを必要とする手動トレーダー向けに設計された、MetaTrader 5 用のセッションベースのシグナルインジケーターです。このプロフェッショナルツールは、確認済みの売買矢印、テイクプロフィット/ストップロスの予測、セッションタイミングフィルター、スプレッド監視、および明確なチャート上ダッシュボードを統合し、規律ある取引決定をサポートします。 コア機能 このインジケーターは、市場状況を読み、低品質のセットアップをフィルタリングし、強化された構造で取引を計画するのに役立つ手動取引アシスタントとして機能します。これは自動取引ロボットではなく、適切なセッションおよびリスクコンテキスト内でのみシグナルを表示する視覚的確認ツールであり、より選択的で情報に基づいた取引決定を可能にします。 主要機能 手動取引確認のための売買シグナル矢印 エントリータイミングの改善のためのセッションベースの市場フィルタリング(アジア、ロンドン、ニューヨークセッシ
Crypto_Forex MT5用インジケーター「 MFI Speed 」(リペイント機能なし) - このインジケーターの計算は物理学の方程式に基づいています。MFI SpeedはMFI自体の1階微分です。 - Money_Flow_Index (MFI)は、価格と出来高データを用いて売られ過ぎと買われ過ぎのゾーンを特定するテクニカルオシレーターです。 - MFI Speedは、主要トレンドの方向へのモメンタムエントリーをスキャルピングするのに適しています。 - 適切なトレンドインジケーター(例えば、標準EMA(画像参照)など)と組み合わせて使用​​してください。 - MFI Speedインジケーターは、MFI自体がどれだけ速く方向転換するかを示します。非常に敏感です。 - MFI Speedインジケーターの値が0未満の場合、速度は負です。値が0より大きい場合、速度は正です。 - インジケーターにはモバイルとPCのアラートが組み込まれています。 高品質のトレーディングロボットとインジケーターをご覧になるにはここをクリックしてください! これは、このMQL5ウェブサイトでのみ提供される
Main purpose:   "Pin Bars"   is designed to automatically detect pin bars on financial market charts. A pin bar is a candle with a characteristic body and a long tail, which can signal a trend reversal or correction. How it works:   The indicator analyzes each candle on the chart, determining the size of the body, tail and nose of the candle. When a pin bar corresponding to predefined parameters is detected, the indicator marks it on the chart with an up or down arrow, depending on the directi
FREE
Now free. Plan every trade before you click, see your real risk, reward and lot size right on the chart. Plan the trade. See the risk. Trade with confidence. Trade Planner Pro turns any chart into a visual trade-planning workspace. Drag three lines — Entry, Stop Loss and Take Profit — and instantly see your risk/reward ratio, the exact lot size for your chosen risk %, the real money you put on the line, the spread cost, and clear warnings before you commit. No more manual lot math, no more gu
FREE
Basic Support and Resistance   インジケータは、テクニカル分析を強化するために必要なソリューションです。このインジケータを使用すると、チャートにサポートレベルとレジスタンスレベルを投影できます/ mt4バージョン 機能 フィボナッチレベルの統合: サポートと抵抗レベルとともにフィボナッチレベルを表示するオプションを使用すると、私たちの指標は市場行動と逆転領域の可能性についてさらに深い洞察を提供します。 パフォーマンスの最適化: 各バーの開口部のみで拡張ラインを更新するオプションを使用すると、インジケータは、サポートレベルと抵抗レベルの精度を犠牲にすることなく最適なパフォーマンスを保証します。 入力 メイン設定 Timeframe:  この入力を通じて、より高い時間枠のサポートラインとレジスタンスラインをチャート上に表示することを選択できます。 Support/Resistance Strength [Number of Bars]:   この入力を使用して、サポートと抵抗の強度を決定できます。数が高いほど、サポート/抵抗がより強くなります。 Pric
LT Support Resistance - サポート&レジスタンスを100%自動で識別 手動でサポートラインやレジスタンスラインを引く作業に、時間を取られて疲れていませんか?あるいは、重要なレベルをいつも見落としてしまい、悔しい思いをしていませんか?LT Support Resistanceは、そのような煩わしい作業をなくすために開発されました。複数のタイムフレーム(時間足)を同時に分析し、取引しているアセットの最も重要なゾーンを自動的に識別してチャート上に描画します。 == 重要レベルのスマート自動化 == 主観的で時間の Gann(ガン)かかる手動のライン引きとは異なり、このインジケーターは価格の履歴を分析し、重要な反転ポイントを特定して、価格が「実際に」意識しているサポート・レジスタンスラインを描画します。その結果、客観的で素早い、データに基づいた分析が可能になります。 == 主な特徴 == 100% 自動検出: 手動による分析なしでサポート/レジスタンスを識別 マルチタイムフレーム (MTF): M5(5分足)チャート上に、H1、H4、D1、W1のレベルを同時に表示可能 ス
RCH FX Spread + Bar Close Countdown Indicator What This Indicator Does A simple, professional tool that displays real-time spread information and bar closing countdown directly on your MT5 charts. Key Features • Real-time spread display - Shows current spread in pips or points • Bar close countdown timer - Exact seconds remaining until current bar closes • Customizable alerts - Audio notification before bar closes • Fully adjustable display - Position, colors, fonts, and sizing options • Works o
FREE
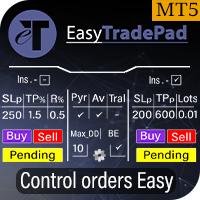
EasyTradePad – MetaTrader 5用取引パネル EasyTradePadは 、手動および半自動取引のためのツールです。パネルでは、注文とポジションを迅速に管理できるほか、リスク管理の計算もワンクリックで行えます。 パネルの機能: 事前に定義されたリスク(%または預金通貨)で取引を開始および終了します SLとTPをポイント、パーセンテージ、または金額で設定します リスクと報酬の比率を自動計算 損切りを損益分岐点に移動する 部分的なポジションのクローズ トレーリングストップ(ポイントまたはローソク足の影による) ポジションの平均化とピラミッディング アクティブな取引のパラメータを変更する [   デモ ] [   説明 ] 追加機能: ピラミッド化 価格がテイクプロフィットに近づくにつれて、段階的に取引を追加します。新規取引ごとのリスクを軽減できます。追加する取引数は簡単に設定できます。 平均化 チャート上のカスタムレベルで追加注文を出すことができます。ポジションは平均エントリー価格で決済されます。 損益分岐点移転 価格が指定された利益幅に達した後、ストップロ
Ignition
Dansie Software Limited
Strategy Overview The Ignition EA tries to take advantage of sudden momentum when the Ignition pattern is detected. The final bar in the ignition pattern has a small opening wick, a very little or no closing wick, is large in comparison to recent bars and must start from the lower end of the current range (for a bullish ignition) Quick Testing Use Symbol EURUSD, Timeframe M2, and remove the GBPUSD symbol from the "Symbols" input (stratergy 1 and stratergy 2) Settings The below settings appe
LC Trading Sessions
Lucas Albuquerque De Carvalho
LC Trading Sessions is a precision indicator designed to map liquidity windows across major global sessions ( New York, London, and Tokyo ). It is the perfect tool for Day Traders and Scalpers who need to visualize market opens and closes while maintaining a clutter-free chart. What does the indicator do? Automatic Mapping: Plots vertical lines with clear labels identifying the start and end of each session. Future Projection: Displays upcoming session opens, allowing you to plan your trading da
FREE
CosmiCLab SMC FIBO CosmiCLab SMC FIBO is a professional trading indicator designed for traders who use Smart Money Concepts (SMC), market structure analysis and Fibonacci retracement levels. The indicator automatically detects market swings and builds Fibonacci levels based on the latest impulse movement. It also identifies market structure changes such as BOS (Break of Structure) and CHOCH (Change of Character), helping traders understand the current market direction. CosmiCLab SMC FIBO also pr
Trade Behavior Mirror は、自分の口座の確定した取引履歴だけを読み、「損失が確定した直後に、自分のふだんの水準より大きいロットで新規ポジションを開いた」というパターンを1つだけ数えるツールです。予測も助言もしません。パネルに出るのは、すでにこの口座で起きたことの実測値だけです。 数字の作り方: 全銘柄・全マジック番号を対象に、最大31日分の確定した約定を読み込みます(チャートの銘柄に限らない、口座全体の集計です)。当日より前の30日間から、1日あたりの新規エントリー件数の中央値と、そのエントリーのロットの中央値を求めます。平均ではなく中央値を使うのは、1件だけ大きな取引があっても基準値全体が引きずられないようにするためです。その30日間のエントリーが5件に満たない場合は、十分な標本が無いということなので、無理に数字を出さず「Collecting history」と表示します。 核となる集計(画面では Entries within 10min of a loss, at above-median lot: の行): 新しいエントリーのたびに、その直前10分以内に損
FREE
BlueDigitsFx公式エコシステムへのアクセス インフラ更新情報、トレーディングリソース、製品リリース情報、およびBlueDigitsFx公式エコシステムへのアクセスを取得できます。 Telegramエコシステム ウェブサイト MT4版 BlueDigitsFx Spike And Strike Reversal MT5 — 市場反転とモメンタム分析のための複合オシレーター BlueDigitsFx Spike And Strike Reversal は、複数のインジケーターシグナルを組み合わせた複合オシレーターであり、市場の反転、モメンタムの変化、そしてトレンドの失速状態を特定するのに役立ちます。 このインジケーターは複数の分析要素を統合しており、オシレーターベースの確認機能を含みながら、視覚的なシグナルをチャート上に直接表示することで、構造的な反転分析をサポートします。 Spike And Strikeは、さまざまな市場環境において、反転局面、押し目・戻り、モメンタム転換時に追加の確認を求めるトレーダー向けに設計されています。 主な特徴 オシレーターに基づく視覚的な
Awesome Oscillator by Bill Williams with the ability to fine-tune and replace the averaging algorithms of the indicator, which significantly expands the possibilities of using this oscillator in algorithmic trading and brings it closer in its properties to such an indicator as the MACD. To reduce price noise, the final indicator is processed with an additional Smooth averaging. The indicator has the ability to give alerts, send mail messages and push signals when the direction of movement of th
Account Statistics – MetaTrader 5のためのトレーディング統計ダッシュボード Account StatisticsはMetaTrader 5向けの分析およびレポートツールです。取引口座の主要な指標をチャート上に直接表示し、さまざまな期間にわたるパフォーマンスを体系的に評価することができます。 本製品は、結果を体系的に分析し、明確に記録したいトレーダー向けに設計されています。 機能 統合されたダッシュボードは、主要な取引指標をリアルタイムで表示します。これには損益、勝率、プロフィットファクター、その他の統計データが含まれます。表示は日次、週次、月次、年次、および全期間の統計など、さまざまな期間に切り替えることが可能です。 さらに、このツールは自動レポート機能を備えています。レポートは指定した時刻に作成され、プラットフォームの通知機能を通じて送信されます。日次レポートと定期的なサマリーを組み合わせることも可能です。 プログラムは週次、月次、年次の切り替えなどの重要な期間を自動的に認識し、それに応じてレポートを補完します。 リスク管理のために、最大ドローダウン
FREE
EPo-CreW Forex Super ORB-H4 インジケーターへようこそ! 本ガイドでは、市場の最初の4時間のオープニングレンジに基づいて、高確率のトレード機会を特定するためのこの強力なツールの使い方を解説します。 初心者の方から経験豊富なトレーダーまで、このシステムはより高い自信と一貫性を持って取引する手助けとなります。 これはデモ製品です。インストール日から30日後に有効期限が切れます。フルバージョンはこちら: https://www.mql5.com/en/market/product/160926?source=Site OR https://t.me/Fundamental_fx 取引:すべての通貨、金(GOLD)とBTCUSD NB: M5 タイムフレームに切り替えることを確認してください。このインジケーターを使うのに最適なタイムフレームです。 トレーディング戦略 戦略1:ブレイクアウト & リトレースメント(メイン) SELL(売り)セットアップ: 価格が青いラインを上にブレイクする(高値ブレイク) ゴールドの BREAKOUT 矢印が表示される 価格が再び青い
FREE
Hello dear friend! Here is my story. Very often, you need to look at spreads for the entire day. But such statistics are hard to find. I decided to write a simple indicator for myself. Extra statistics are never too much . It saves me a hundred times over in time! The main goal: clear and fast. How to use: ***Drop it on the chart ***Configure it minimally ***Enjoy! These are SPREADS after all) Nothing much to explain. Features: ***Very clear. ***Adjustable history depth. ***Adjustable line
Suggested Name: TPO & Institutional Levels Pro Description: Elevate your market reading with TPO & Institutional Levels Pro B3 , the ultimate tool for Day Traders looking to trade alongside the smart money. Instead of cluttering your chart with multiple scattered indicators, we combined the most powerful institutional metrics into a single, clean, lightweight, and highly responsive interface for MetaTrader 5. Grounded in Auction Market Theory, this indicator reveals the true market structure. Ke
This is a multi-symbol, multi-timeframe, table-based indicator for MetaTrader 5 that identifies 46 types of candlestick formations. Each formation has its own image for easier recognition. The indicator includes popular patterns such as Engulfing, Hammer, Three Line Strike, Piercing, and Doji-like candles. You can check the full list of patterns in the screenshots below. Also you can not only switch all bearish or bullish patterns from input, but also select formation for a specified symbols and
AlgoDevMT5 Trade Manager Pro AlgoDevMT5 Trade Manager Pro is a professional trade management and risk control utility for MetaTrader 5. Designed for discretionary traders and funded account traders, this utility helps traders plan trades visually, calculate position size instantly, and manage risk with precision. Trade Manager Pro does not generate trading signals, open trades automatically, or provide investment advice. It is a trader-assistance utility designed to improve consistency and risk
Market Sessions Clockは、今どの市場が開いていて、次の市場がいつ開場・閉場するかを一目で確認できる小さなパネルです。 仕組み - 4つのセッション:シドニー、東京、ロンドン、ニューヨーク。それぞれオン/オフと時間を設定できます。 - 時間は各市場の現地時間で入力し(例:ロンドン 08:00-17:00)、シドニー、ロンドン、ニューヨークの夏時間は自動で反映されます。 - 各セッションについて、開場中か閉場中か、閉場または次の開場までの残り時間、その市場の現在の現地時刻を表示します。 - オプションの行で取引サーバー時間とUTCを表示します。ブローカーの時計が自分の時計と異なる場合に役立ちます。 - パネルはパソコンのUTC時計で毎秒更新されるため、新しいティックがなくてもカウントが続きます。 - 深夜0時をまたぐセッションにも対応します。初期設定では土曜日と日曜日はセッションを数えません(FXとCFD向け)。毎日取引される市場ではオフにしてください。 パラメーター - セッション:各市場のオン/オフと開始/終了時刻(HHMM)、週末のスイッチ。 - 表示:現地時
FREE
️ Trade Manager oneclick  ( Reverse Trade,  Partial Close,  Breakeven, Close All Running Trade )   control – Smart Manual Trade Control for MT5 Trade Manager oneclick control is a powerful yet lightweight trade management utility built for manual traders who want precise control over their open positions — directly from the MT5 chart. This EA does not open or close trades automatically based on any strategy. It simply provides one-click management tools to handle your running trades efficient
FREE
This Volume Delta Profile is an advanced MetaTrader 5 indicator that visualizes   volume delta (order flow imbalance)   using a volume profile-style histogram. It shows the difference between buying and selling pressure at specific price levels, helping traders identify supply and demand zones. This indicator provides a unique perspective on market dynamics by visualizing the imbalance between buying and selling pressure, offering insights beyond traditional volume analysis. Core Concept Positiv
Inversion FVG
Mohamed Amr Mohamed Osama Abdelwahab
Inversion FVG は、フェアバリューギャップ(3本のローソク足による不均衡)を検出し、そのギャップが機能しなくなった瞬間を狙うインジケーターです。ローソク足の実体がギャップを越えて終値を付けると、ギャップは「反転」し、サポートまたはレジスタンスになります。価格が再テストして反発(拒否)されると、矢印とともにエントリー、ストップロス、TP1、TP2 の水準が表示されます。 仕組み 1. 強気または弱気の FVG を検出し、通常のゾーンとして描画します。 2. ローソク足の実体がゾーンを越えて終値を付けると、ゾーンが反転します。 3. 最初の再テストと拒否の終値 = シグナル矢印(青の上向き = 買い、赤の下向き = 売り)。 4. ストップはゾーンの外側に ATR の余裕を加えて置きます。TP1 と TP2 は R の倍数(初期値 1R と 2R)です。 機能 - 確定した足のみで判定:矢印は再描画されず、足が確定した後に動きません。 - エントリー、SL、TP1、TP2 のラインは価格が到達した時点で止まります。 - 50%(CE)ライン、情報パネル、有効ゾーン数の表示
このプロダクトを購入した人は以下も購入しています
Trend Sniper X
Sarvarbek Abduvoxobov
4.86 (42)
Trend Sniper X は、トレードの方向性と潜在的な反転ポイントを明確かつ正確に特定するのに役立つ、MetaTrader 5 用のマルチタイムフレーム・トレンドフォロー指標です。 MT4用: https://www.mql5.com/en/market/product/193245 価格情報: 現在の価格はプロモーション価格であり、今後のアップデートや新機能のリリースに伴い変更される場合があります。 ボーナス特典: このインジケーター用の無料自動売買アシスタントEAを入手するには、購入後に an 著者(開発者)へメッセージをお送りください。 Code2Profit チャンネル マルチタイムフレーム分析で相場をマスターしよう! Trend Sniper X で勝率を最大化する方法:重要なルールとセッションのコツ 技術仕様 プラットフォーム MetaTrader 5 インジケータータイプ マルチタイムフレーム・トレンドインジケーター 操作タイムフレーム あらゆるチャートタイムフレームに対応。個別に選択可能な上位タイムフレーム (M1–MN1) を搭載 主要銘柄 FX、ゴールド (X
Smart Trend Trading System — MetaTrader 5 ご購入後、MQL5で私にメッセージをお送りいただくと、Smart Universal Expert Advisorを無料で受け取れるほか、オンライン講座、PDFマニュアル、非公開グループへのアクセスもご利用いただけます。 STTSは、トレンドの方向、エントリー・決済シグナル、反転ゾーン、重要な価格水準をチャート上にまとめて表示します。システムを参考に手動で取引することも、別の対応EAを接続し、ご自身で選んだ設定に基づいて自動売買することもできます。 ひとつのシステム、4つのトレードアプローチ STTSのトレードアプローチは、大きく4つのカテゴリーに分かれています。 • スキャルピング — 短期的なシグナルや相場の動きを捉えます。 • トレンドトレード — 方向性を評価し、トレンド内の機会を探します。 • 反転トレード — 反転の可能性があるゾーンや方向の変化を見つけます。 • 出来高トレード — 出来高に基づく情報を使い、市場の活発さを評価します。 エントリー・決済の矢印、トレンド情報、サポート・
新たな王者が登場 - インジケーター + 注文管理表示(TP1 + TP2 + TP3)+ オプションのTelegramシグナル送信機能付き(無料) (完全なトレード&シグナルシステム) ゴールド向け最高のEA: Gold Slayer このインジケーターには、高度な戦略、カスタマイズ可能な注文管理システム、そしてエンベロープ拡張を組み合わせた平均回帰システムが搭載されています。さらに、RSIなど複数のインテリジェントな確認フィルターによって、高確率の反転エントリーをBUY・SELLシグナルとして検出します。 単にトレードを学ぶだけでなく、複数ポジションを効果的に管理し、過去に利益を出しているオープンポジションで損失トレードをカバーする方法も学べます。 M5向けに構築・最適化されており、流動性が高くシグナルの精度が安定しているBTCUSDとXAUUSDで優れたパフォーマンスを発揮します。 このインジケーターは、ATRを基に自動計算されたエントリー、ストップロス、テイクプロフィットレベルを備えた明確なLong・Shortシグナルを提供するため、リスク管理が最初から組み込まれています。 マ
Zoryk Gold
Reda El Koutbane
4.76 (17)
割引は 24 時間後に終了します — 次の価格は$ 69 ZORYK — MetaTrader 5専用 XAUUSDシグナル・トレードプランニングシステム このような経験はありませんか。 ゴールドを分析し、エントリーを待ち、ようやくポジションを持った直後に価格が逆方向へ動く。 早すぎる決済をしてしまったり、Stop Lossを動かしたり、数秒迷っている間にチャンスを逃したりする。 その後、相場は自分が最初に予想していた方向へ進み、目標へ到達する。 問題は常に方向判断ではありません。 本当の問題は、明確な計画がなかったことです。 どこでエントリーすべきか。 どこでトレードの前提が無効になるのか。 近い利益を確保すべきか、より大きな値動きを待つべきか。 現在のsetupが本当に強いのか、それとも無理にトレードを探しているだけなのか。 ゴールドは非常に速く動きます。 正しい分析でも、明確なプランがなければ数秒で悪い判断に変わることがあります。 ZORYKは、その問題を解決するために開発されました。 ZORYKとは ZORYKは、MetaTrader 5とXAU
あなたのトレード優位性を視界に入れよう! M5 Sniper は MeanFX による新しいインジケーターです。 正確なトレードシグナル と 適応型TP/SLレベル を組み合わせることで、結果として可能な限り最高の統計的トレードを実現します! 5回購入されるごとに価格が上昇し、次の価格は69$です 購入後に私にメッセージを送っていただければ、ヒント/ガイドとボーナスEAをお受け取りいただけます 何が他と違うのでしょうか? Gold XAUUSDにおける 実証済みの統計的パフォーマンス ( ほぼすべてのアセットで機能します 。一貫した結果が得られないまま何でも扱おうとするのではなく、1つの時間足をマスターすることに重点を置いています) 1日あたり1~8回のトレード を各シンボルで実行し、高い勝率と、すべての統計的優位性をこちら側に持つことができます チャート上には 確認済みの BUYおよびSELLシグナルのみを表示 適応型TPおよびSLレベル を各トレードごとにインジケーターが生成 平均Winrate 75%+ 平均 Signal Ratio 最低1.1+ アラーム と通知を 携帯電話
SuperScalp Pro
Van Minh Nguyen
4.54 (37)
SuperScalp Pro - Professional Multi-Layer Confluence Scalping System SuperScalp Proは、複数の高度な確認フィルターを追加することで、従来のSupertrendを強化したスキャルピング向けインジケーターです。誤ったシグナルを大幅に減らしながら、成功する可能性がより高いBuy/Sellの取引機会を見つけるのに役立ちます。 BuyとSellの矢印がチャート上に明確に表示され、ATRに基づくStop LossとTake Profitのレベルもリアルタイムで自動計算されます。 無料EA特典: ご購入後、私にご連絡いただくと、このインジケーターの取引シグナルを自動化する無料EAを受け取れるほか、インストールと設定のサポートもご利用いただけます。 推奨設定ファイルをダウンロード: [Set File] 詳細なドキュメントは製品ブログでご覧いただけます: [User Guide] 最新情報を受け取るには公式チャンネルにご参加ください: [Official Channel] SuperScalp Proの仕組み 複数の
Boba Analysis Suite
Trade Ready Solutions LLC
5 (1)
Boba Analysis Suite Boba Analysis Suite は、MetaTrader 5 向けの分析インジケーターです。市場構造、重要な価格帯、相場全体の状況を、一つのチャート画面にまとめて表示します。 トレーダーおよびトレーディング指導者としての実務経験をもとに開発され、市場の方向性の評価、重要な価格水準の特定、複数の時間足を組み合わせた分析など、体系的な分析プロセスを支援します。 相場の背景を踏まえた分析 個々のシグナルの意味は、相場の状況によって変わります。Boba Analysis Suite は、現在のチャート状況をより大きな市場構造と関連付け、あらかじめ定めたルールに沿って取引アイデアを検討するための分析を支援します。 主な分析機能: トレンドと市場構造: 市場の方向性と、その背景にある構造を評価します。 重要な価格帯と価格水準: さらに分析すべき重要な領域を視覚的に表示します。 複数の時間足: 異なる時間足の情報を組み合わせ、相場全体の状況を評価します。 視覚的な分析プロセス: 分析情報をチャート上で直接確認できます。 自主的な取引判断を支援 Boba
SMC Intraday Formula
VividMind Digital Solutions
5 (26)
まず正直に言いましょう。 どんなインジケーターも、それ単体であなたを利益化させることはできません。もしそう言う人がいるなら、それは夢を売っているだけです。完璧な売買シグナル(矢印)を表示するインジケーターは、いくらでも“完璧に見せる”ことができます。正しい過去の区間を拡大して、勝ちトレードだけを切り取ればいいだけです。私たちはそれをしません。 SMC Intraday Formula はツールです。 市場構造を読み取り、最も高い確率の価格ゾーンを特定し、今この瞬間のスマートマネーの痕跡をシンプルな言葉で正確に示します。最終判断はあなたが行います。トレードを実行するのもあなたです。しかし今は「希望」ではなく「精度」でエントリーできます。 私たちはこのインジケーターを、ゴールド(XAUUSD)および主要FX通貨ペアで約3年間、日々のスキャルピングに使用してきました。M1、M5、M15、M30の主要ツールです。これは未来を予測しようとするのではなく、今まさに形成されている高確率セットアップを示し、その理由を説明します。 他のすべてのインジケーターと何が違うのか? ほとんどのトレーディングイ
伝説が帰ってきました:Entry Points Pro 10。 MQL5 Marketのトップ3に3年間入り続けた伝説的インジケーターの再始動です。 2つのバージョンで合計589件の高評価レビュー、毎日数千人のトレーダーが実際のトレードに使用し、デモのダウンロードは31,000件以上   MT4+MT5 。 私はこの5年間に寄せられたレビューをすべて読み、約束を並べる代わりに、その答えをバージョン10に組み込みました。1999年から相場に携わり、 誠実さ、自らの評判、そして顧客を大切にする 作者による製品です。 Entry Points Proのエントリーシグナルは、リペイント(再描画)を一切行いません。 そして今回初めて、これは作者の言葉ではなく検証可能な事実になりました。確定シグナルはローソク足の終値確定後にのみ表示され、自動テストで リペイントはゼロ と確認されています(EURUSD、XAUUSD、BTCUSDで2,486,568回の不変条件チェック、違反0件)。検証方法は公開されており、ストラテジーテスターでご自身で再現できます。 ご購入後は、必ずすぐにダイレクトメッセージでご
Auto Optimized SpeedAngle は、継続的なウォークフォワード最適化(WFO:Walk-Forward Optimization)によりカーブフィッティング(過剰最適化)を排除した、機関投資家レベルのモメンタムベクトルシステムです。市場レジームの変化時に効果が低下する静的な入力に依存せず、アウトオブサンプル(OOS)検証を用いてパラメーターを動的に再キャリブレーションすることで、表示されるシグナルが単なる過去の偶然ではなく、確実な統計的優位性に基づいていることを保証します。 主な機関投資家向けフレームワーク ウォークフォワード最適化エンジン: ルックバック期間やしきい値の数千に及ぶ組み合わせを継続的にスキャンし、データをインサンプルとアウトオブサンプルに厳格に分離します。未検証のデータ環境において数学的優位性が証明された場合にのみ、新しいパラメーター設定を採用します。 定量的目的関数: 単なる純利益の追求ではなく、機関投資家レベルの安定性指標をターゲットとします。システム品質ナンバー(SQN)、期待値(1トレードあたりの平均Rマルチプル)、またはネットRの最適化を選
GoldenX Entry MT5
VividMind Digital Solutions
5 (17)
GoldenX Entryは、MT5向けのインジケーターであり、適応型Smart Entry Trendアルゴリズム、シグナルスコアリングシステム、マーケットレジーム検出機能、およびボラティリティフィルターを備えています。各シグナルには、計算されたエントリーレベル、3つのテイクプロフィット(TP1、TP2、TP3)、およびストップロスレベルが含まれます。本インジケーターは、異なる市場環境に適応するために設計された複数の分析レイヤー上に構築されており、マルチレイヤー分析システムと内蔵オプティマイザーおよび統計トラッキングシステムを組み合わせています。リスク・リワード(RR)指標および過去のトレード履歴に基づく定量分析を提供します。 使い始めは簡単です — 選択した時間足でオプティマイザーを実行し、そのままチャート上でインジケーターを使用します。 コア機能 GoldenX Entryは、シグナルエンジンとトレード管理機能、そして過去統計トラッキングを1つのチャートに統合しています: - 内蔵オプティマイザー: オプティマイザーはチャート上でワンクリックで実行できます。200通りのパラメー
ARIPoint
Temirlan Kdyrkhan
1 (4)
ARIPoint is a powerful trading companion designed to generate high-probability entry signals with dynamic TP/SL/DP levels based on volatility. Built-in performance tracking shows win/loss stats, PP1/PP2 hits, and success rates all updated live. Key Features: Buy/Sell signals with adaptive volatility bands Real-time TP/SL/DP levels based on ATR Built-in MA Filter with optional ATR/StdDev volatility Performance stats panel (Success, Profit/Loss, PP1/PP2) Alerts via popup, sound, push, or email Cu
Adaptive Price Action Engine インジケーターを購入すると、EAが無料に マルチタイムフレーム対応・自己最適化トレンド&ローソク足パターン分析 市場環境は常に変化しており、すべてのPrice Actionパターンが、あらゆる市場環境で同じ価値を持つわけではありません。 Adaptive Price Action Engine は、変化する市場環境への適応を目的として、 トレンド構造、マルチタイムフレーム分析、ローソク足パターン、統計的最適化 を1つの分析フレームワークに統合しています。 2つのアダプティブモード Dual Alpha Trend Mode 低い時間足と高い時間足のAlpha Trendパラメータを自動的に探索し、直近の市場動向に合わせてトレンド判定を適応させます。 Candlestick + Alpha Mode Alpha Trendによる市場レジーム判定と、 22種類の強気・弱気ローソク足パターン を組み合わせます。すべてのパターンを同じように扱うのではなく、さまざまなパターンの組み合わせを統計的に評価し、選択された市場環境において過去
M1 SNIPER は使いやすいトレーディングインジケーターシステムです。M1時間足向けに設計された矢印インジケーターです。M1時間足でのスキャルピングのためのスタンドアロンシステムとして、また既存のトレーディングシステムの一部としても使用できます。このトレーディングシステムはM1時間足での取引に特化して設計されていますが、他の時間足でも使用できます。元々、この手法はXAUUSDとBTCUSDの取引用に設計しましたが、他の市場においても役立つと考えています。 インジケーターのシグナルは、トレンドの方向と逆方向に取引できます。インジケーターのシグナルを利用して両方向に取引するのに役立つ特別な取引テクニックをご紹介します。この手法は、特別な動的なサポートとレジスタンスの価格帯を利用することに基づいています。 ご購入後、M1 SNIPER矢印インジケーターをすぐにダウンロードできます。さらに、M1 SNIPERツールのすべてのユーザーに、以下のスクリーンショットに表示されているApollo Dynamic SRインジケーターを無料で提供しています。この2つのインジケーターを組み合わせることで
Gann Made Easy   は、ミスター・ギャンの理論を使用した取引の最良の原則に基づいた、プロフェッショナルで使いやすい外国為替取引システムです。 W・D・ガン。このインジケーターは、ストップロスとテイクプロフィットレベルを含む正確な買いと売りのシグナルを提供します。 PUSH通知を利用して外出先でも取引可能です。 ご購入後、取引方法の説明と優れた追加インジケーターを無料で入手するには、私にご連絡ください! おそらく、ギャンの取引手法についてはすでに何度も聞いたことがあるでしょう。通常、ギャンの理論は初心者のトレーダーだけでなく、すでにある程度の取引経験がある人にとっても非常に複雑なものです。なぜなら、ギャンの取引手法は理論的にはそれほど簡単に適用できるものではないからです。私はその知識を磨き、最良の原則を私の外国為替インジケーターに組み込むために数年を費やしました。 このインジケーターは非常に簡単に適用できます。必要なのは、それをチャートに添付し、簡単な取引推奨事項に従うだけです。このインジケーターは常に市場分析の仕事を行い、取引の機会を探します。適切なエントリーポイントを検
FiboSniper Pro – Multi-Filter Fibonacci System with Auto SL/TP and Control Panel FiboSniper Proは、動的なFibonacci Envelopesと複数の確認フィルターを組み合わせ、選別されたBuyおよびSellシグナルを生成するテクニカルインジケーターです。FibonacciレベルはMoving AverageとATRを基に計算され、その後ADX、EMA、RSI、ATR、Volume、Time、Candle構造によってフィルタリングされます。インジケーターは、ATRに基づく自動Stop LossおよびTake Profitレベルをチャート上に直接表示し、さらに迅速な調整が可能なインタラクティブControl Panelを提供します。 購入後、推奨設定ファイルと詳細な使用方法については、私にご連絡ください。 Auto Trader Xを使用してFiboSniper Proのシグナルを自動化できます: [Auto Trader X] User GuideとSet Files: [Click her
Tokyo Indicatorは、トレンドの方向性、潜在的な取引シグナル、および市場状況を視覚的に分かりやすく表示します。 色分けされた階段状のトレンドラインにより、強気局面(青色)と弱気局面(マゼンタ色)が明確に区別されます。トレンドの変化に合わせて表示される方向矢印は、売買の好機を強調します。 統合されたダッシュボードには、現在のシグナル、市場のバイアス(傾向)、モメンタム、ボラティリティ、シグナルの品質がひと目で分かるようにまとめられています。これにより、トレーダーはパネルを切り替えることなく、価格変動(プライスアクション)とインジケーターの数値を照らし合わせて分析を行うことができます。 すっきりとしたチャート表示と簡潔な市場概要により、Tokyo Indicatorはトレンド分析や取引判断における体系的なアプローチをサポートします。 あらゆる時間足や銘柄に対応しており、特に金(ゴールド)の取引に適しています。 トレンド スキャナーの強力なサポートを利用して、無料のインジケーターを入手し、プライバシーを守ります。あーみー!     設定 ShowHUD - チャート上のパネ
次回アップデート — バージョン 2.52 近日公開!【新機能】 市場分析とトレードワークフローを強化する、4つの主要な新機能にご期待ください 皆様のトレードニーズに応える4つの新機能により、市場分析を次のレベルへと引き上げます。新機能をご紹介します: 1. TRADE OVERVIEW DASHBOARD 2. CONFLUENCE AT ZONE 3. STRONG & WEAK HIGH/LOW 4. OTE 1. TRADE OVERVIEW DASHBOARD 市場全体の状況をより簡単に把握できるダッシュボードです。トレード判断をサポートするガイダンスを提供し、市場分析とトレード計画を体系的に行えるよう支援します。すべてを1つの画面で確認できます。 マルチタイムフレーム市場概要(Multi-Timeframe Market Overview) 市場の方向性と価格構造をより明確に把握 市場状況をすばやく確認 体系的な市場分析とエントリー計画のためのガイダンス 2. CONFLUENCE AT ZONE 価格が重要なゾーンに入るとき…いくつのサポート要因が一致しているかを確認で
Break and Retest Hunter is a powerful MetaTrader 5 indicator designed to automatically identify support and resistance levels, breakout structures, and potential retest opportunities in real time. Bonus Indicator: After purchasing Break and Retest Hunter , contact me to receive Trade Indicator Assistant EA completely free as a bonus utility. $65 for the next 10 copies . Next price is $120.  Combining adaptive market analysis, clear BUY/SELL signals, Fibonacci-based profit targets, and a premiu
Neuro Poseidon is a new indicator by Daria Rezueva. It combines precise trading signals with adaptive TP/SL levels - creating best possible trades as a result! Message me and get  Neuro Poseidon Assistant  as a gift to automize your trading process! What makes it stand out? 1. Proven profitability on all assets and timeframes 2. Only confirmed BUY and SELL signals present on the chart 3. Adaptive TP & SL levels generated by the software for each trade 4. Easy to understand - suitable for al
トレンドキャッチャーインジケーター トレンドキャッチャーインジケーターは、開発者独自の適応型トレンド分析指標を組み合わせることで、市場価格の動きを分析します。短期的なノイズを除去し、根底にあるモメンタムの強さ、ボラティリティの拡大、価格構造の挙動に焦点を当てることで、真の市場方向性を特定します。また、移動平均線、RSI、ボラティリティフィルターなどの平滑化およびトレンドフィルタリング機能を備えたカスタマイズ指標も使用します。 実際の運用状況のモニタリングやその他の製品については、こちらをご覧ください: https://www.mql5.com/en/users/mechanic/seller ご注意ください。私はTelegramでEAや設定を販売していません。詐欺です。すべての設定はブログで無料で公開しています。 重要!ご購入後すぐにご連絡ください。手順とボーナスをお送りします!
Gold Trend Coach MT5
Cristhian Alexander Gaibor Cuasquer
5 (2)
Gold Trend Coach は MetaTrader 5 用のゴールド(XAUUSD)トレンドインジケーターです。売買シグナル、ストップロス、3 つのテイクプロフィット目標を足の確定時に確定し、マルチタイムフレームのコーチダッシュボードとスマートフォンと Telegram へのアラートを備えています。ロンドンとニューヨークのセッションでの M5 スキャルピングと M15 デイトレード向けに作られています。 Gold Trend Coach:エントリー、ストップ、3 つのターゲット付きの XAUUSD ゴールドトレンドシグナル。発売価格 $39 は最初の 20 本限定、その後 $59。 購入後にメッセージをいただければ、購入者キットをすぐにお送りします。 最悪の連敗をチャート上に表示するゴールド用インジケーター。 このマーケットの XAUUSD インジケーターはどれも勝ちシグナルを見せてくれます。Gold Trend Coach は負けシグナルも見せます。赤で数え、最悪の連敗と純損益を、都合の良いものだけでなくすべてを数えるパネルに表示します。シグナルがストップに達したら、それが
FX Trend NG:次世代マルチマーケット・トレンドインテリジェンス 概要 FX Trend NG は、複数の時間足に対応したプロフェッショナル向けトレンド分析およびマーケット監視ツールです。 市場全体の構造を数秒で把握することができます。 複数のチャートを切り替える必要はありません。どの銘柄がトレンド中なのか、どこでモメンタムが弱まっているのか、そしてどの時間足で強い整合性があるのかを瞬時に確認できます。 ローンチ特別オファー – FX Trend NG を $30(6ヶ月) または $80 永久ライセンス でご利用いただけます。 すでに Stein Investments のユーザーですか? -> メッセージを送信 して、プライベートグループへアクセスしてください。 セットアップや詳細情報が必要ですか? -> Stein Investments 公式ページ をご覧ください。 1. FX Trend NG が他と異なる理由 3ステート・トレンドロジック ― Buy と Sell だけではない • 多くのインジケーターは Buy または Sell の2状態のみを表示します。
Smart Price Action Concepts — MetaTrader 5 ご購入後、MQL5で私にメッセージをお送りいただくと、Smart Universal Expert Advisorを無料で受け取れるほか、オンライン講座、PDFマニュアル、非公開グループへのアクセスもご利用いただけます。 構造を確認し、ゾーンを見つけ、取引プランを立てる。 Smart Money Concepts(SMC)、ICTスタイルの分析、プライスアクションを、見やすいチャートにまとめます。市場構造、オーダーブロック、流動性の参考水準、インバランスを確認し、Smart Panelで表示する要素を選択できます。 市場をより体系的に分析 • 市場構造:内部構造とスイング構造、HH/HL/LL/LH、BOSとCHoCH、上位時間足分析、複数時間足ダッシュボード。 • 主要ゾーン:内部およびスイングのオーダーブロック、需給ゾーン、Fair Value Gaps、プレミアム・均衡・ディスカウントゾーン。 • 流動性の参考水準:同値高値・安値、強い・弱いスイングポイント、前日・前週・前月の高値と安値。
Unix Scalper — MetaTrader 5 ご購入後、MQL5で私にメッセージをお送りいただくと、Smart Universal Expert Advisorを無料で受け取れるほか、オンライン講座、PDFマニュアル、非公開グループへのアクセスもご利用いただけます。 セットアップを見つけ、取引プランを確認し、取引方法を選ぶ。 UNIX Scalperは、市場分析、BUY/SELL/WAITの判断、Entry、Stop Loss、TP1、TP2の水準を、見やすいパネルにまとめています。 シグナルと取引プランを確認 • 明確な判断:BUY、SELL、WAIT。 • 明示された水準:Entry、Stop Loss、TP1、TP2。 • 複数時間足の一覧:パネル上で各時間足のシグナルを比較。 • 判断を支える分析:トレンド、モメンタム、出来高、ボラティリティ、サポートとレジスタンス、市場の質。 • 選べるレイアウト:Minimized、Compact、Standard、Full。 シグナルと各水準を確認し、そのセットアップがご自身の取引ルールに合うか判断してください。 ゴール
ご紹介     Quantum Breakout PRO は 、ブレイクアウト ゾーンの取引方法を変革する画期的な MQL5 インジケーターです。 13年以上の取引経験を持つ経験豊富なトレーダーのチームによって開発されました。     クォンタム ブレイクアウト プロ   は、革新的でダイナミックなブレイクアウト ゾーン戦略により、あなたのトレーディングの旅を新たな高みに押し上げるように設計されています。 クォンタム ブレイクアウト インジケーターは、5 つの利益ターゲット ゾーンを備えたブレイクアウト ゾーン上のシグナル矢印と、ブレイクアウト ボックスに基づいたストップロスの提案を提供します。 初心者トレーダーにもプロのトレーダーにも適しています。 量子EAチャネル:       ここをクリック 重要!購入後、インストールマニュアルを受け取るためにプライベートメッセージを送ってください。 推奨事項: 時間枠: M15 通貨ペア: GBPJPY、EURJPY、USDJPY、NZDUSD、XAUUSD アカウントの種類: ECN、Raw、またはスプレッドが非常に低い R
多通貨対応の通貨強弱・モメンタム・インジケーター MT5 Dynamic Forex28 Navigator は、長年ご好評いただいているインジケーターの発展版で、3 つの機能を 1 つに統合したものです: Advanced Currency Strength28 Indicator (700 件のレビュー) Advanced Currency IMPULSE with ALERT (530 件のレビュー) CS28 Combo Signals(最近のボーナス) この 2 つの前身インジケーターは MQL5 Market で合計 1,200 件を超えるレビューを獲得しており、2016 年から MT4 コミュニティで定番となっています。Dynamic Forex28 Navigator MT5 は、実績ある同じロジックを引き継いでいます。 MetaTrader 5 向けに完全に再構築 – MT5 ネイティブのマルチシンボル・アーキテクチャを最大限に活かす設計です。 ユーザーマニュアル: https://www.mql5.com/en/blogs/post/758844 MT4 版をお探し
「Scalper Vault」は、デイトレードで安定した成果を目指すトレーダーのために設計された、強力かつ充実した機能を備えたトレーディングシステムです。 この高精度なインジケーターは、それ単体で完結するトレーディングシステムとして機能し、FXやバイナリーオプションのトレーダーに、機関投資家レベルの分析を提供します。 ご購入後、ぜひご連絡ください。 トレードのヒントに加え、豪華なボーナスをプレゼントいたします! 「Scalper Vault」を活用すれば、勘に頼った判断や複雑な手動分析は不要です。使いやすいトレード手法に集中し、純粋に「エントリー・決済」という実行フェーズに専念できます。 高精度なトレンドフォロー・シグナル:中核となるアルゴリズムが市場構造を分析し、主要なトレンド方向に沿った高確率なシグナルを提示します。これにより、誤ったエントリーを大幅に削減できます。 精度の高い天井・底の検知:市場の勢いが尽きたポイントをスキャンし、反転の可能性が高いゾーンを特定します。 ギャン(Gann)理論に基づく売買ゾーン:数学的な「ギャン・レベル」を自動的にチャート上に描画します。機関投資
Volatility Master for MetaTrader is a real-time dashboard tool that scans up to  50 symbols  to identify high-volatility , trending markets instantly. With bullish/bearish signals, customizable alerts, and a user-friendly interface, it helps you avoid range-bound conditions and focus on high-probability trades. Clarity leads to confidence. Trade confidently and protect your capital effectively with this powerful dashboard. We don't offer free or bonus indicators in exchange of reviews from you.
Power Candles V3 - 自己最適化型強弱インジケーター Power Candles V3は 、通貨や銘柄の強さを、適用されたすべてのチャート上で実行可能なトレードプランに変換します。単にローソク足を色分けするだけでなく、バックグラウンドでリアルタイムの自動最適化を実行し、目の前の銘柄に対して最適なストップロス、テイクプロフィット、およびシグナルの閾値を提示します。ワンクリックで実取引に適用でき、エントリーポイント、ストップロス、テイクプロフィットのラインが正確な価格位置にチャート上に表示され、方向性を示すアラートがリアルタイムで発動します。 このツールは、Stein Investmentsのエコシステムの一部です。  18種類以上のツールをすべて閲覧し、AIを活用したセットアップの推奨事項を入手し、  https://stein.investments でコミュニティに参加しましょう クローズしたバーごとに3,000回以上のトレードシミュレーション。9つの強さの状態。2つの戦略を並行してテスト。勝率の高い設定をワンクリックで適用。 なぜこれが必要なのか ほとんどの強
作者のその他のプロダクト
Short Description Drag two lines to any chart range for an instant Fixed-Range Volume Profile (POC, Value Area VAH/VAL) featuring Delta Coloring, Developing Profile tracking, Initial Balance, HVN/LVN, and Retest Rays. Detailed Description The Fixed-Range Volume Profile & Delta Analyzer answers a foundational market structure question: At which price did the most trading activity actually occur within a specific timeframe? Simply drag the two vertical reference lines ( START and END ) anywhere o
FREE
Short description: Automatically detects bullish and bearish Order Blocks from volume-pivot analysis and draws them as clean, flicker-free boxes with an average price line. Full description Overview OrderBlockDetector locates institutional Order Blocks — the last opposing candle before a strong volume-driven move — using a volume-pivot algorithm instead of simple candle-pattern heuristics. Each detected block is drawn as a shaded zone with a border and a midline (average price), and is automati
FREE
Short description   Right-anchored, flicker-free Volume Profile with POC/VAH/VAL lines, tick-throttled updates, and zero measurable lag even on fast, high-volume symbols. Full description Anchored Volume Profile draws a fixed-range volume histogram from a chosen start date through to the live, forming bar — pinned to the right edge of your chart like the panels in TradingView, and built to stay smooth even on fast-moving, high-tick-volume symbols. KEY FEATURES - Fixed-range profile anchored to a
FREE
Short Description Draws rolling Time-Price-Opportunity (TPO) and footprint volume profiles for the Asia, London, and New York sessions with POC/VAH/VAL levels, delta volume bias, order flow overlays, liquidity heatmaps, developing rolling lines, Naked POC (NPOC) tracking, Initial Balance breakouts, multi-session confluence zones, and automatic broker GMT-offset detection. Full Description Plots separate market-profile and volume-profile style histograms for the three major trading sessions (Asi
FREE
Short description GBPUSD Gamma Exposure (GEX) Profile from CME B6 Options — Call Wall, Put Wall & Zero-Gamma Flip, Live on Chart Reads a Barchart CME British Pound (B6) options CSV, solves Black-76 implied volatility per strike, and renders a right-anchored dealer GEX profile directly on your GBPUSD chart — with continuously updating Call Wall, Put Wall, and Zero-Gamma flip levels. Full description See where dealer hedging flow is likely to pin, accelerate, or reverse price — before it happens.
FREE
Short Description PriceLevel LTF is an all-in-one price-structure suite for the major Forex pairs: a round-number ("big figure") reaction grid — Wall, Hot Zone, Exit, Trap — layered with volume-profile confluence, HTF Monthly/Weekly key levels, a session liquidity-sweep/stop-hunt detector, dual liquidity heatmaps, and automatic Wyckoff Method and Elliott Wave phase detection. Built and tuned for the M15 timeframe. Updates in place with no flicker and refreshes instantly on new bars and fast pri
FREE
HTF Open Markers + ICT Silver Bullet Zones — Usage & Strategy Guide What it draws Session 1 / Session 2 lines : vertical lines at the open of every bar on two independently configurable higher timeframes (defaults: H4 and D1), including a projected line for the rest of today's not-yet-opened bars on sub-daily timeframes, so you can see where the next candle will open before it happens. ICT Silver Bullet zones : shaded rectangles over the three classic ICT kill-zone windows, converted from New Yo
FREE
Short description: A higher-timeframe round-number grid for major Forex pairs — major whole-number levels, monthly midpoints, and quarter levels (with optional eighths), spanning a wide configurable pip range. Built for H4 and above. Full description: Plots a large-scale psychological-level grid across whole numbers, half-levels, and quarters — the higher-timeframe counterpart to intraday round-number analysis. Designed for swing and position-level context on H4 and above , not for scalping time
FREE
Volume Zone Analyzer — VSA-Based Volume, Delta & Spread Reader Turn any price zone into a Volume Spread Analysis. Drop two draggable lines on your chart to mark a Zone Start and Zone End , and Volume Zone Analyzer instantly breaks down what happened inside that zone: Total Volume for the selected range Buy / Sell Delta — estimated from where each candle closes within its own high-low range Delta % with a visual buy/sell ratio bar Average Spread , plus a count of wide vs. narrow-spread candles (t
FREE
Short description Plots a repeating grid of round-dollar levels on ETHUSD — labeled Wall / Hot Zone / Exit / Trap by their typical institutional role — tuned for lower timeframes (M1 through H1). Full description Draws horizontal reference lines at 10 intervals around the current ETHUSD price, based on the idea that round-dollar levels (multiples of $100, and near-round levels like $X20/ X80, $X50, $X10/$X90) tend to act as psychological reaction zones where liquidity and stop-hunts commonly clu
FREE
フィルタ:
レビューなし
レビューに返信