OrderBlockDetector
- インディケータ
- バージョン: 1.13
- アップデート済み: 17 8月 2026

Short description:
Automatically detects bullish and bearish Order Blocks from volume-pivot analysis and draws them as clean, flicker-free boxes with an average price line.Full description
Overview
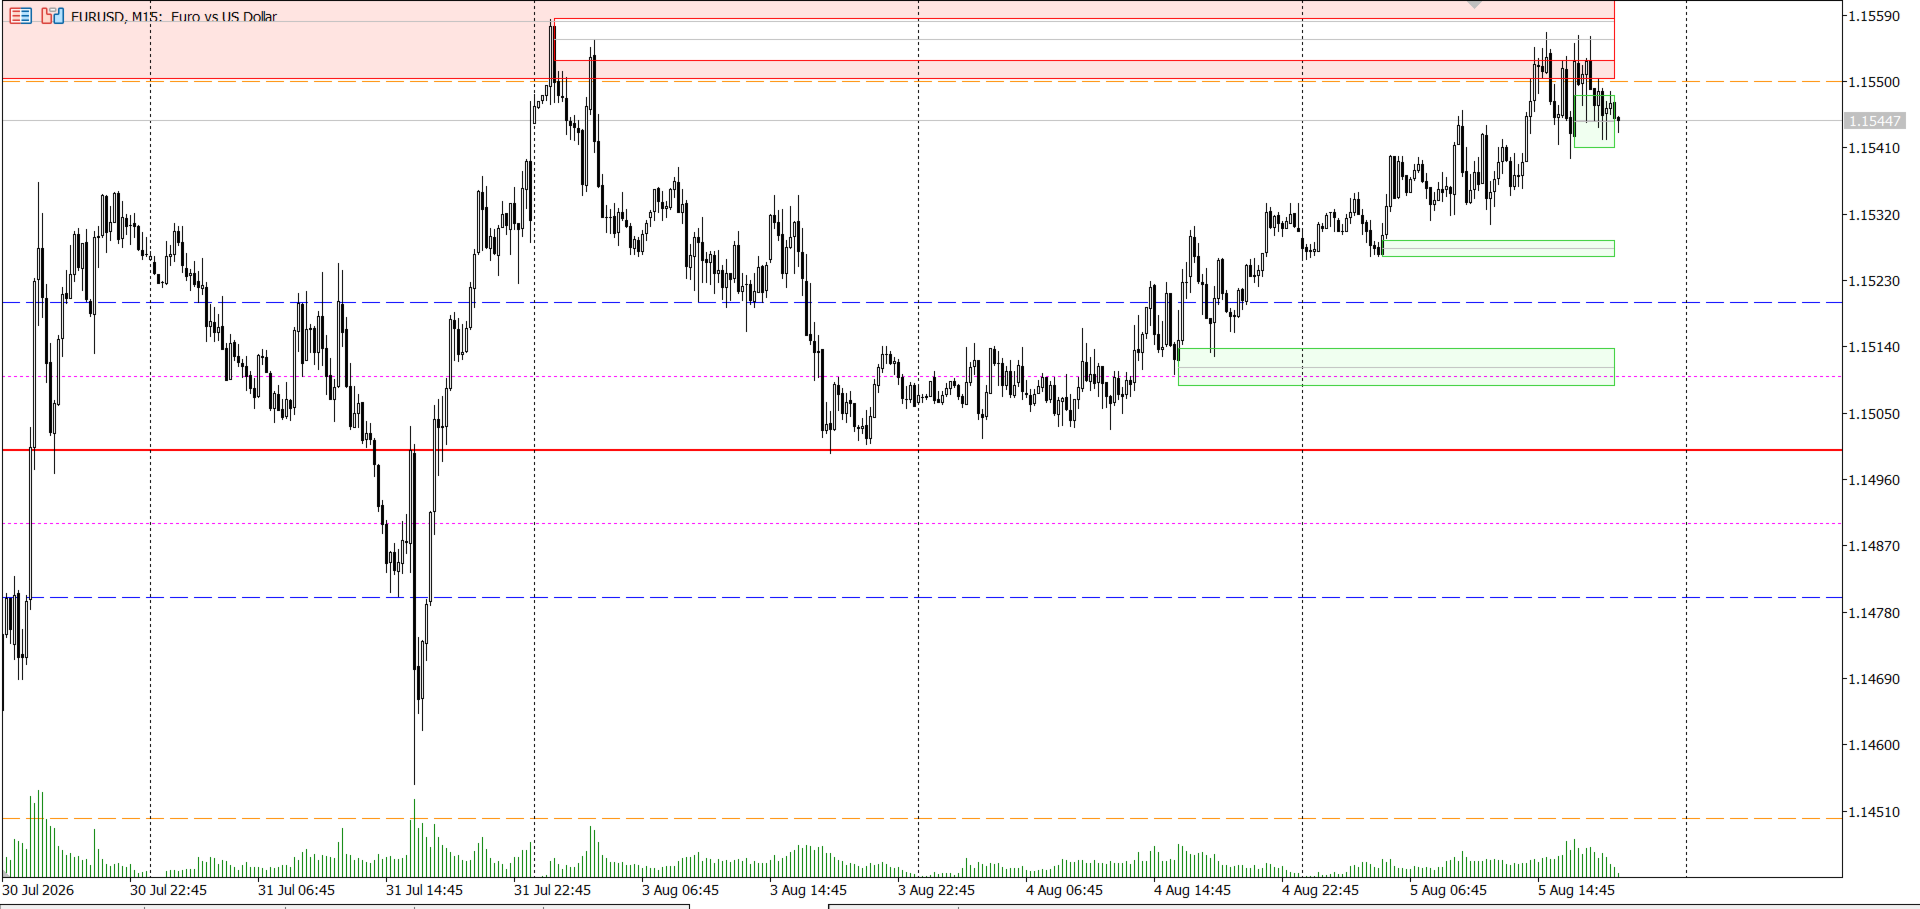
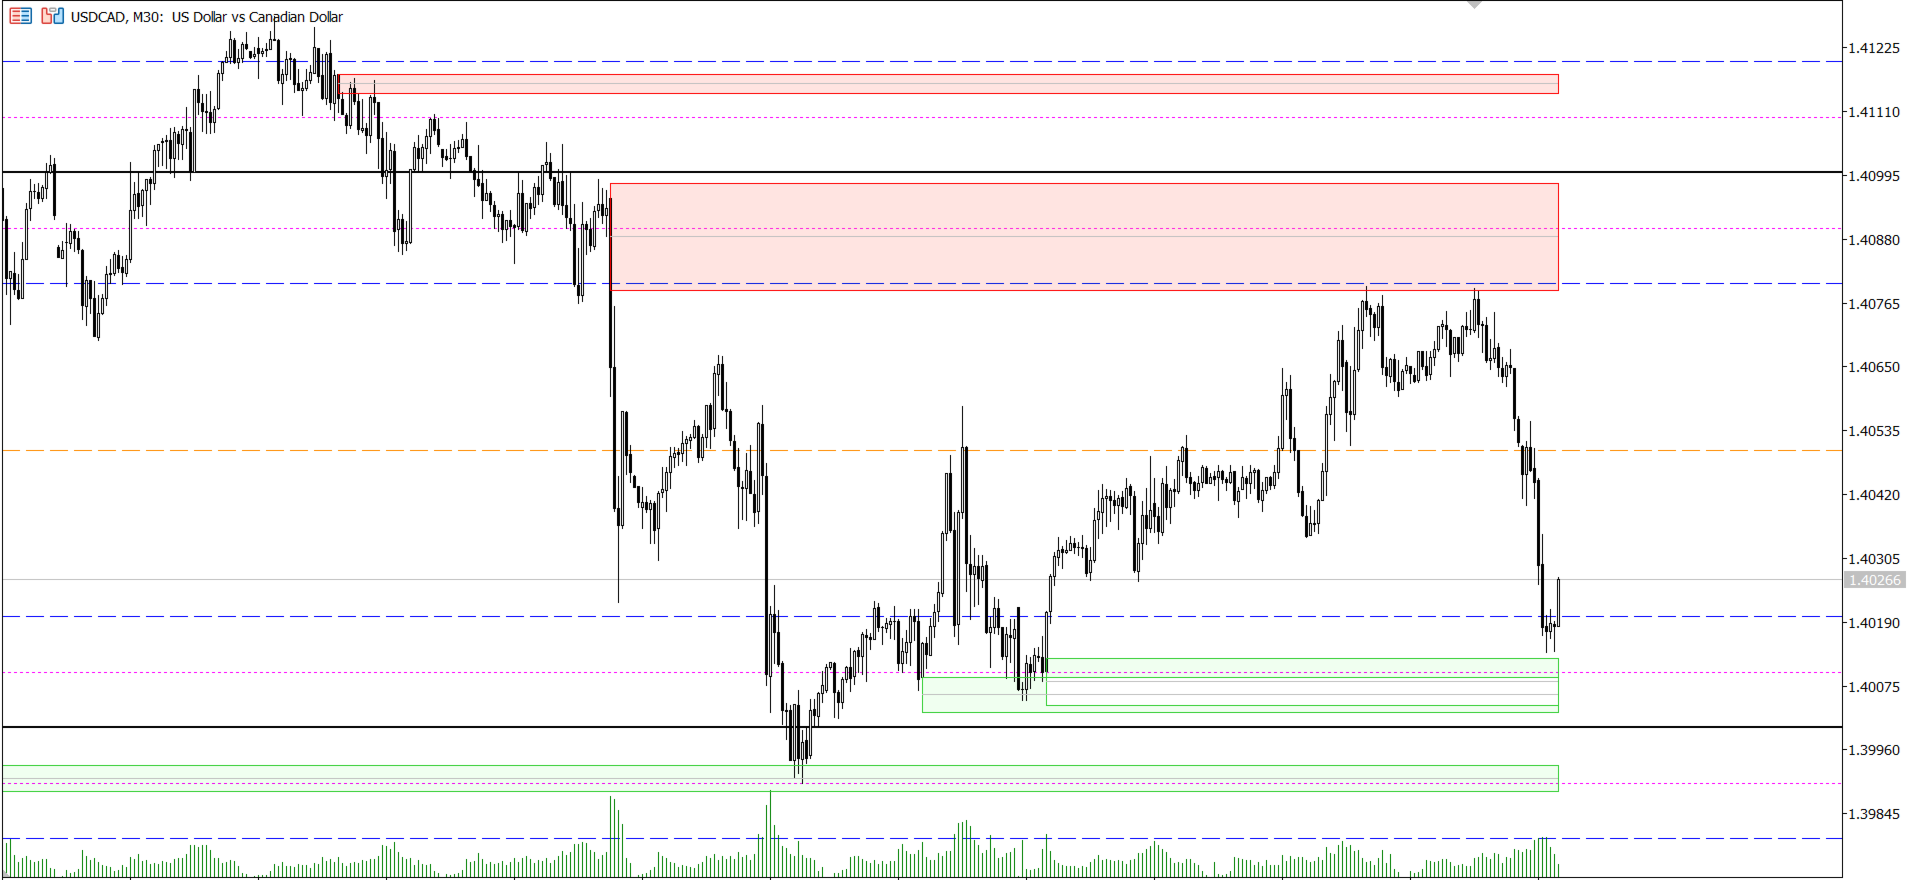
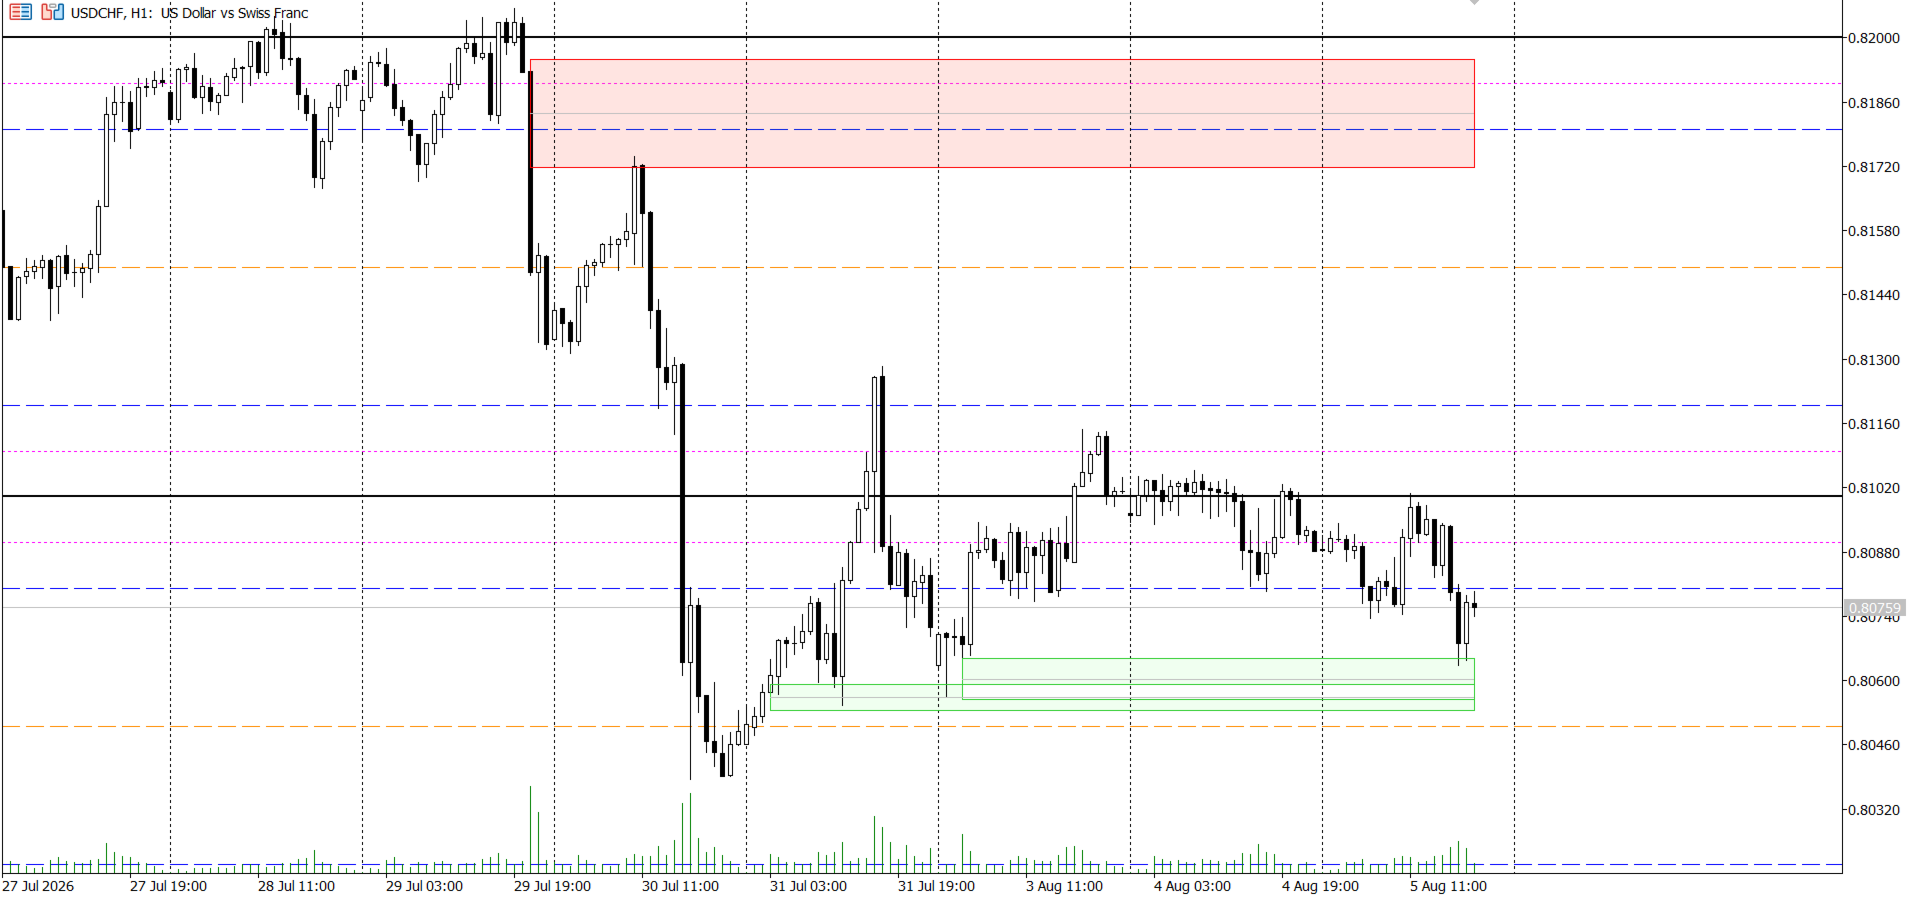
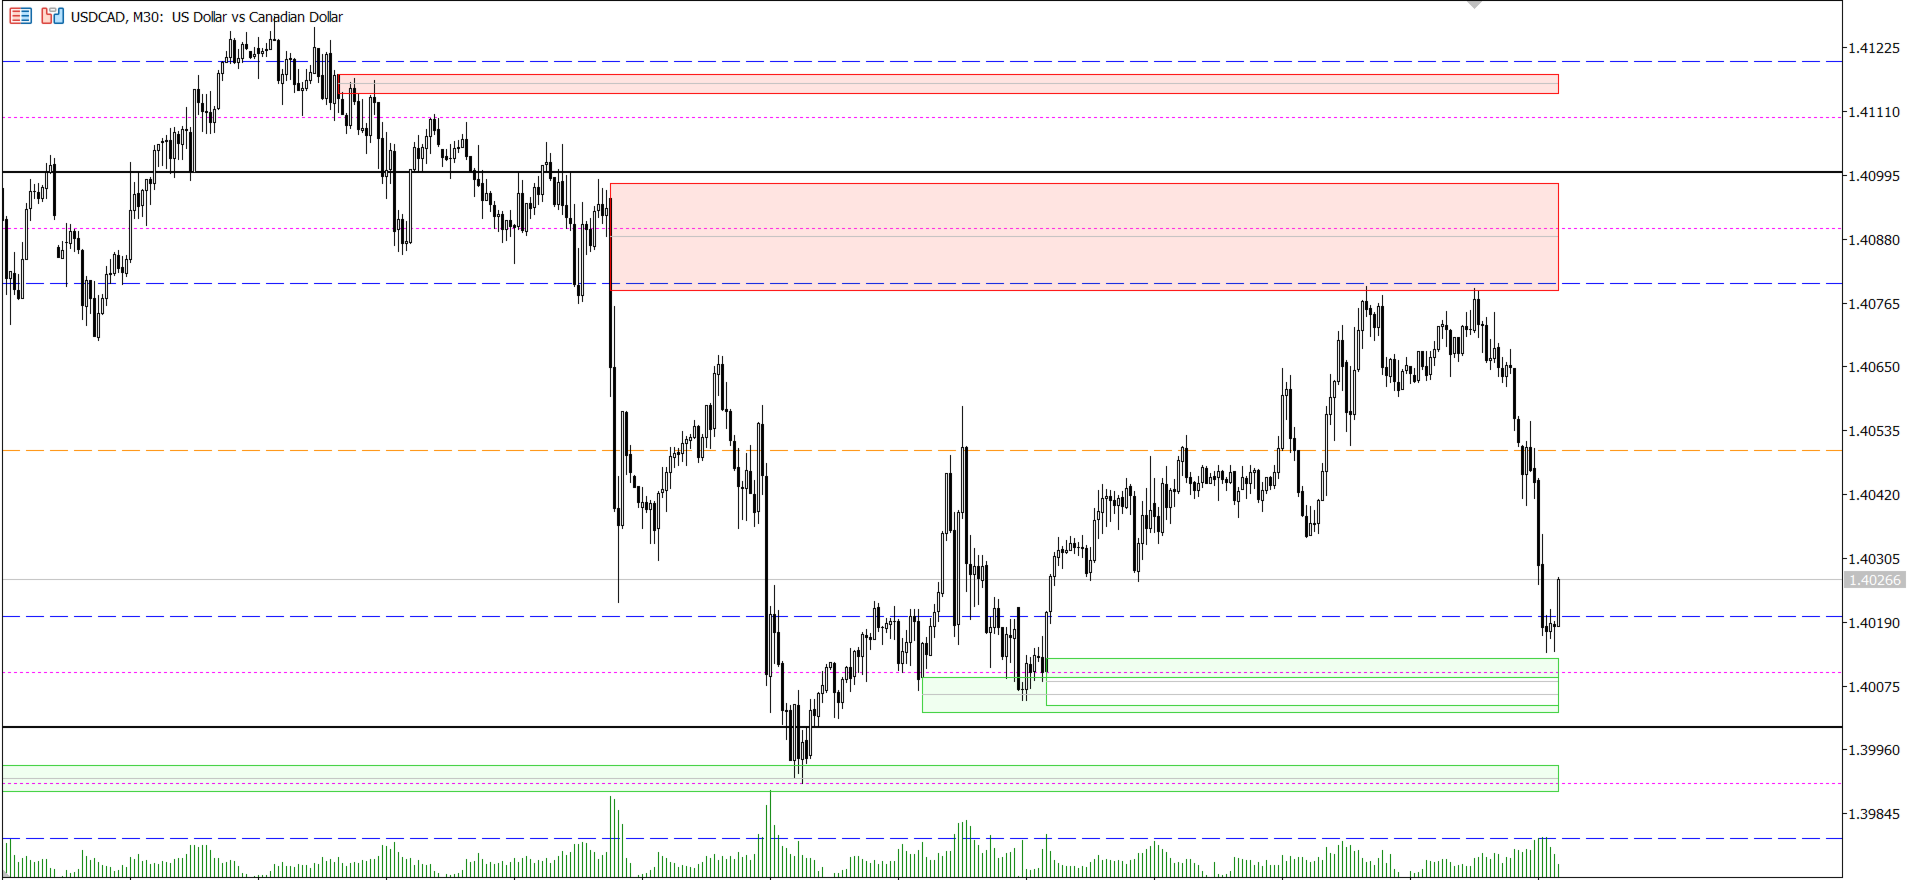
OrderBlockDetector locates institutional Order Blocks — the last opposing candle before a strong volume-driven move — using a volume-pivot algorithm instead of simple candle-pattern heuristics. Each detected block is drawn as a shaded zone with a border and a midline (average price), and is automatically removed the moment price mitigates it, so your chart always reflects the current, valid zones only.
The indicator is built for live trading: it updates in real time as the market moves and is engineered to place zero measurable load on your terminal even with a large lookback and a short refresh interval.
How it works
- On every confirmed bar close, the indicator scans the configured lookback window and finds volume pivots — bars whose volume is higher than every bar in a symmetric window around them.
- A volume pivot occurring while price structure is in a bullish state marks a bullish Order Block; the same pivot occurring in a bearish state marks a bearish Order Block.
- Each block is tracked until price "mitigates" it — closes or wicks through the block, depending on your chosen mitigation method — at which point it is automatically removed.
- Between bar closes, a lightweight real-time check keeps mitigation status current, so a block disappears the instant it's invalidated, without waiting for the next bar.
Key features
- Volume-pivot detection — identifies Order Blocks from genuine volume climaxes, not just candle shape.
- Two mitigation methods — Wick (high/low) or Close, selectable per your trading style.
- Zero flicker, zero lag — chart objects are created once and moved in place; nothing is deleted.
- Real-time mitigation tracking — a throttled background check invalidates blocks intrabar, without re-scanning your whole history.
- Configurable history depth — bound the recompute window ( InpLookbackBars ) to control how far back detection looks.
- Independent Bull/Bear controls — separate colors, border colors, average-line color, and how many recent blocks of each side are shown.
- Multi-instance safe — run two copies with different settings on the same chart without their drawings colliding.
- Optional alerts — get notified the moment a block forms or is mitigated.
- Works on any symbol/timeframe — including GBPUSD and other forex pairs, indices, and crypto.
Input parameters
| Group | Input | Description |
|---|---|---|
| Detection | Volume Pivot Length | Bars on each side used to confirm a volume pivot |
| Detection | Recompute lookback | How many bars back full detection scans (0 = full history) |
| Detection | Live mitigation check interval (ms) | How often the real-time mitigation check runs |
| Detection | Mitigation Method | Wick (high/low) or Close |
| Bullish OB | Count shown / colors | How many recent bullish blocks are drawn, and their styling |
| Bearish OB | Count shown / colors | How many recent bearish blocks are drawn, and their styling |
| Average Line | Style / width | Styling for the midline drawn through each block |
| Alerts | Enable Alerts | Popup alert when a block forms or is mitigated |
Recommended usage
Order Blocks are commonly used as areas of interest for entries, stop placement, or confluence with other Smart Money Concepts (liquidity sweeps, fair value gaps, market structure shifts). This indicator is a detection and visualization tool — combine it with your own risk management and entry rules.
Notes
- Uses tick volume by default ( CopyTickVolume ); if your broker's feed provides real volume, swap in CopyRealVolume inside Recompute() .
- Does not repaint confirmed detections; only the mitigation status of existing blocks updates in real time.
- No DLL calls, no external network access — fully sandboxed for MQL5 Market compliance.
OrderBlockDetector + PriceLevels LTF Strategy:
The round-number grid gives you where institutional interest clusters:
- .000 (Wall) = major decision point, expect rejection or a decisive break
- .100 / .900 (Trap) = stop-hunt / liquidity-grab zones just past the round number
- .200 / .800 (Hot Zone) = the zone institutions actually load positions in after the trap sweep
- .500 (Exit) = natural intraday take-profit / mean-reversion target
The Order Block Detector gives you confirmation that smart-money footprint (a volume-pivot OB) actually exists at that price, rather than trading the round number blind.
Setup sequence (M15, London or NY session)
- Map the grid. Note the nearest Wall above and below current price, and the Trap/Hot Zone levels around it.
- Wait for the sweep. Price pushes into a Trap zone ( .100 / .900 ) — this is the stop-hunt. Don't enter here.
- Confirm with an Order Block. After the sweep, watch for a bullish OB (for a long) or bearish OB (for a short) to form on the reversal leg, ideally with its top/bottom overlapping or sitting just inside the adjacent Hot Zone ( .200 / .800 ).
- Entry. Enter on a retest of the OB's average line (the midline the indicator plots), not the sweep candle itself — this avoids chasing the wick.
- Stop loss. Just beyond the OB's far edge (below btm for bullish, above top for bearish), which naturally sits just past the Trap level too — so one stop covers both invalidation conditions.
- Target. First target = Exit level ( .500 ); if momentum continues, trail to the next Wall ( .000 ). This keeps you at roughly 1:2+ RR.
Confluence filter (reduces false signals)
Only take the setup if the OB and the round-number zone are within roughly half the OB's own height of each other — an OB that's nowhere near a Hot Zone/Wall is a lower-conviction, standalone signal and should be sized down or skipped.
Disclaimer
For informational and analytical purposes only. Not financial advice. Past detection accuracy does not guarantee future results. Always test on a demo account before live use.