
Fibo Predictor
- インディケータ
- バージョン: 1.0

XBK AutoFibo Predictive
Short description (for search / listing)
Automatic Fibonacci that detects the swing for you, projects target zones, scores each level with a historical confluence percentage, and self-limits by timeframe — with proximity alerts and a built-in panel. Free.
Full description
XBK AutoFibo Predictive is a fully automatic Fibonacci indicator for MetaTrader 5: it detects the relevant swing, plots the retracement levels, and adds a predictive analysis layer on top (projections, time zones, historical statistics per level, and alerts) — so you don't have to draw or watch anything by hand.
Works on any symbol and any timeframe — forex, indices, or metals such as XAUUSD, where the XBK Systems team focuses its work.
Important: this is a technical analysis tool, not an automated trading system. It does not open, modify, or close trades — it only draws, calculates, and alerts. The decision to trade is always yours.
Automatic swing detection
The indicator scans the last N bars (55 by default, configurable) and locates the range's high and low. It determines the direction automatically based on which extreme is more recent:
- If the low is more recent → bearish leg → 0% at the low, 100% at the high (possible bounce).
- If the high is more recent → bullish leg → 0% at the high, 100% at the low (possible pullback).
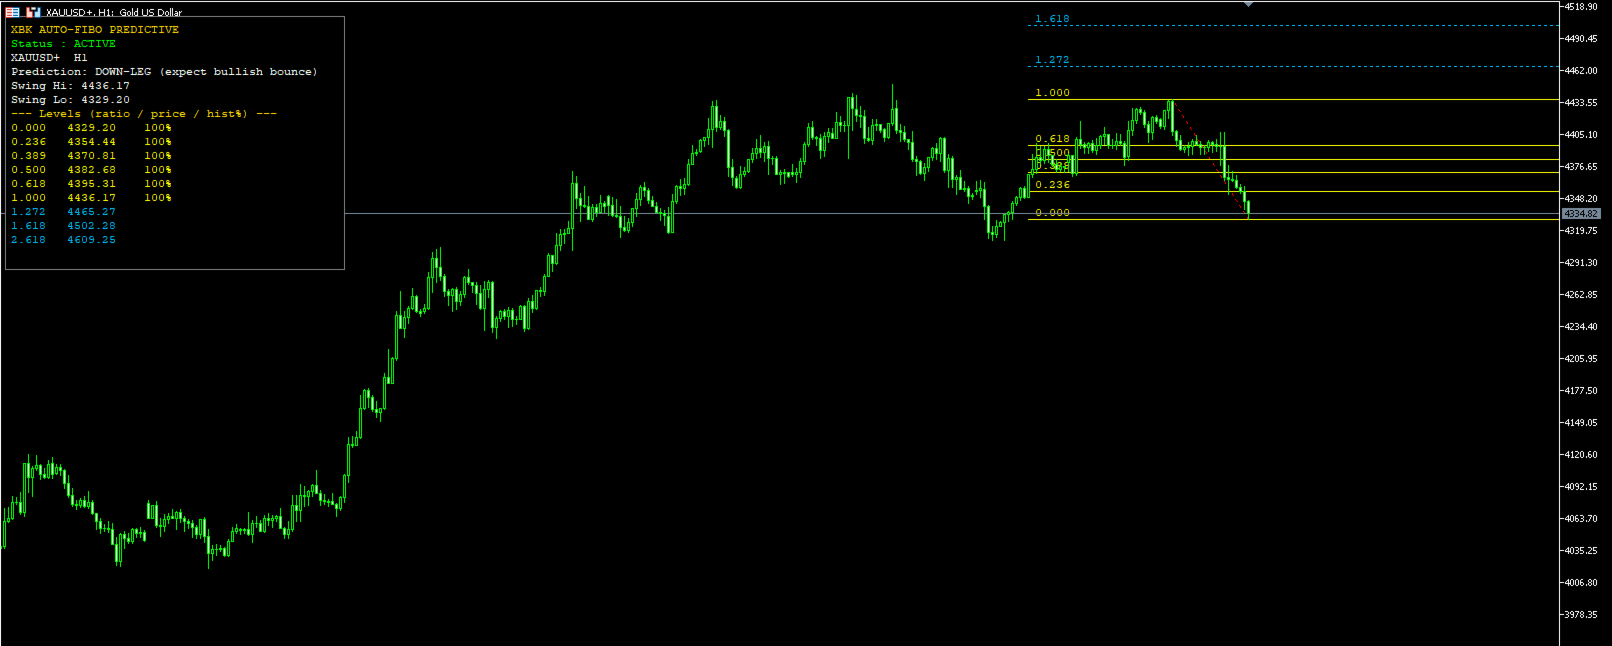
Retracement levels (0 / 0.236 / 0.389 / 0.5 / 0.618 / 1.0, fully editable) redraw themselves on every new bar — no manual intervention — and the lines no longer span the whole chart: they start exactly at the bar marking the edge of the scan window and extend toward current price, so historical data stays uncluttered.
Predictive system
Four independent modules, each one toggled separately:
1. Projections / extensions Levels beyond 100% (1.272, 1.618, 2.618 by default) marking possible target zones if price breaks the swing, plus optional negative extensions for the opposite scenario.
2. Fibonacci Time Zones Vertical lines in Fibonacci sequence projected from the start of the swing, flagging time windows where a turn is statistically more likely (off by default, one click to enable).
3. Historical confluence score For each base level, the indicator scans up to 500 bars of the symbol's own real history and calculates what percentage of the time price reacted by at least X points after touching that level. The result (0-100%) is shown next to each level in the panel. It's a statistic about past price behavior, not a guarantee of future behavior.
4. Proximity alerts Popup, push notification, or email alert (with a configurable cooldown between alerts) as soon as price approaches any active level, so you don't have to watch the chart constantly.
Timeframe operating filter
You can leave the indicator loaded on several charts at once and decide exactly which timeframes it should actually be active on (M1 through monthly, individual checkbox for each). Outside the allowed timeframes, the indicator disables itself — no drawing, no alerts — and shows this clearly in the panel.
Built-in panel
Courier New panel showing: status (active/inactive), symbol and timeframe, trend reading with its associated prediction (in English by default, with an option to show it in Spanish), the detected swing's high/low, and the full level table with price and historical score.
Automatic chart setup on load
When loaded, the indicator leaves the chart clean and ready to trade: hides the grid, hides the default tick volume, applies a left chart shift, and sets a comfortable zoom level. Every option can be disabled individually, and everything is automatically restored to how the chart was as soon as the indicator is removed.
Main parameters
| Group | Controls |
|---|---|
| Swing detection | Bars to scan, automatic rescan per bar |
| Fibonacci levels | Ratios, colors, line style, extension to the right |
| Projections | Positive/negative extension levels and their color |
| Time zones | Enable/disable, color |
| Historical confluence | History bars, touch tolerance, minimum reaction, validation bars |
| Alerts | Popup / Push / Email, alert distance, time between alerts |
| Timeframe filter | Enable filter and per-timeframe whitelist |
| Panel | Show/hide, position, size, font, colors |
| Chart | Hide grid/volume, chart shift, initial zoom |
Usage recommendations
- Works well out of the box with default settings from the first launch.
- If you trade multiple timeframes, set the filter's whitelist so the panel and alerts only work where you actually watch the market.
- The confluence score is more representative with more history available on the chart; on symbols with little history loaded, only raise InpConfluenceLookback if the terminal actually has enough data.
Important notice
This indicator is a technical-analysis support tool. Projections, time zones, and the confluence score are based on mathematical calculations and the historical price behavior of the symbol itself — they do not constitute financial advice and do not guarantee future results. All trading carries a risk of capital loss; always trade under your own judgment and risk management.
Developed by XBK Systems.
















































ユーザーは評価に対して何もコメントを残しませんでした