Titan NPC Pro
- インディケータ
- バージョン: 1.20
- アップデート済み: 10 5月 2026
- アクティベーション: 5

Titan NPC Pro - Makine Öğrenimi Olasılık Motoru
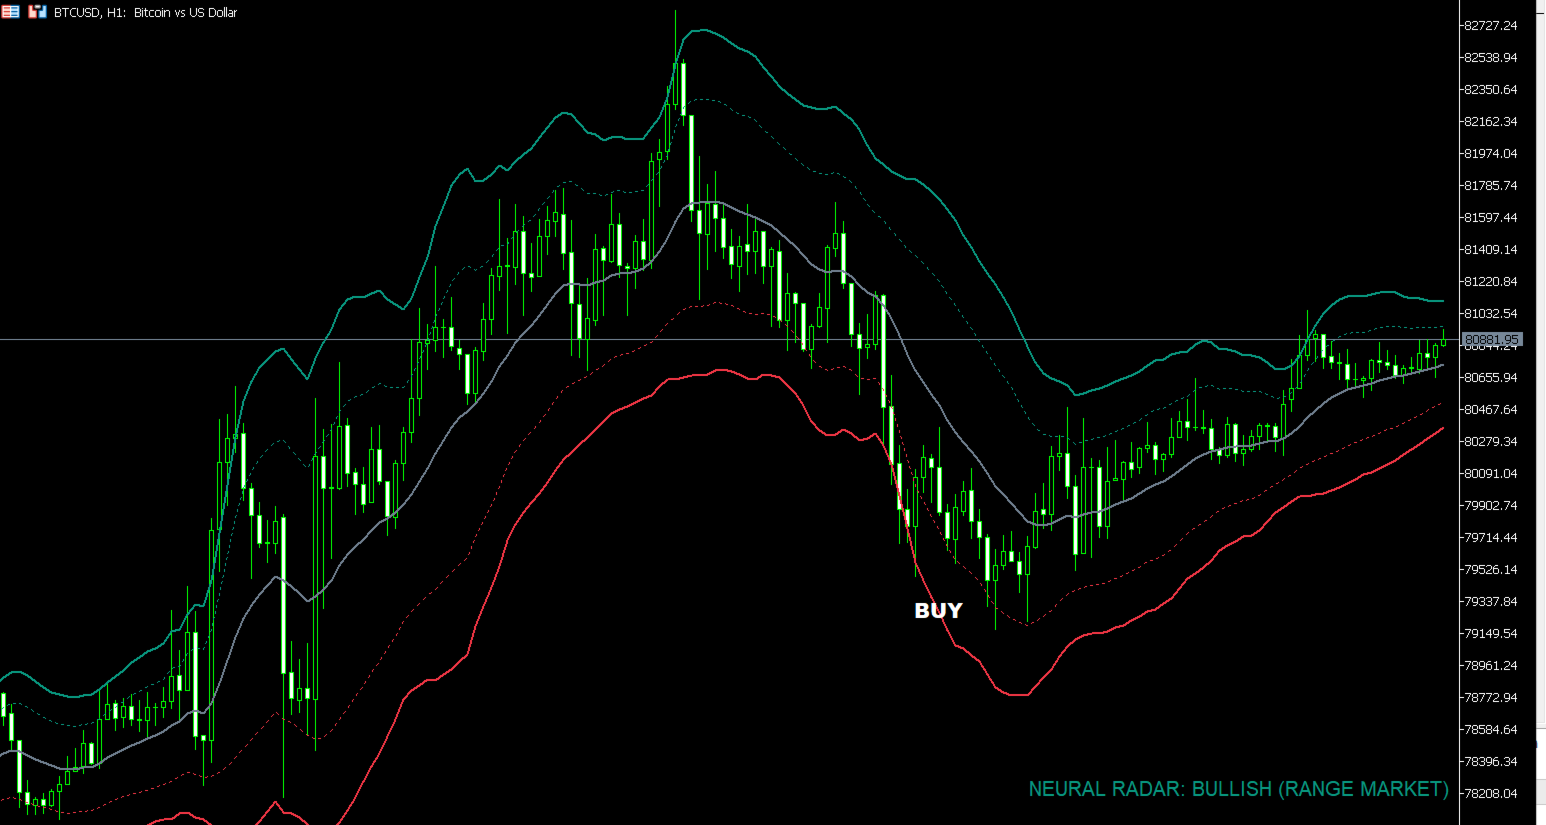
Titan NPC Pro, Çekirdek Regresyonu ve dinamik volatilite kanalları etrafında tasarlanmış gelişmiş bir analitik göstergedir. Yüksek olasılıklı ortalama-geri dönüş girişlerini tespit etmek ve özel, Smart Shield ADX Filtresi adlı özel bir filtreleme mekanizmasını uygulamak için tasarlanmıştır; bu filtre agresif piyasa koşullarında sermayeyi korur.
Temel Özellikler:
-
Sinirsel Temeli (Sıfır Gecikme): Rasyonel Quadratic Kernel Regression kullanılarak, bu modül geleneksel Hareketli Ortalamalara özgü doğal gecikme olmadan fiyatın denge "adil değerini" tanımlar.
-
Dinamik Volatilite Kanalları: Algoritma, Altın, Kripto Para veya Forex çiftlerinin özel volatilitesine otomatik olarak uyum sağlar; Ortalama Gerçek Aralık (ATR) ve Hata Toplamı metriklerine dayalı hibrit bir hesaplama yapar.
-
Smart Shield ADX Filtresi: Akıllı bir eğilim tespit modülü. Piyasa güçlü yönlü momentum gösterdiğinde, gösterge güçlü kırılmalara karşı işlem yapmaktan kaçınmak için ortalama geri dönüş sinyallerini filtreler.
-
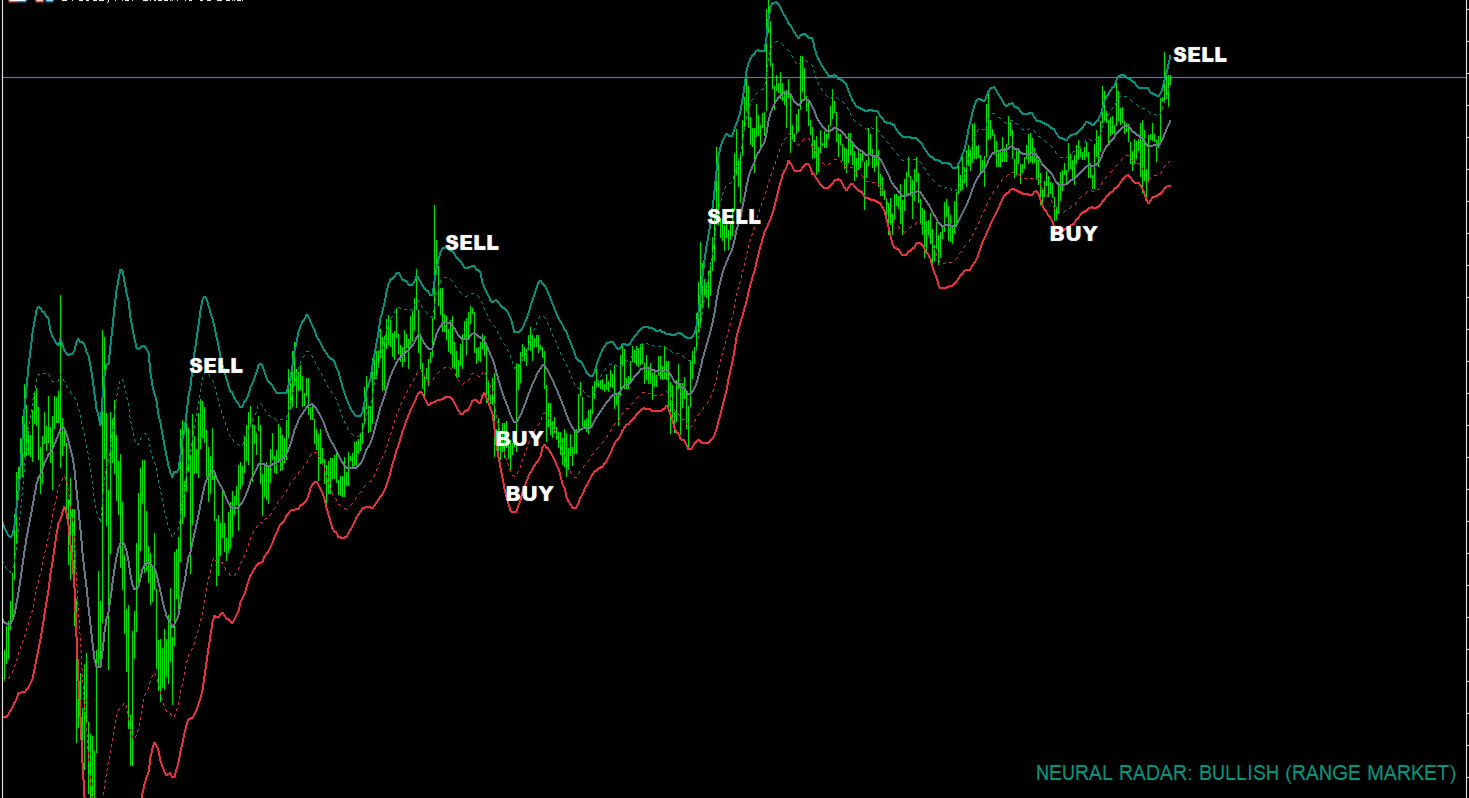
Yeniden Boyanmayan Uygulama: Sinyaller mum kapandığında kalıcı olarak kilitlenir. Bu, hassas manuel geriye test ve analiz için tarihsel tutarlılık sağlar.
Ticaret Mantığı ve Stratejisi:
Gösterge, İstatistiksel Uç Noktalar ve Ortalama Geri Dönüş ilkesi üzerinde çalışır:
-
Gezi: Fiyat, dış volatilite kanallarını delip geçer ve aşırı gerilmiş bir piyasa durumunu gösterir.
-
Onay: Fiyat tekrar kanal sınırları içinde kapanıyor ve bu da Sinir Temeline doğru potansiyel bir dönüş işareti verir.
-
Sinyal Üretimi: Grafikte net bir BUY veya SAT etiketi gösterilir.
-
Trend filtreleme: ADX değeri kullanıcı tarafından tanımlanan eşiği aşarsa, sinyal otomatik olarak bastırılır ve güçlü trendler sırasında düşük risk profilini korumak sağlanır.
Önerilen Konfigürasyonlar:
-
XAUUSD (Altın): M15 veya H1 Zaman Dilimleri / Önerilen ADX Filtresi: 30.0 (Dengeli)
-
BTCUSD (Kripto): M15 Zaman Aralığı / Önerilen ADX Filtresi: 25.0 (Kesin)
-
FX Bölümleri: M15, H1 veya H4 Zaman Aralıkları / Önerilen ADX Filtresi: 35.0 (Esnek)
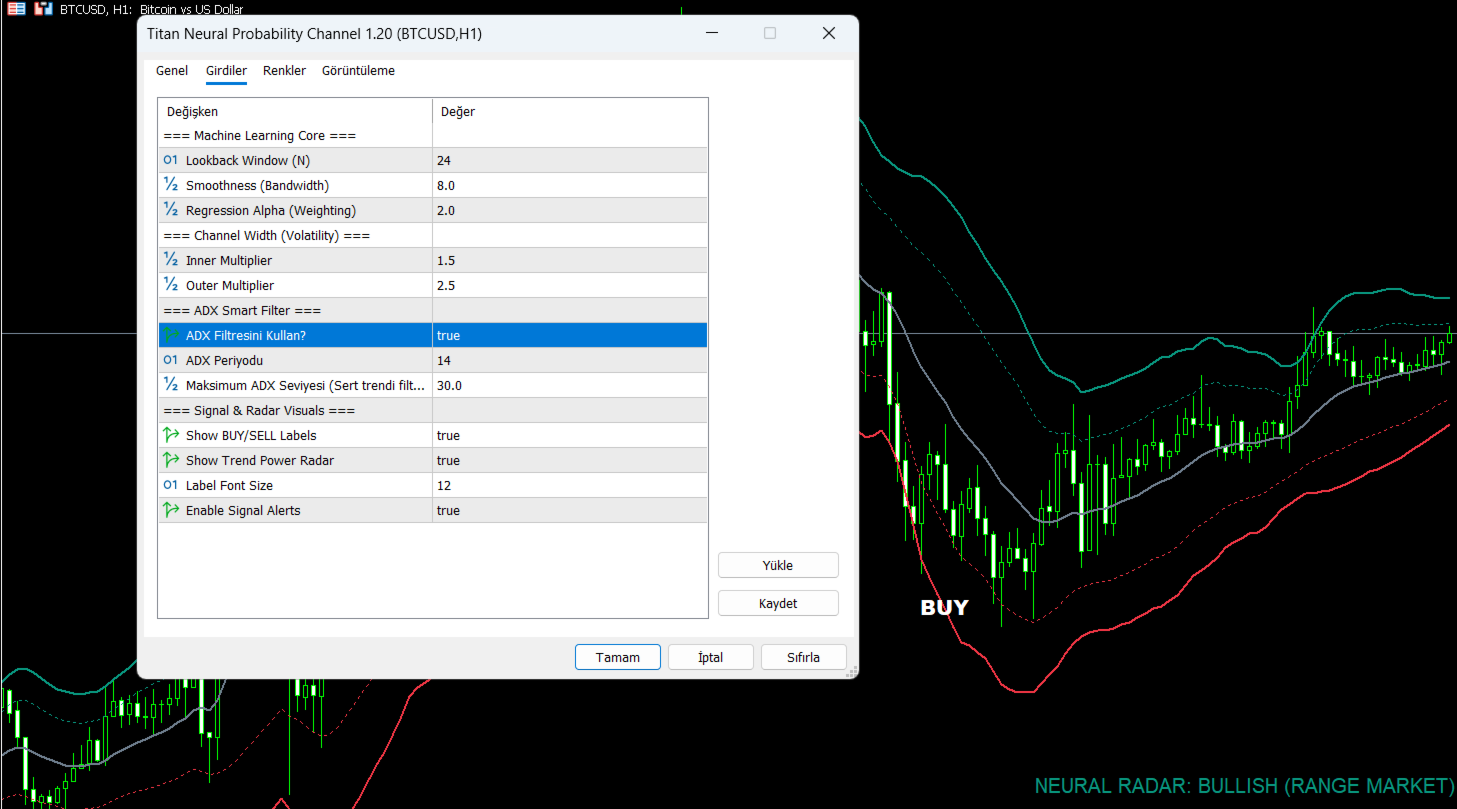
Ana Giriş Parametreleri:
-
Geri Bakış Penceresi: Sinir çekirdeği hesaplama süresini tanımlar.
-
Çarpanlar: Volatilite kanallarının genişliğini belirli risk profillerine uyacak şekilde ayarlar.
-
ADX Filtresi Kullanın: Smart Shield trend filtresini etkinleştirir veya devre dışı bırakır.
-
ADX Seviyesi: Güçlü piyasa genişlemesi sırasında karşı trend sinyallerini durdurma eşiğini belirler.
-
Uyarılar: Terminal, Push ve E-posta bildirimlerini destekler.