Native Depth Viewer

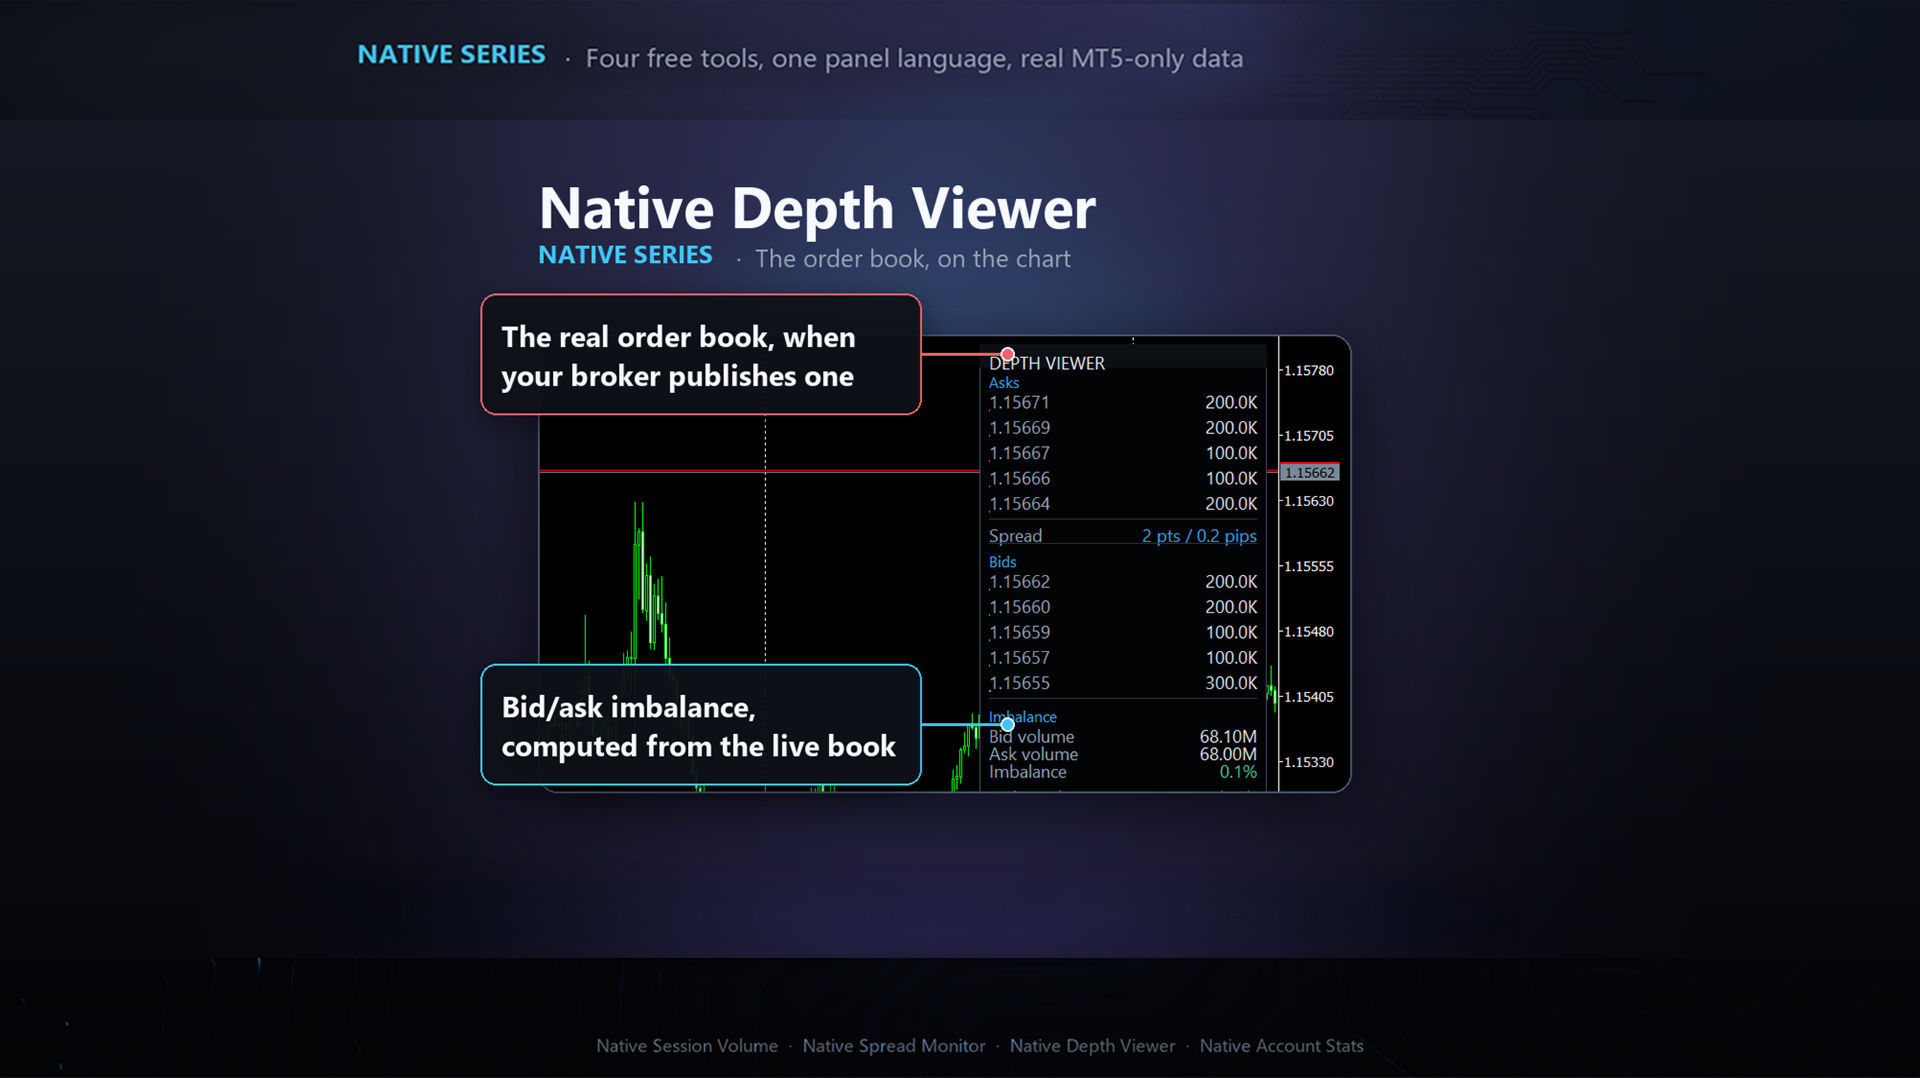
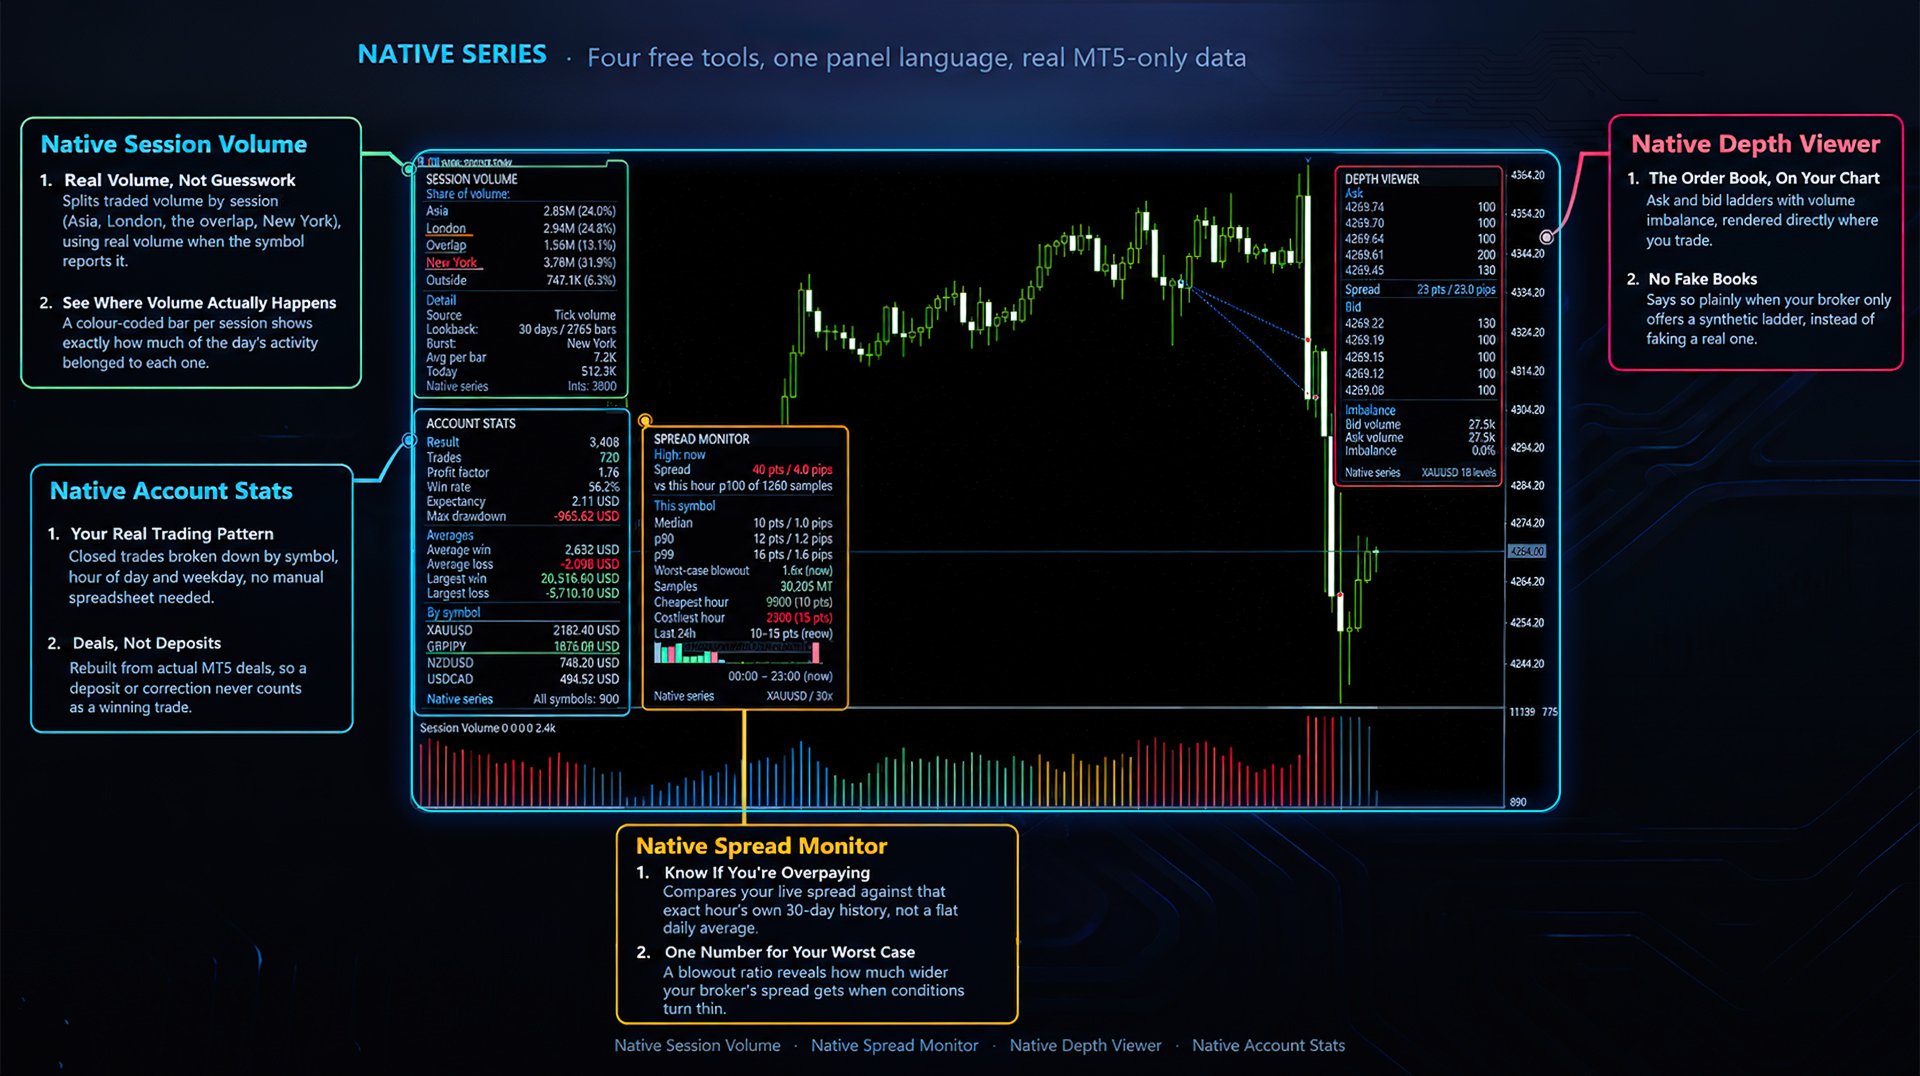
Native Depth Viewer renders the order book of the current symbol directly on the chart: ask ladder, bid ladder, spread, and bid/ask volume imbalance. MarketBookAdd, OnBookEvent and MarketBookGet, the functions this indicator is built on, have no equivalent in MQL4. This reading is native to MetaTrader 5 only.

WHAT IT SHOWS

When your broker does publish a real book for the symbol:
  • Ask ladder (sell side), worst price first, reading top-down like a real DOM
  • Bid ladder (buy side), best price first
  • Current spread, in points and pips, computed from the book's own best bid/ask
  • Bid volume, ask volume, and the imbalance between them as a percentage
When it does not:
  • A plain status panel stating there is no book data, the reason, and that this is a broker feed limitation, not a setting to fix in the tool

WHY THIS IS NOT AVAILABLE ON MT4

MQL4 never had an order book API of any kind. MetaTrader 5's MarketBookAdd subscribes to the book, OnBookEvent fires when it updates, MarketBookGet reads it. None of that exists in the MQL4 language. A tool like this could only ever be built on MT5.

HOW TO READ IT

A wide, one-sided ladder (far more resting size on bids than asks, or the reverse) can signal near-term pressure in that direction. A near-zero imbalance with tight levels on both sides usually means a calm, liquid moment. None of this replaces your own judgment, it is raw information, not a signal to act on automatically.

WHAT IT DOES NOT DO
This tool never places, modifies or closes an order. It is read only. It also never invents a ladder: if the broker sends nothing, or stops sending updates, the panel falls back to the no-data message instead of freezing on a stale, misleading picture.

REQUIREMENTS
  • Works on any symbol, any timeframe (the book is symbol-wide, not tied to a chart period)
  • Your broker's server must actually stream a multi-level book for the symbol you attach this to. Check this first: open the symbol in Market Watch, right-click, Depth of Market. If the "Trade" volume column is empty for every row, your broker is not publishing real depth for that symbol, and no tool, including this one, can show what was never sent.

INPUTS
  • Panel theme (Auto / Dark / Light), panel corner, panel X/Y offset
  • Book levels per side (default 5)
  • Seconds to wait before reporting no data, and to detect a feed that has gone quiet after previously working

PART OF THE NATIVE SERIES

Four free tools that surface data MetaTrader 5 already has but does not show:

All four are free, read only, and share the same panel.


DISCLAIMER: depth of market is published by your broker, not by this tool. Most retail forex brokers do not publish a real book, only a synthetic bid/ask ladder for one-click trading. Check Market Watch > Depth of Market for this symbol first: an empty Trade/volume column means your broker sends none. This panel says so plainly, instead of faking a ladder.
おすすめのプロダクト
Value Chart Candlesticks
Flavio Javier Jarabeck
4.57 (14)
The idea of a Value Chart indicator was presented in the very good book I read back in 2020 , " Dynamic Trading Indicators: Winning with Value Charts and Price Action Profile ", from the authors Mark Helweg and David Stendahl. The idea is simple and the result is pure genius: Present candlestick Price analysis in a detrended way! HOW TO READ THIS INDICATOR Look for Overbought and Oversold levels. Of course, you will need to test the settings a lot to find the "correct" one for your approach. It
FREE
MACD Enhanced
Nikita Berdnikov
4 (4)
Introducing the MACD  Enhanced – an advanced MACD (Moving Average Convergence Divergence) indicator that provides traders with extended capabilities for trend and momentum analysis in financial markets. The indicator uses the difference between the fast and slow exponential moving averages to determine momentum, direction, and strength of the trend, creating clear visual signals for potential entry and exit points. Attention! To achieve the best results, it is recommended to adapt the indicator
FREE
PROMETHEUS TECHNICAN VERSION Free | By THE SONS A gift from The Sons — no strings, no trial, no expiry. Every trader deserves access to professional-grade market intelligence. That belief is why Prometheus Technical Version exists, and why it costs nothing. Consider it our handshake to the trading community. What You're Getting This is not a simplified tool dressed up as a gift. Prometheus Technican Version is a fully built, institutional-quality technical analysis indicator running a dual-model
FREE
QuantMatrix Candle Patterns is a free MetaTrader 5 indicator designed to identify classic candlestick formations directly on the chart. The indicator analyzes completed candles and detects recognized bullish, bearish and neutral price-action patterns. When a valid bullish or bearish formation is confirmed, the corresponding BUY or SELL signal is displayed on the following candle . This means the signal is only generated after the source pattern has been completed. The indicator also displays a c
FREE
概要 このインジケーターは、クラシックな ドンチャンチャネル を強化したバージョンで、実践的なトレード機能を追加しています。 標準の3本線(上限、下限、中央線)に加え、 ブレイクアウト を検出し、チャート上に矢印で視覚的に表示します。また、チャートを見やすくするために、 現在のトレンド方向と逆側のラインのみを表示 します。 インジケーターの機能: 視覚的シグナル :ブレイクアウト時にカラフルな矢印を表示 自動通知 :ポップアップ、プッシュ通知、Eメール RSIフィルター :市場の相対的な強弱に基づいてシグナルを検証 カスタマイズ可能 :色、ラインの太さ、矢印コード、RSI閾値など 動作原理 ドンチャンチャネルは次のように計算します: 上限線 :直近N本のクローズ済みローソク足の最高値 下限線 :直近N本のクローズ済みローソク足の最安値 中央線 :最高値と最安値の平均値 上方ブレイクアウト は終値が上限線を超えたときに発生し、 下方ブレイクアウト は終値が下限線を下回ったときに発生します。 インジケーターは以下を行います: 3本のドンチャンラインを描画 方向転換後の最初のブレイクアウト
FREE
Description. The basis for the formation of the Renko chart is the price range. If the price goes beyond its limits, the chart shows a box above or below the previous one. As a result, we see price movement without additional "noise" and important support and resistance levels. Features. For use in conjunction with the Expert Advisor, an additional buffer is implemented-a box counter. For convenience and to increase the speed of testing, the user can use the "new box" event, which the indicator

FREE
Stackable VWAP
Flavio Javier Jarabeck
3.5 (4)
Volume Weighted Average Price (VWAP) is a trading benchmark commonly used by Big Players that gives the average price a Symbol has traded throughout the day. It is based on both Volume and price. Additionally we put in this indicator the MVWAP (Moving Volume Weighted Average Price). For those who do not know the usage and the importance od this indicator I recommend a great article about this subject at Investopedia ( https://www.investopedia.com/articles/trading/11/trading-with-vwap-mvwap.asp
FREE
MIDAS Super VWAP
Flavio Javier Jarabeck
4.27 (11)
Imagine VWAP, MVWAP and MIDAS in one place... Well, you found it! Now you can track the movement of Big Players in various ways, as they in general pursue the benchmarks related to this measuring, gauging if they had good execution or poor execution on their orders. Traders and analysts use the VWAP to eliminate the noise that occurs throughout the day, so they can measure what prices buyers and sellers are really trading. VWAP gives traders insight into how a stock trades for that day and deter
FREE
RSI abcd
Francisco Gomes Da Silva
4.33 (3)
RSI ABCDパターンファインダー:テクニカル戦略 1. インジケーターの仕組み 古典的RSI と ABCD調和パターン の自動検出を組み合わせたものです。 主要コンポーネント 標準RSI (調整可能な期間) 高値・安値マーカー (矢印) ABCDパターン (緑/赤の線) 過買(70)・過売(30)フィルター 2. MT5設定 period = 14 ; // RSI期間 size = 4 ; // 最大パターンサイズ OverBought = 70 ; // 過買水準 OverSold = 30 ; // 過売水準 Filter = USE_FILTER_ YES ; // 確認フィルター 3. 取引戦略 3.1. 買いエントリー(強気ABCD) 条件: RSIが以下を形成: 谷( A )→ 山( B )→ より高い谷( C ) D が過売域(30)より上だが C より下 確認:A-B-C-Dを結ぶ緑色の線 目標: TP1: B-Cの61.8% TP2: B-Cの100% ストップロス: D より下 3.2. 売りエントリー(弱気ABCD) 条件: RSIが以下を形成: 山( A
FREE
VWAP and MVWAP
Flavio Javier Jarabeck
4 (9)
Volume Weighted Average Price (VWAP) is a trading benchmark commonly used by Big Players that gives the average price a Symbol has traded throughout the day. It is based on both Volume and price. Additionally we put in this indicator the MVWAP (Moving Volume Weighted Average Price). For those who do not know the usage and the importance od this indicator I recommend a great article about this subject at Investopedia ( https://www.investopedia.com/articles/trading/11/trading-with-vwap-mvwap.asp )
FREE
Daily Support and Resistance Levels は、クラシックピボットポイント手法に基づき、日中取引用の重要な価格レベルを自動計算・表示するプロ仕様のインジケーターです。 主な機能: ピボットポイント(PP)の自動計算 3つのレジスタンスレベル(R1, R2, R3) 3つのサポートレベル(S1, S2, S3) 前日の高値/安値の表示 リアルタイム情報パネル 市場バイアス(強気/弱気)表示 近いレベルまでの距離表示 色と表示設定の完全カスタマイズ 毎日自動更新 全タイムフレーム対応 計算方法: 前日の高値、安値、終値に基づくクラシックピボットポイント。 トレード活用例: サポート/レジスタンス反発トレード ブレイクアウト戦略 レンジトレード 方向性バイアス判断 利確目標設定 使用方法: 任意のチャートに追加 レベルは自動計算 価格 > PP = 強気バイアス 価格 < PP = 弱気バイアス S1-S3 = サポートゾーン R1-R3 = レジスタンスゾーン 設定: ピボット/サポート/レジスタンス色 線幅/スタイル 価格ラベル表示ON/OFF 情報パネル表示
FREE
Donchian Channel is an indicator created by Richard Donchian. It is formed by taking the highest high and the lowest low of the last specified period in candles. The area between high and low is the channel for the chosen period. Its configuration is simple. It is possible to have the average between the upper and lower lines, plus you have alerts when price hits one side. If you have any questions or find any bugs, please contact me. Enjoy!
FREE
Free automatic Fibonacci is an indicator that automatically plots a Fibonacci retracement based on the number of bars you select on the BarsToScan setting in the indicator. The Fibonacci is automatically updated in real time as new highest and lowest values appears amongst the selected bars. You can select which level values to be displayed in the indicator settings. You can also select the color of the levels thus enabling the trader to be able to attach the indicator several times with differe
FREE
Weis Waves
Flavio Javier Jarabeck
2.83 (18)
The original author is David Weis, an expert in the Wyckoff Method. The Weis Wave is a modern adaptation of the 1930's Wyckoff Method, another expert in Tape Reading techniques and Chart Analysis. Weis Waves takes market volume and stacks it into waves according to price conditions giving the trader valuable insights about the market conditions. If you want to learn more about this subject you can find tons of videos in YouTube. Just look for "The Wickoff Method", "Weis Wave" and "Volume Spread
FREE
This indicator marks the 50% mark of each candle. It will help you make profitable scalping trades. If the next candle opens above the 50% mark of the previous candle, you should open a BUY position, and if the next candle opens below the 50% mark of the previous candle, you should open a SELL position. This strategy is very profitable. To make the most of it, keep an eye on the candle contexts on the left. Good luck!
FREE
Tabajara V5
Flavio Javier Jarabeck
4.84 (37)
Metatrader 5 version of the famous Andre Machado's Tabajara indicator. If you don't know Andre Machado's Technical Analysis work you don't need this indicator... For those who need it and for those several friend traders who asked this porting from other platforms, here it is... FEATURES 8-period Moving Average 20-period Moving Average 50-period Moving Average 200-period Moving Average Colored candles according to the inflexion of the 20-period MA SETTINGS You can change the Period of all MA's
FREE
Girassol Sunflower MT5 Indicator
Saullo De Oliveira Pacheco
3.86 (7)
This is the famous Sunflower indicator for Metatrader5. This indicator marks possible tops and bottoms on price charts. The indicator identifies tops and bottoms in the asset's price history, keep in mind that the current sunflower of the last candle repaints, as it is not possible to identify a top until the market reverses and it is also not possible to identify a bottom without the market stop falling and start rising. If you are looking for a professional programmer for Metatrader5, please
FREE
Wave Box Market Frenquency
Jean Jacques Huve Ribeiro
4.75 (4)
Totally linked to the result of a movement and the duration he had. Its height records how many ticks the asset walked during a given movement, its width shows us the duration that movement had. Its configuration must be in line with the Weis Wave Indicator configuration to observe the movement force and can indicate a possible accumulation or distribution of the movement;
FREE
Ict market structure signals
Botsalo Martin Letlhoagoje
5 (4)
SMC Signals  (BOS/CHoCH + ADR TP/SL Zones)  SMC Signals  is a free Smart Money Concepts (SMC) market structure indicator for MetaTrader 5 that automatically detects: BOS (Break of Structure) CHoCH (Change of Character) Swing High / Swing Low pivots Trade entry levels and projected targets The indicator also calculates ADR(10) (Average Daily Range) and automatically plots: Entry level Stop Loss (SL) Take Profit 1 (TP1) Take Profit 2 (TP2) A built-in dashboard displays live performance statistic
FREE
FX Clock
Abderrahmane Benali
FXClock – Professional Clock Indicator for Traders Please leave a 5 star rating if you like this free tool! Thank you so much :) The FXClock indicator is a practical and simple tool that displays time directly on your trading platform, allowing you to track multiple key pieces of information at the same time. It is specially designed to help traders synchronize their trading with market hours and global sessions. Key Features: Displays the broker server time with precision. Displays your local c
FREE
Phoenix Delta Volume
Nigel Nii Darku Narnor Darko
5 (1)
This is the Phoenix Institutional SMC Dashboard (Emerald-Teal Edition). It is engineered to provide retail traders with the same "Volume-at-Price" clarity used by institutional desks. Below is a full breakdown of the benefits, the high-confluence logic for entries, and how to manage your trades using the current visual engine. Strategic Benefits to the User Sentiment over Price: Most indicators only look at where the price is. This dashboard tells you how much effort (Volume Delta) was required
FREE
Trade Behavior Mirror は、自分の口座の確定した取引履歴だけを読み、「損失が確定した直後に、自分のふだんの水準より大きいロットで新規ポジションを開いた」というパターンを1つだけ数えるツールです。予測も助言もしません。パネルに出るのは、すでにこの口座で起きたことの実測値だけです。 数字の作り方: 全銘柄・全マジック番号を対象に、最大31日分の確定した約定を読み込みます(チャートの銘柄に限らない、口座全体の集計です)。当日より前の30日間から、1日あたりの新規エントリー件数の中央値と、そのエントリーのロットの中央値を求めます。平均ではなく中央値を使うのは、1件だけ大きな取引があっても基準値全体が引きずられないようにするためです。その30日間のエントリーが5件に満たない場合は、十分な標本が無いということなので、無理に数字を出さず「Collecting history」と表示します。 核となる集計(画面では Entries within 10min of a loss, at above-median lot: の行): 新しいエントリーのたびに、その直前10分以内に損
FREE
価格波形パターン MT5へようこそ --(ABCD パターン)-- ABCD パターンは、テクニカル分析の世界で強力で広く使用されている取引パターンです。 これは、トレーダーが市場での潜在的な売買機会を特定するために使用する調和的な価格パターンです。 ABCD パターンを使用すると、トレーダーは潜在的な価格変動を予測し、いつ取引を開始および終了するかについて十分な情報に基づいた決定を下すことができます。 EA バージョン:     Price Wave   EA MT5 MT4バージョン:   Price Wave Pattern MT4 特徴 :  ABCDパターンの自動検出。 強気パターンと弱気パターン。  任意のシンボルと任意の時間枠で機能します。 主要なレベルと価格目標。 カスタマイズ可能な設定と繊維レベルの調整。 アラートと通知。 今後  さらに多くの 機能が追加される  予定です 。
FREE
QuantMatrix Volatility Regime QuantMatrix Volatility Regime is a technical indicator for MetaTrader 5 that evaluates the current volatility of the selected symbol and timeframe. The indicator uses Average True Range (ATR) to compare current volatility with a historical baseline calculated from previous bars. Based on this comparison, the current market condition is classified into one of four volatility regimes: LOW – current volatility is below the historical baseline. NORMAL – current volatil
FREE
MetaTrader 5 (MT5) 用の Wormhole 時間枠インジケーターは、ただの取引ツールではありません。それは、金融市場での競争優位性です。初心者とプロのトレーダーの両方を念頭に設計された Wormhole は、データの分析方法と意思決定を変革し、常に一歩先を行くことを保証します。 なぜ Wormhole インジケーター(無料)が必要なのか 競争に勝つ: 同じチャート上で 2 つの時間枠を同時に表示できるということは、常に一歩先を行けることを意味します。チャートを切り替える必要はなく、必要な情報はすべて目の前にあります。 隠れたチャンスを発見する: 従来の時間枠を変更し、他のトレーダーが見逃すパターンを発見します。5 分間のチャートの範囲を 00:01 から 00:06 に変更して、標準の 00:00 から 00:05 の代わりに分析することができます。これらの微細な変更は、市場の独特なダイナミクスを明らかにする可能性があります。 実行可能な洞察を得る: トレンド、反転、サポート/レジスタンスレベルを検出するための精密なツールを使用することで、Wormhole は自信を持
FREE
The Weis Waves RSJ Indicator sums up volumes in each wave. This is how we receive a bar chart of cumulative volumes of alternating waves. Namely the cumulative volume makes the Weis wave charts unique. It allows comparing the relation of the wave sequence characteristics, such as correspondence of the applied force (expressed in the volume) and received result (the price progress). If you still have questions, please contact me by direct message:  https://www.mql5.com/en/users/robsjunqueira/
FREE
Risk Calculator EA – Utility for Precise Trade Sizing If you find this tool useful consider to  Buy me a coffee!   The Ultimate Risk Calculator is a lightweight in-chart Expert Advisor (EA) designed to help you easily and quickly calculate position size and set stop-loss / take-profit levels with full control over risk management directly on the chart. What it does? It turns manual risk decisions into fast, visual, and accurate calculations. You draw or adjust the Entry, Stop-Loss and Take-P
FREE
VolumeBasedColorsBars — Free Powerful Volume Analysis for All Traders Unlock the hidden story behind every price bar! VolumeBasedColorsBars is a professional-grade, 100% FREE indicator that colorizes your chart candles based on real, adaptive volume analysis. Instantly spot surges in market activity, identify exhaustion, and catch the moves that matter. This indicator gives you:    • Dynamic color-coded bars for instant volume context    • Adaptive thresholds based on historical, session-awar
FREE
Cybertrade Keltner Channels - MT5 Created by Chester Keltner, this is a volatility indicator used by technical analysis. It is possible to follow the trend of financial asset prices and generate support and resistance patterns. In addition, envelopes are a way of tracking volatility in order to identify opportunities to buy and sell these assets. It works on periods longer than the period visible on the chart. All values ​​are available in the form of buffers to simplify possible automations.
FREE
Weis Waves(ワイス・ウェーブ) は、デビッド・ワイスが開発し、リチャード・ワイコフの理論に基づいたテクニカル指標です。 従来の出来高がバーごとに表示されるのとは異なり、Weis Waves は出来高を上昇または下降の「波」として蓄積し、価格の方向が変わると新しいカウントを開始します。 この方法により、トレーダーは市場の動きの 本当の強さ を明確に把握することができます。 主な特徴: 出来高を買いと売りの波にまとめる。 支配的な圧力(買い手または売り手)を強調。 トレンドの継続 または 反転の可能性 を識別。 ワイコフ理論に基づき、出来高・フロー分析で広く使用される。 Weis Waves は、価格と出来高のバランスを評価するために、多くのプロトレーダーによって利用され、市場ダイナミクスの詳細な視点を提供します。
FREE
このプロダクトを購入した人は以下も購入しています
Trade Assistant MT5
Evgeniy Kravchenko
4.43 (216)
取引 ごとのリスクの 計算、新規注文 の 簡単 な 設置、部分的 な 決済機能 を 持 つ 注文管理、 7 種類 のトレーリングストップなど 、便利 な 機能 を 備 えています 。 追加の資料と説明書 インストール手順   -   アプリケーションの手順   -   デモアカウント用アプリケーションの試用版 ライン機能 チャート上にオープニングライン、ストップロス、テイクプロフィットを表示します。この機能により、新規注文を簡単に設定することができ、注文を出す前にその特徴を確認することができます。   リスク計算 リスク計算機能は、設定されたリスクとストップロス注文のサイズを考慮して、新規注文のボリュームを計算します。ストップロスの大きさを自由に設定できると同時に、設定したリスクを守ることができます。 Lot calc ボタン - リスク 計算 を 有効 / 無効 にします 。 Risk フィールドでは 、必要 なリスクの 値 を 0 から 100 までのパーセンテージまたは 預金通貨 で 設定 します 。 設定」 タブで 、 リスク 計算 の 種類 を 選択 します :「 $ 通
Trade Manager EAへようこそ。これは、取引をより直感的、正確、そして効率的にするために設計された究極の リスク管理ツール です。これは単なるオーダー実行ツールではなく、包括的な取引計画、ポジション管理、リスク管理のためのソリューションです。初心者から上級者、迅速な実行を必要とするスキャルパーまで、Trade Manager EAはあらゆるニーズに対応し、為替、指数、商品、暗号通貨などさまざまな市場で柔軟に対応します。 Trade Manager EAを使用すると、複雑な計算が過去のものになります。市場を分析し、エントリーポイント、ストップロス、テイクプロフィットのレベルをチャート上のラインでマークし、リスクを設定するだけで、Trade Managerが最適なポジションサイズを即座に計算し、SLとTPをピップ、ポイント、口座通貨でリアルタイムに表示します。すべての取引が簡単かつ効果的に管理されます。 主な機能: ポジションサイズ計算機 :定義されたリスクに基づいて取引サイズを瞬時に決定します。 簡単な取引計画 :エントリー、ストップロス、テイクプロフィットを設定するためのド
日本語に対応しました。 Strategy Ledger Pro は、MetaTrader 5 用の読み取り専用の口座分析パネルです。口座の成績をエキスパートアドバイザー(EA)、戦略、銘柄、マジックナンバーごとに分け、それぞれが実際にどれだけ貢献しているかを明らかにします。 パネルは 11 言語に対応しています:English、Français、Deutsch、Español、Italiano、Português、Русский、Türkçe、中文、日本語、한국어。 デモをダウンロードする前に。 Market では、有料製品のデモはストラテジーテスター内でのみ実行されます。このパネルはご自身の口座の取引を分析しますが、ストラテジーテスターには読み取る口座履歴がないため、デモは空のパネルで起動し、その旨を表示します。これはデモの仕組みによるもので、製品の制限ではありません。 この説明内の動画では、実口座でのパネルの動作をご覧いただけます。 すべての機能を解説した詳しい マニュアル (英語)と、情報交換やお知らせのための AureusAI Trading Suite グループをご用意し
Local Trade Copier EA MT5
Juvenille Emperor Limited
4.94 (149)
Local Trade Copier EA MT5 は、同一の Windows PC または Windows VPS 上で稼働する複数の MetaTrader 5 口座間で、取引をコピーおよび管理するための高速で柔軟なトレードコピーツールです。 ローカルでの取引同期に加え、Receiver 側でロットサイズ、リスク管理、取引フィルター、シンボルマッピング、取引管理、口座保護を個別に設定できます。 Transmitter と Receiver のターミナルは約 1分 で設定でき、同一ブローカーまたは異なるブローカーの口座間で、手動取引や EA による取引をコピーできます。適切な条件下では、ローカルの MetaTrader ターミナル間で取引情報を 0.5秒未満 で同期できます。実際の約定速度は、ブローカーのレイテンシー、ネットワーク状況、PC/VPS の性能、ターミナルの負荷によって異なります。 ご購入前に無料デモをお試しください Local Trade Copier EA MT5 の完全機能版無料デモ を、MT5 デモ口座で 1回につき4時間 テストできます。 Local Trad
Telegram to MT5 Multi-Channel Copier   は、Telegram チャンネルのトレードシグナルを MetaTrader 5 へ自動コピーします。ボット不要、ブラウザ拡張不要、手動コピー不要。Telegram にシグナルが届くと、EA が数秒であなたのターミナルに注文を出します。 さらに、チャンネルをコピーする前に、内蔵バックテスターでそのチャンネルがあなたの口座でどう動いたかを確認できます。 製品は 2 つのコンポーネントで構成されます:Telegram チャンネルを監視する Windows アプリと、MT5 ターミナルでシグナルを執行する本 EA です。MT4 版もあります   こちら . セットアップガイドとアプリのダウンロード:   https://www.mql5.com/en/blogs/post/768988 Telegramのシグナルチャンネルをバックテストする方法 をご覧ください。 現在の価格は今後値上げされます。 仕組み アプリはあなた自身の Telegram アカウントで接続するため、フォローしているすべてのチャンネル、グループ、ト
================================================================================ POC BREAKOUT - V20.72. Full Professional Grade Toolkit ================================================================================ POC Breakout is a full MetaTrader 5 trading dashboard for discretionary traders who want breakout signals, Point of Control (POC) context, volume profiles, order flow, market structure, news, alerts, and advanced trade planning in one professional workspace. Attached directly to you
TradePanel MT5
Alfiya Fazylova
4.88 (169)
Trade Panelは多機能なトレーディングアシスタントです。アプリには手動取引用の50以上のトレーディング機能が搭載されており、ほとんどの取引作業を自動化することができます。 アプリの説明書: https://www.mql5.com/en/blogs/post/756482 デモ口座用アプリの試用版: https://www.mql5.com/en/blogs/post/750865 アプリのインストール方法: https://www.mql5.com/en/blogs/post/756239 アプリをビジュアルモードでテストする方法: https://www.mql5.com/en/blogs/post/770277 VPSのMetaTraderにアプリをインストールする方法: https://www.mql5.com/en/blogs/post/770190 取引。 ワンクリックで取引操作を行うことができます: リスクを自動計算して指値注文やポジションを開く。 複数の注文やポジションをワンクリックで開く。 注文のグリッドを開く。 保留中の注文やポジションをグループごとに閉じる
自分の取引ルールで Telegram のシグナルをコピー Telegram to MT5 Signal Trader は、Telegram の公開・非公開チャンネルやグループから、テキスト形式の取引シグナルを MetaTrader 5 へ自動でコピーします。1つのデスクトップアプリで複数の配信者と MT5 口座を管理し、 配信者ごとにリスクと取引設定を個別に指定 できます。 シグナルのコピーに Telegram ボットや API 設定は必要ありません。 電話番号または QR コードでご自身の Telegram アカウントにログインし、すでに参加しているチャンネルやグループを選ぶだけです。ボットの作成や、Telegram API トークン、API ID、API hash の入力は不要です。 ポジションサイズを選び、複数の利確水準に分けて決済し、建値へのストップ移動やトレーリングストップを自動化できます。配信者のシグナルを受け取りながら、実際の取引方法は自分で管理できます。 本製品は、この MT5 エキスパートアドバイザ(EA)と、必須の Windows 連携アプリで構成されます。 インス
Farmed Hedge Yield Farming | All Markets (Manual - Hybrid - Semi/Automated EA) VERIFIED TRADING RESULTS - Farmed Hedge Yield Axi Copy:  https://www.mql5.com/en/signals/2356376 - Farmed Hedge Yield Exn Copy:   https://www.mql5.com/en/signals/2356404 - Farmed Hedge Yield V Copy:  https://www.mql5.com/en/signals/2357156 IMPORTANT NOTICE: FarmedHedge is a MANUAL-FOCUSED TRADING UTILITY ,not a fully automated EA. Results shown on this Signal include manual trades and overall strategic management.
Exp COPYLOT CLIENT for MT5
Vladislav Andruschenko
3.97 (35)
MetaTrader 5 用のプロフェッショナル取引コピー機 MetaTrader 向けの高速・高性能・信頼性の高い 取引コピー機 です。 COPYLOT は、MT4 と MT5 のターミナル間で Forex 取引をコピーでき、 Hedge 口座と Netting 口座の両方に対応しています。 COPYLOT MT5 版の対応構成: - MT5 Hedge → MT5 Hedge - MT5 Hedge → MT5 Netting - MT5 Netting → MT5 Hedge - MT5 Netting → MT5 Netting - MT4 → MT5 Hedge - MT4 → MT5 Netting MT4 版 完全な説明 + DEMO + PDF 購入方法 インストール方法 ログファイルの取得方法 テストと最適化の方法 Expforex のすべての製品 MT4 ターミナルへのコピーも可能です(MT4 → MT4、MT5 → MT4): COPYLOT CLIENT for MT4 COPYLOT は、2台、3台、さらには10台のターミナル間で同時に動作できる、プロフェッ
Power Candles Strategy Scanner - 自動最適化型マルチシンボル設定ファインダー パワーキャンドル・ストラテジー・スキャナーは 、パワーキャンドル・インジケーターを駆動するのと全く同じ自己最適化エンジンを、マーケットウォッチに登録されているすべての銘柄に対して並行して実行します。1つのパネルで、現在統計的に取引可能な銘柄、各銘柄で勝率の高い戦略、最適なストップロス/テイクプロフィットの組み合わせが表示され、新たなシグナルが発生した瞬間に通知が届きます。 このツールは、Stein Investmentsのエコシステムの一部です。  18種類以上のツールをすべて閲覧し、AIを活用したセットアップの推奨を受け取り、  https://stein.investments でコミュニティに参加しましょう 市場動向を網羅。銘柄ごとに3,000件以上の自動最適化。2種類のアラート。ワンクリックでチャートを切り替えて即座にアクション。 なぜこれが必要なのか 多くのマルチ銘柄スキャナーは、 価格の動き (ボラティリティ、変動率、銘柄ごとのRSI)を表示するだけです。それ
Signal TradingView to MT5 Pro Automator TradingViewとMetaTrader 5間の即時プロフェッショナル実行 TradingViewのシグナル(アラート)とMT5での実際の約定を繋ぐ、最も強固なコミュニケーションブリッジで、取引戦略を自動化します。スピード、柔軟性、そして完璧なリスク管理を求めるトレーダー向けに設計されたこのExpert Advisorは、あらゆるアラートメッセージを正確な成行または指値注文に変換します。 強みと利点 ユニバーサルパーシングエンジン(独自技術): あらゆるアラート形式からデータを自動的に認識し、抽出できる高度なテクノロジー。単一の固定フォーマットに制限されることはありません。システムはシンボル(銘柄)、アクション、価格、SL(ストップロス)、TP(テイクプロフィット)を自動的に理解します。 リアルタイム実行: レイテンシ(遅延)を最小限に抑えるよう最適化された、1秒未満の超高速ポーリング技術。シグナルを受信してから数ミリ秒以内に注文が実行されます。 機関投資家レベルのリスク管理: 以下に基づく自動かつ正確
Trade copier MT5
Alfiya Fazylova
4.61 (56)
Trade Copierは、取引口座間の取引をコピーして同期するように設計された専門的なユーティリティです。 コピーは、同じコンピューターまたはvps にインストールされている、サプライヤーのアカウント/端末から受信者のアカウント/端末に行われます。 購入する前に、デモ アカウントでデモ バージョンをテストできます。 デモ版 こちら 。 詳細な説明は こちら 。 主な機能と利点: MT5ネッティングアカウントを含む、MT5> MT5、MT4> MT5、MT5> MT4のコピーをサポートします。 高いコピー速度(0.5秒未満)。 ベンダーモードと受信者モードは同じ製品内に実装されています。 チャートから直接リアルタイムでコピーを制御できる、簡単で直感的なインターフェイス。 接続が切断されたり、端末が再起動されたりしても、設定と位置が失われることはありません。 コピーするシンボルを選択できます。また、受信者のシンボルを置き換えることもできます(例:EURUSD> USDJPY)。 各シンボルごとにコピーの個別設定を行うことができます。 バックコピーをサポートします。 特定の注文のみのコピー
Premium Trade Manager - コーチ内蔵型トレードパネル Premium Trade Manager は、AIトレーディングコーチをあなたのチャートの中に置き、その下に完全な執行エンジンを備えたツールです。いつも通りにトレードをセットアップし、あなた専任のAIトレーディングコーチ Max にそのセットアップをそのまま読み取らせて、発注前に率直な見解を伝えてもらいましょう。ストップの幅が規律あるアプローチに合っているか、リスクサイズは適切か、高影響のニュースイベントが数分後に迫っていないか、プロップファームの制限に近づいていないか。その下には、クリックの後をすべて処理するエンジンが備わっています。ワンクリックのリスクサイズ計算による発注、チャート上でドラッグして組み立て、発注後も動かせるプラン、最大4段階の分割利確、7種類のトレール方式、リアルタイムのプロップファームコンプライアンス、ニュースガード、そしてコストを自ら採点するスプレッド機能。判断はあなたが下す。Max がもう一度確認する。後のことはすべてパネルが担う。 購入前に実際に触れて試せます。 ブラウザ上でライブ
MT5 to Telegram Signal Provider は、Telegramのチャット、チャンネル、またはグループに 指定された シグナルを送信することができる、完全にカスタマイズ可能な簡単なユーティリティです。これにより、あなたのアカウントは シグナルプロバイダー になります。 競合する製品とは異なり、DLLのインポートは使用していません。 [ デモ ] [ マニュアル ] [ MT4版 ] [ Discord版 ] [ Telegramチャンネル ]  New: [ Telegram To MT5 ] セットアップ ステップバイステップの ユーザーガイド が利用可能です。 Telegram APIの知識は必要ありません。必要な全ては開発者から提供されます。 主な特長 購読者に送信する注文の詳細をカスタマイズする機能 例えば、Bronze、Silver、Goldといった階層型のサブスクリプションモデルを作成できます。Goldサブスクリプションでは、すべてのシグナルが提供されます。 id、シンボル、またはコメントによって注文をフィルターできます 注文が実行されたチャート
HINN MAGIC ENTRY – the ultimate tool for entry and position management! SIMPLE. FASTEST. INTUITIVE. MAX AUTOMATED. Place orders by selecting a level directly on the chart! full description   ::  demo-version  :: 60-sec-video-description Key features: - Market, limit, and pending orders - Automatic lot size calculation - Automatic spread and commission accounting - Unlimited partitial take-profits  - Breakeven and trailing stop-loss and take-profit  functions - Invalidation leves - Intuitive, a
EA Overfitter
Stephen J Martret
5 (1)
That backtest looks great. But will it still be making money tomorrow, next week, next month? EA Overfitter re-runs your EA on 100 price histories it has never seen. One score tells you if the edge is real. A backtest tells you what an EA did on one price history — the one that happened to occur. What you cannot tell from it is how much of that result was the strategy and how much was the particular path. EA Overfitter answers that. It builds up to 100 synthetic price histories your EA has n
購入後にメッセージをお送りください。完全版マニュアルキット + AI機能をテストできる3日間のOpenAI APIトライアル + 追加ボーナスギフトをお受け取りいただけます 現在の価格は、8月のリローンチアップデートに伴う期間限定割引価格です — 値上げ前に今すぐエディションを確保してください。 次回価格:$340 これは、あなたが市場で試したことのある、または見たことのあるどのトレーディングパネルともまったく異なります。現在、リテール市場で利用できる最も革新的なAI搭載トレーディングパネルの一つです。 AIをチャートに直接接続することを想像してください   — AIによる推奨、口座監査、AIトレードシグナルの受信、そしてワンクリックでの実行。 Telegramを通じてスマートフォンから   取引口座全体を管理することを想像してください   — AIとのチャット、即時アラートの受信、取引の管理、どこからでも口座を保護できます。   複数のEA   を稼働させ、それぞれのEAのパフォーマンスを個別に監視し、その取引を管理したり、特定のポジションをスマートフォンから直接決済したりできるこ
EA Slipstream
Stephen J Martret
5 (1)
Your backtest filled every order at the price it asked for. Your account does not. EA Slipstream measures what execution costs your EA, using your own fills, slippages and spreads to show you the true performance of your EA. A backtest prices every trade at the level the EA named. In live trading a pending order fills at whatever price is available when it triggers, a stop closes wherever the market is when it is hit, and the spread at that moment is whatever the account was quoting. The differ
Trade Manager は、リスクを自動的に計算しながら、取引を迅速に開始および終了するのに役立ちます。 過剰取引、復讐取引、感情的な取引を防止する機能が含まれています。 取引は自動的に管理され、アカウントのパフォーマンス指標はグラフで視覚化できます。 これらの機能により、このパネルはすべてのマニュアル トレーダーにとって理想的なものとなり、MetaTrader 5 プラットフォームの強化に役立ちます。多言語サポート。 MT4バージョン  |  ユーザーガイド + デモ Trade Manager はストラテジー テスターでは機能しません。 デモについてはユーザーガイドをご覧ください。 危機管理 % または $ に基づくリスクの自動調整 固定ロットサイズを使用するか、ボリュームとピップに基づいた自動ロットサイズ計算を使用するオプション RR、Pips、または価格を使用した損益分岐点ストップロス設定トレーリングストップロス設定 目標に達したときにすべての取引を自動的に終了するための 1 日あたりの最大損失 (%)。 過度のドローダウンからアカウントを保護し、オーバートレードを防ぎます
Trade Dashboard simplifies how you open, manage, and control your trades, with built-in lot size calculation. It allows you to execute trades, manage risk, and control positions directly on the chart, with tools such as partial close, breakeven, and trailing stop. Designed to reduce manual work and help you stay focused on your trading decisions. A demo version is available for testing. Detailed explanations of features are provided within the MQL5 platform. Installation instructions are include
MT5 用 Dynamic Fibonacci Grid Dashboard の最新バージョンを紹介します。 数多くの新機能を搭載したこの新しいダッシュボードは、トレード体験を一新し、市場や価格アクションをまったく新しい視点から見ることができます。複数のタイムフレームと複数のシンボルを同時に分析することで、新たな可能性を発見できます。手動トレードやポジション管理のための使いやすいインターフェース、そしてあらかじめ設定された自動売買戦略を適用するための拡張機能を備えています。さらに、DFGはストラテジーテスター内でトレーディングシミュレーターとして完全に機能し、過去データを使用してさまざまな市場環境を再現できます。ビジュアルモードで手動トレードを練習したり、高速モードで自動売買戦略をテストしたりすることが可能です。 主な特徴 • Dynamic Fibonacci Bands の概念に基づく、複数タイムフレームおよび複数シンボルの高度なテクニカル分析。 リアルタイム市場監視ダッシュボードにより、これまでにない効率性を体験できます。M1、M5、M15、H1 のチャートから得られる複雑な
Grid Manual MT5
Alfiya Fazylova
4.73 (22)
「Grid Manual」は、注文のグリッドを操作するための取引パネルです。 ユーティリティはユニバーサルで、柔軟な設定と直感的なインターフェイスを備えています。 それは、損失を平均化する方向だけでなく、利益を増やす方向でも注文のグリッドで機能します。 トレーダーは注文のグリッドを作成して維持する必要はありません。 すべてが「Grid Manual」によって行われます。 注文を開くだけで十分であり、「Grid Manual」は注文のグリッドを自動的に作成し、非常に閉じるまでそれに付随します。 完全な説明とデモバージョン ここ。 ユーティリティの主な機能と機能 ユーティリティは、モバイル端末から開かれた注文を含め、あらゆる方法で開かれた注文を処理します。 「制限」と「停止」の2種類のグリッドで機能します。 グリッド間隔の計算には、固定と動的(ATRインジケーターに基づく)の2つの方法で機能します。 オープンオーダーグリッドの設定を変更できます。 チャート上の各注文グリッドの損益分岐点を表示します。 各注文グリッドの利益率を表示します。 ワンクリックでグリッドから収益性の高い注文を閉じるこ
TelegramからMT5へ: 究極のシグナルコピーソリューション Telegram to MT5 を使えば、取引がシンプルになります。DLL を必要とせず、Telegram のチャンネルやチャットから MetaTrader 5 プラットフォームに取引シグナルを直接コピーできる最新ツールです。この強力なソリューションは、正確なシグナル実行、豊富なカスタマイズオプション、時間の節約、そして効率性の向上を実現します。 [ Instructions and DEMO ] 主な特徴 直接的なTelegram API統合 電話番号とセキュアコードで認証します。 ユーザーフレンドリーな EXE ブリッジを通じてチャット ID を簡単に管理できます。 複数のチャネル/チャットを追加、削除、更新して、同時に信号をコピーします。 高度なフィルターによる信号解析 例外的な単語 (例: 「レポート」、「結果」) を含む不要な信号をスキップします。 柔軟な SL および TP 形式 (価格、ピップ、ポイント) をサポートします。 価格ではなくポイントを指定するシグナルのエントリ ポイントを自動的に計算します。
Telegram To MT5 — シグナルコピア Telegram チャンネルのトレードコールを、実際の MT5 注文に変換します — 自動で、好きなだけの口座に対応し、リスクとルールは完全にあなたの管理下に置けます。 Telegram To MT5 は、あなたが Telegram で既にフォローしている VIP / シグナルチャンネルを MetaTrader 5 端末に接続します。無料の付属デスクトップアプリがメッセージを読み取り(ボットを禁止しているチャンネルでも可能)、この EA があなたの口座でそれらを執行します — あなた自身のリスク設定、シンボルマッピング、テイクプロフィット処理、セッションおよびニュースフィルターを適用します。 これはシグナルコピアであり、ブラックボックス戦略ではありません。どのチャンネルを信頼するか、各トレードのロットと管理方法をあなたが決めます。 ステップバイステップの設定と付属アプリのインストールガイド 仕組み [あなたの Telegram チャンネル] -> [付属デスクトップアプリ] -> [MT5 + この EA] -> 注文 付属デスクトッ
DrawDown Limiter
Haidar Lionel Haj Ali
5 (22)
DrawDown Limiter v5.0 — 高度な口座保護コントローラー DrawDown Limiter v5.0 は、取引口座を監視し、設定されたリスク、利益、ニュース、スケジュール、ロールオーバー、またはポジション数の制限に達した際に自動的に対応する、クライアント側で動作する口座保護コントローラーです。 1つの専用チャートから、 手動取引、自動売買戦略、複数のExpert Advisor、指値・逆指値注文、保有ポジション を監視できます。口座全体を保護することも、Magic Numberを使用して特定のEAまたは複数のEAのみを監視することもできます。 DrawDown Limiter の目的は、単にドローダウンを表示することではありません。 設定した取引ルールを積極的に適用し 、保護条件が有効である限り、そのルールを継続的に実行することを目的としています。 DrawDown Limiter v5.0 は、損失額だけを監視するのではなく、戦略がいつ取引を継続できるのか、どのエクスポージャーを維持できるのか、いつ取引を停止すべきか、そして自動売買環境をいつ安全に再開できるのかま
Basket EA MT5
Juvenille Emperor Limited
5 (7)
Basket EA MT5 は、強力な利益収穫ツールであり、包括的な口座保護システムがシンプルで使いやすい形で統合されたソリューションです。その主な目的は、すべてのポジションを個別管理ではなく“バスケットレベル”で一括管理することで、口座全体の損益を完全にコントロールすることにあります。EAは、テイクプロフィット、ストップロス、ブレイクイーブン、トレーリングストップといったバスケットレベルの機能を備えており、これらを口座残高の%/口座通貨の固定額/管理対象取引の平均ポイントといった形で設定できます。この柔軟性により、トレーダーは個々のリスクと利益戦略を自分に合わせてカスタマイズできます。さらに、 Basket EA MT5 は、Magic Number、通貨ペア、コメントなどに基づいて特定の取引を管理対象から除外または含めるフィルタリング機能を提供し、望む取引だけを管理できるようにします。 追加の保護機能として、高度な口座セーフガード機能を搭載しています。指定したエクイティのテイクプロフィット・ストップロス水準、または最高残高からの最大ドローダウンに達した場合、EAはすべてのオープンポ
Exp5 Duplicator
Vladislav Andruschenko
4.78 (9)
Duplicator for MetaTrader 5 — 1つの端末内で動作するプロフェッショナルなポジション複製システム MetaTrader 5 ですでに開かれているポジションを自動で複製し、総ボリュームを拡張し、独自のロット設定を適用しながら、複製ポジションを明確なルールで管理したいトレーダーのための信頼性の高い Expert Advisor です。 手動売買、アルゴリズム売買、そして既存ポジションをより柔軟に管理したい場面に適した実用的なツールです。 Duplicator for MT5 は独自の売買戦略で新規ポジションを開くものではありません。役割は、MetaTrader 5 口座内にすでに存在しているポジションを監視し、指定した条件に従ってその複製を作成することです。複製回数、ロットサイズ、Stop Loss、Take Profit、コメント、追加の管理条件まで細かく設定できます。 異なるプラットフォーム間のコピーではなく、 同じ MetaTrader 5 端末内で ポジションを正確に複製したい場合、この MT5 版 Duplicator はその目的のために作られていま
Seconds Chart - MetaTrader 5で秒足チャートを作成するユニークなツールです。 Seconds Chart を使用すると、秒単位のタイムフレームでチャートを構築でき、標準的な分足や時間足チャートでは得られない柔軟性と分析精度を実現します。例えば、 S15 は15秒足を表します。カスタムシンボルをサポートしているインジケーターやEAをすべて使用できます。標準的なチャートと同様に便利に操作できます。 標準的なツールとは異なり、 Seconds Chart は超短期のタイムフレームでも高い精度と遅延なく作業できるように設計されています。 Free Demo: Seconds Chart v2.29 Demo.ex5 無料デモをダウンロードしてご自身でお確かめください: 完全機能版 - すべての機能が利用可能 24時間テスト - 精度と利便性を評価するのに十分な時間 デモ口座のみ - ほとんどのブローカーで簡単に開設可能 GBPCADチャートのみ - ほとんどの端末で利用可能 これらの制限はデモ版のみに適用されます。製品版は、あらゆる口座タイプ(リアル、デモ、コンテス
作者のその他のプロダクト
Gold VWAP Drift
Ubaldo Barranco Jimenez
Gold VWAP Drift is a complete, self-contained trading system for XAUUSD , engineered around one of the most reliable structural relationships in intraday gold: the interaction between price, the session Volume-Weighted Average Price, and a dynamic trend filter. It does not chase breakouts and it does not guess tops or bottoms. It waits for the market to show its hand, then acts with precision. The system establishes a clear directional bias using a long-term trend filter, then engages only when
FREE
DriftLock ETH
Ubaldo Barranco Jimenez
Cross-Asset Order Flow EA: Automated ETHUSD Trading on H1 In Plain Language If you've never used an EA (Expert Advisor) before: this is a program that watches the market and places trades on your MT5 account automatically, following one fixed strategy, without you having to sit and watch charts. DriftLock ETH uses a cross-asset approach : Bitcoin acts as an external source of market information, while ETHUSD is the asset actually traded by the EA. The EA continuously evaluates market conditions
FREE
GOLD STAIRSTEP PRO An Automated, Institutional-Grade System Built for Disciplined Market Execution Gold StairStep Pro is an automated trading solution engineered for traders who demand precision, structural confluence, and strict risk parameters in high-volatility environments. Tailored specifically for XAUUSD on the M5 timeframe , the system constantly evaluates price behavior through four proprietary multi-layer market filters: structural trend regimes, momentum expansion, short-term positioni
FREE
Native Session Volume Splits traded volume by trading session: Asia, London, the London/New York overlap, New York, and everything outside those windows. Free tools that show session times only paint a coloured box on the chart. None of them tell you how much volume actually happened inside each session, because MetaTrader 4 never had real volume at all. MetaTrader 5 does, and this indicator uses it. WHAT IT SHOWS A histogram in a sub-window, one bar per candle, coloured by the session it fal
FREE
Native Spread Monitor answers a simple question: is the spread you are being charged right now normal for this hour of the day, or are you about to overpay? Every free spread tool shows the CURRENT spread. None of them show what is typical for this hour, because MetaTrader 4 never kept per-bar spread history. MetaTrader 5 does, and this indicator uses it. HOW TO USE IT 1. Drag the indicator onto any chart. A panel appears in the bottom-left corner (you can move it to another corner in the set
FREE
Native Account Stats breaks your own closed-trade history down by symbol, by hour of day and by weekday, with profit factor, win rate, expectancy and the drawdown of the closed-trade equity curve. Trades are reconstructed from MT5 deals, so deposits, credits and corrections never count as winning trades. WHAT IT SHOWS A panel on the chart reports: Trades, net result, profit factor, win rate, expectancy and max drawdown Average win, average loss, largest win, largest loss A breakdown by symbol
FREE
Crypto Triangle Pro is a fully automated ETHUSD trading system built around cross-market confirmation. Instead of relying on Ethereum price action alone, the system evaluates Ethereum together with Bitcoin and Solana to determine whether the broader crypto market is supporting the same directional regime. The system establishes a directional bias on Ethereum, then requires confirmation from Bitcoin and Solana before opening a position. A trade is taken only when the three-asset structure is alig
フィルタ:
classicaltrading
374
classicaltrading 2026.09.16 07:35 
 

ユーザーは評価に対して何もコメントを残しませんでした

Ubaldo Barranco Jimenez
901
開発者からの返信 Ubaldo Barranco Jimenez 2026.09.17 00:09
Thanks a lot. If you've got any comments or suggestions, feel free to share them, happy to look at including them in the next version.
レビューに返信