Native Depth Viewer

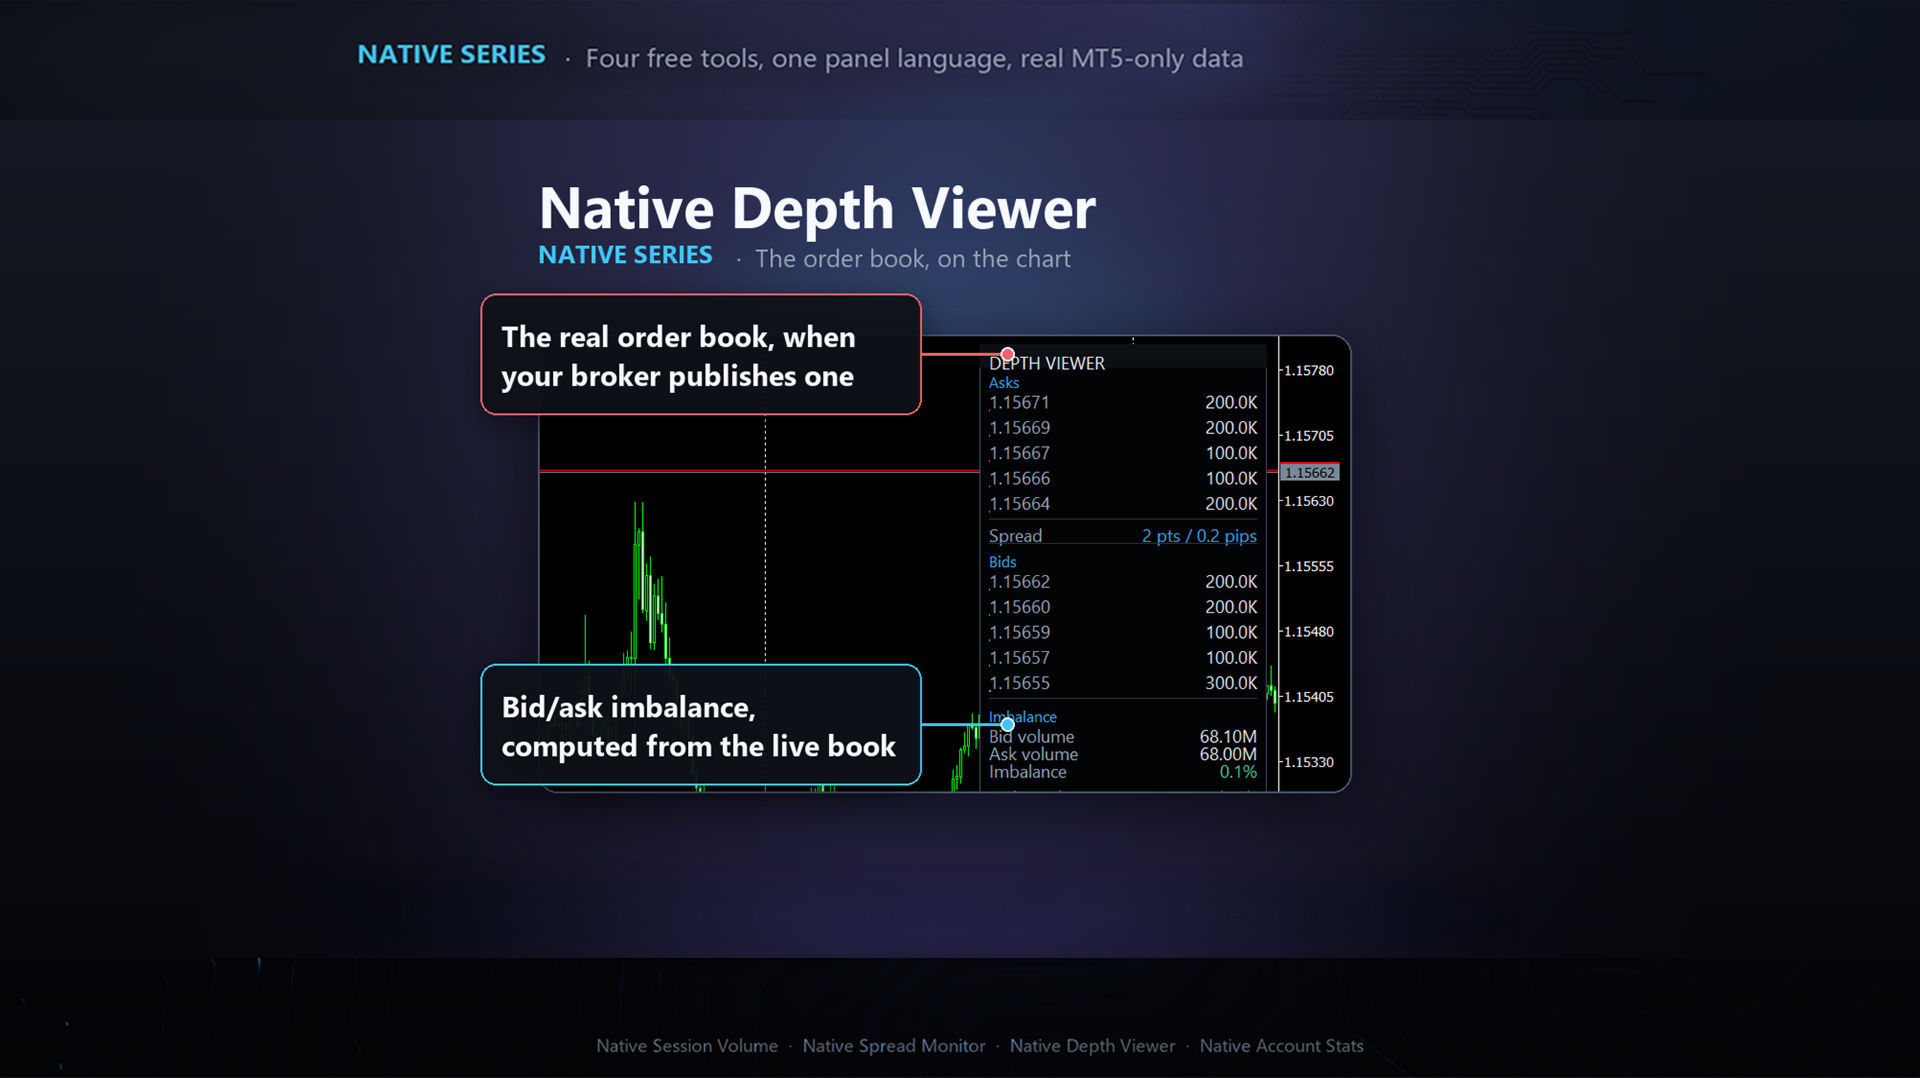
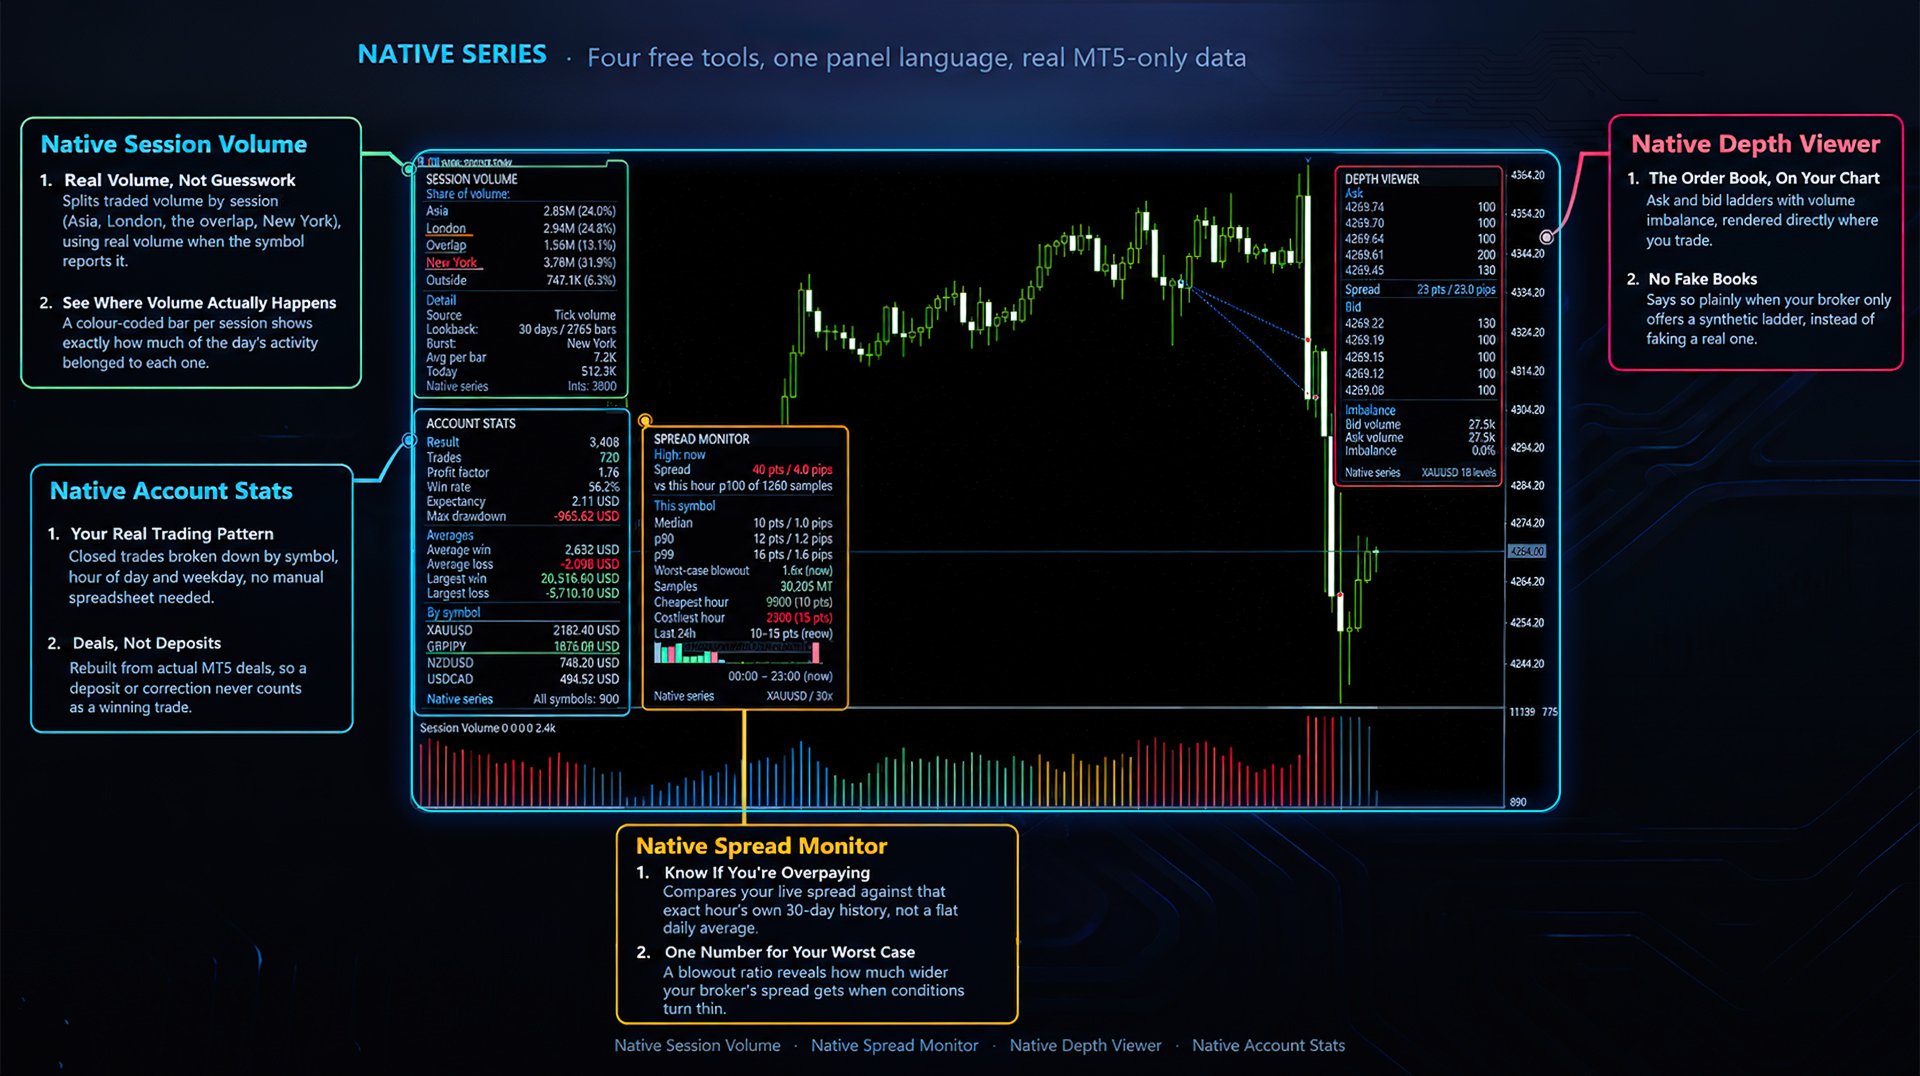
Native Depth Viewer renders the order book of the current symbol directly on the chart: ask ladder, bid ladder, spread, and bid/ask volume imbalance. MarketBookAdd, OnBookEvent and MarketBookGet, the functions this indicator is built on, have no equivalent in MQL4. This reading is native to MetaTrader 5 only.

WHAT IT SHOWS

When your broker does publish a real book for the symbol:
  • Ask ladder (sell side), worst price first, reading top-down like a real DOM
  • Bid ladder (buy side), best price first
  • Current spread, in points and pips, computed from the book's own best bid/ask
  • Bid volume, ask volume, and the imbalance between them as a percentage
When it does not:
  • A plain status panel stating there is no book data, the reason, and that this is a broker feed limitation, not a setting to fix in the tool

WHY THIS IS NOT AVAILABLE ON MT4

MQL4 never had an order book API of any kind. MetaTrader 5's MarketBookAdd subscribes to the book, OnBookEvent fires when it updates, MarketBookGet reads it. None of that exists in the MQL4 language. A tool like this could only ever be built on MT5.

HOW TO READ IT

A wide, one-sided ladder (far more resting size on bids than asks, or the reverse) can signal near-term pressure in that direction. A near-zero imbalance with tight levels on both sides usually means a calm, liquid moment. None of this replaces your own judgment, it is raw information, not a signal to act on automatically.

WHAT IT DOES NOT DO
This tool never places, modifies or closes an order. It is read only. It also never invents a ladder: if the broker sends nothing, or stops sending updates, the panel falls back to the no-data message instead of freezing on a stale, misleading picture.

REQUIREMENTS
  • Works on any symbol, any timeframe (the book is symbol-wide, not tied to a chart period)
  • Your broker's server must actually stream a multi-level book for the symbol you attach this to. Check this first: open the symbol in Market Watch, right-click, Depth of Market. If the "Trade" volume column is empty for every row, your broker is not publishing real depth for that symbol, and no tool, including this one, can show what was never sent.

INPUTS
  • Panel theme (Auto / Dark / Light), panel corner, panel X/Y offset
  • Book levels per side (default 5)
  • Seconds to wait before reporting no data, and to detect a feed that has gone quiet after previously working

PART OF THE NATIVE SERIES

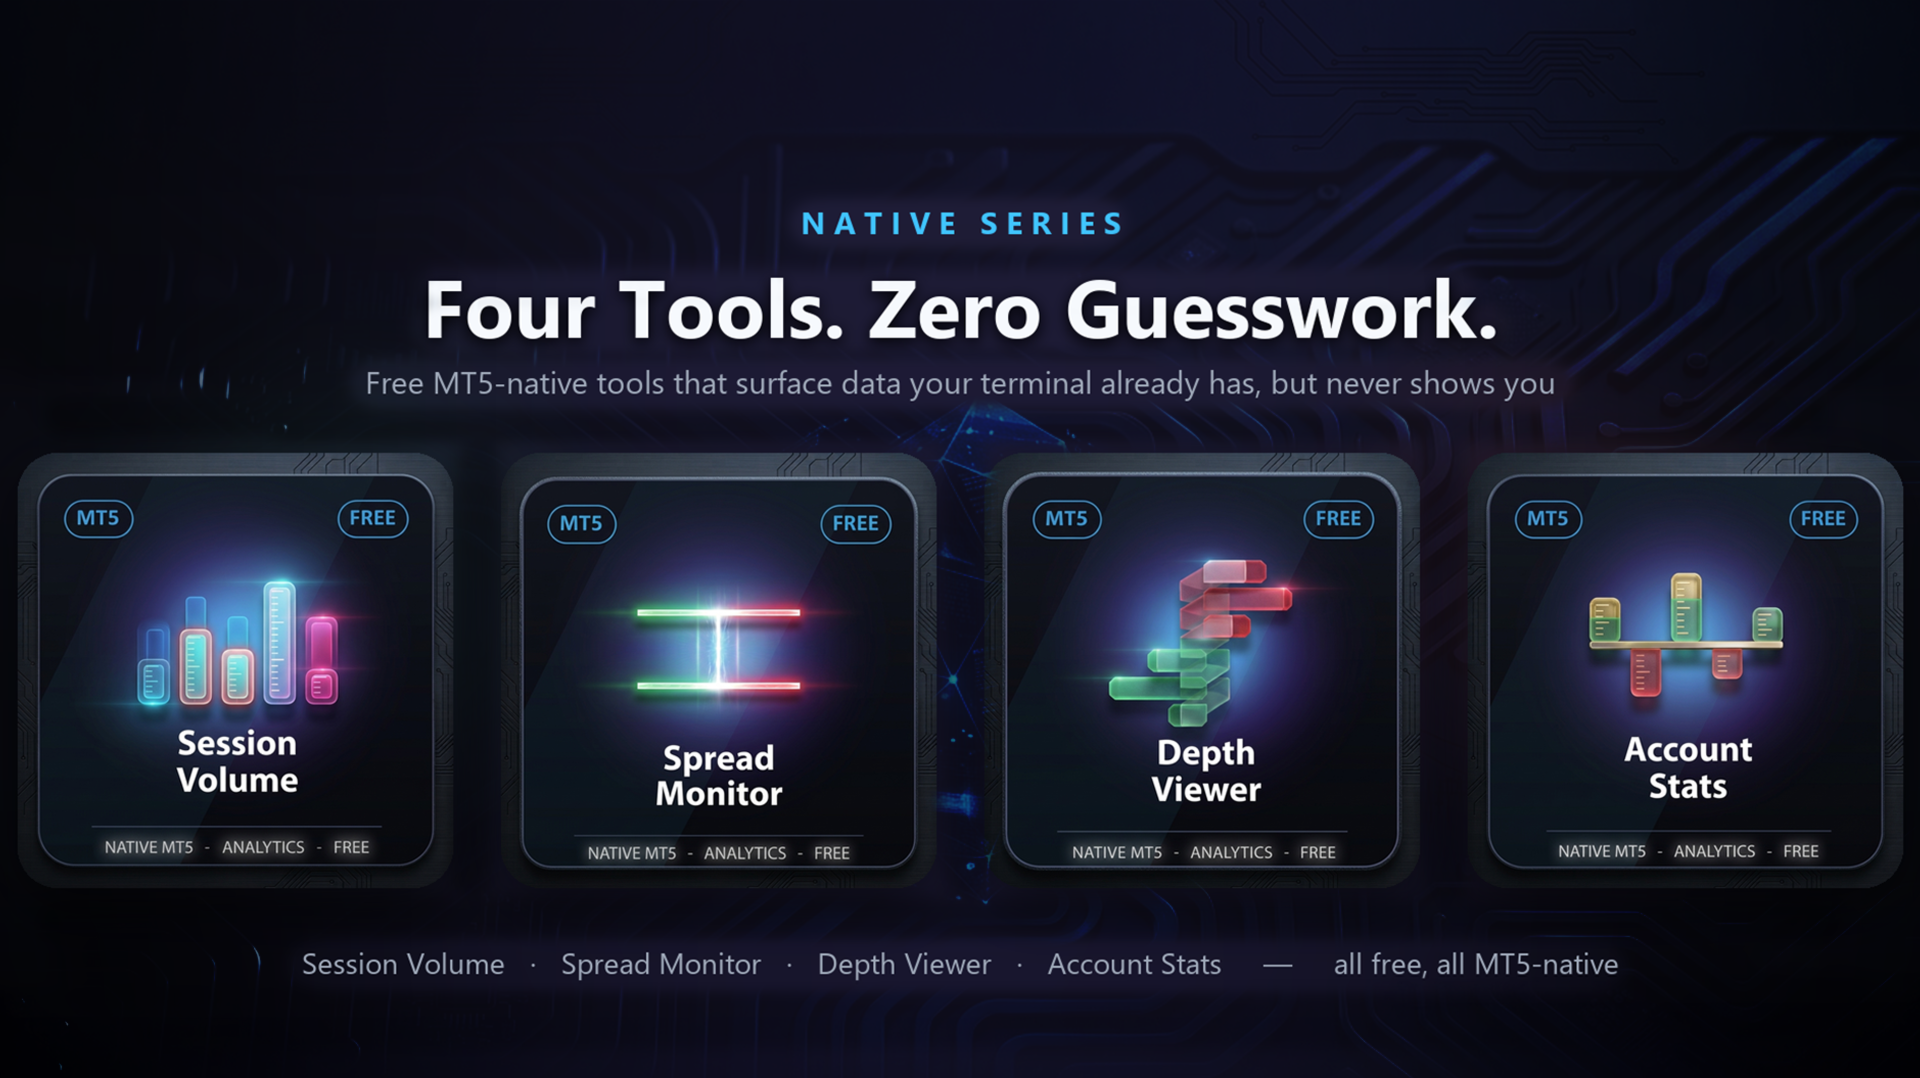
Four free tools that surface data MetaTrader 5 already has but does not show:

All four are free, read only, and share the same panel.


DISCLAIMER: depth of market is published by your broker, not by this tool. Most retail forex brokers do not publish a real book, only a synthetic bid/ask ladder for one-click trading. Check Market Watch > Depth of Market for this symbol first: an empty Trade/volume column means your broker sends none. This panel says so plainly, instead of faking a ladder.
推荐产品
Value Chart Candlesticks
Flavio Javier Jarabeck
4.57 (14)
The idea of a Value Chart indicator was presented in the very good book I read back in 2020 , " Dynamic Trading Indicators: Winning with Value Charts and Price Action Profile ", from the authors Mark Helweg and David Stendahl. The idea is simple and the result is pure genius: Present candlestick Price analysis in a detrended way! HOW TO READ THIS INDICATOR Look for Overbought and Oversold levels. Of course, you will need to test the settings a lot to find the "correct" one for your approach. It
FREE
MACD Enhanced
Nikita Berdnikov
4 (4)
Introducing the MACD  Enhanced – an advanced MACD (Moving Average Convergence Divergence) indicator that provides traders with extended capabilities for trend and momentum analysis in financial markets. The indicator uses the difference between the fast and slow exponential moving averages to determine momentum, direction, and strength of the trend, creating clear visual signals for potential entry and exit points. Attention! To achieve the best results, it is recommended to adapt the indicator
FREE
Prometheus Analyst
Humphrey Mangera
PROMETHEUS TECHNICAN VERSION Free | By THE SONS A gift from The Sons — no strings, no trial, no expiry. Every trader deserves access to professional-grade market intelligence. That belief is why Prometheus Technical Version exists, and why it costs nothing. Consider it our handshake to the trading community. What You're Getting This is not a simplified tool dressed up as a gift. Prometheus Technican Version is a fully built, institutional-quality technical analysis indicator running a dual-model
FREE
QuantMatrix Candle Patterns is a free MetaTrader 5 indicator designed to identify classic candlestick formations directly on the chart. The indicator analyzes completed candles and detects recognized bullish, bearish and neutral price-action patterns. When a valid bullish or bearish formation is confirmed, the corresponding BUY or SELL signal is displayed on the following candle . This means the signal is only generated after the source pattern has been completed. The indicator also displays a c
FREE
Donchian Breakout And Rsi
Mattia Impicciatore
4.5 (2)
概述 本指标是经典 Donchian 通道 的增强版,增加了多种实用的交易功能。 除了标准的三条线(最高、最低和中线),系统能够检测 突破 ,并在图表上用箭头进行可视化标记,同时只显示 与当前趋势方向相反的那条线 ,让图表更加简洁。 功能包括: 可视化信号 :突破时在图表上绘制彩色箭头 自动通知 :弹窗、Push 推送和 Email 邮件 RSI 过滤 :根据市场相对强弱验证信号 个性化设置 :颜色、线条粗细、箭头符号、RSI 阈值等 工作原理 Donchian 通道计算: 上轨线 :最近 N 根已收盘 K 线的最高价 下轨线 :最近 N 根已收盘 K 线的最低价 中线 :最高价和最低价的平均值 看涨突破 :收盘价高于上轨线 看跌突破 :收盘价低于下轨线 指标会: 绘制三条 Donchian 通道线 仅在 方向变化后的首次突破 绘制箭头 隐藏顺应趋势方向的那条线(上涨趋势: 只显示红色下轨线;下跌趋势: 只显示绿色上轨线) 可选用 RSI 过滤突破信号,减少虚假突破 支持实时发送通知 参数说明 Donchian 通道设置 indPeriod :计算通道高低点的已收盘 K 线数量 Lin
FREE
Renko Box
Andrey Dik
5 (1)
描述。 Renko图表形成的基础是价格范围。 如果价格超出其限制,图表显示一个框高于或低于前一个。 因此,我们看到价格走势没有额外的"噪音"和重要的支撑和阻力水平。 特征。 为了与专家顾问一起使用,实现了一个额外的缓冲区-一个盒子计数器. 为了方便和提高测试速度,用户可以使用"新框"事件,指示器在出现新框时生成该事件。 您可以设置"反转"框的大小。 无论测试开始点如何,指标始终构建相同。 没有"重绘"。 一旦到了那里,拳击就不会再改变了。 无论从哪里启动,它都将被绘制相同。 输入参数: RenkoBoxSize    = 20;  //Box size ReversBcnt      = 2;   //Box's for reverse RenkoBoxDrawCNT = 100; //Box's for draw Price           = bid; //bid, ask, (ask+bid)/2 RenkoBoxEventId = 123; //Box's event
FREE
Stackable VWAP
Flavio Javier Jarabeck
3.5 (4)
Volume Weighted Average Price (VWAP) is a trading benchmark commonly used by Big Players that gives the average price a Symbol has traded throughout the day. It is based on both Volume and price. Additionally we put in this indicator the MVWAP (Moving Volume Weighted Average Price). For those who do not know the usage and the importance od this indicator I recommend a great article about this subject at Investopedia ( https://www.investopedia.com/articles/trading/11/trading-with-vwap-mvwap.asp
FREE
MIDAS Super VWAP
Flavio Javier Jarabeck
4.27 (11)
Imagine VWAP, MVWAP and MIDAS in one place... Well, you found it! Now you can track the movement of Big Players in various ways, as they in general pursue the benchmarks related to this measuring, gauging if they had good execution or poor execution on their orders. Traders and analysts use the VWAP to eliminate the noise that occurs throughout the day, so they can measure what prices buyers and sellers are really trading. VWAP gives traders insight into how a stock trades for that day and deter
FREE
RSI abcd
Francisco Gomes Da Silva
4.33 (3)
RSI ABCD形态查找器:技术策略 1. 指标工作原理 结合 经典RSI 与自动检测 ABCD谐波形态 。 主要组件 标准RSI (可调周期) 高低点标记 (箭头) ABCD形态 (绿/红线) 超买(70)和超卖(30)过滤器 2. MT5设置 period = 14 ; // RSI周期 size = 4 ; // 最大形态尺寸 OverBought = 70 ; // 超买水平 OverSold = 30 ; // 超卖水平 Filter = USE_FILTER_ YES ; // 确认过滤器 3. 交易策略 3.1. 买入信号(看涨ABCD) 条件: RSI形成: 低点( A ) → 高点( B ) → 更高低点( C ) D 高于超卖区(30)但低于 C 确认:绿色连线A-B-C-D 目标: TP1: B-C的61.8% TP2: B-C的100% 止损: 低于 D 3.2. 卖出信号(看跌ABCD) 条件: RSI形成: 高点( A ) → 低点( B ) → 更低高点( C ) D 低于超买区(70)但高于 C 确认:红色连线A-B-C-D 目标: TP1: B-C的6
FREE
VWAP and MVWAP
Flavio Javier Jarabeck
4 (9)
Volume Weighted Average Price (VWAP) is a trading benchmark commonly used by Big Players that gives the average price a Symbol has traded throughout the day. It is based on both Volume and price. Additionally we put in this indicator the MVWAP (Moving Volume Weighted Average Price). For those who do not know the usage and the importance od this indicator I recommend a great article about this subject at Investopedia ( https://www.investopedia.com/articles/trading/11/trading-with-vwap-mvwap.asp )
FREE
Daily Support and Resistance Levels 是一款专业指标,基于经典枢轴点方法自动计算并显示日内交易关键价格水平。 主要功能: 自动计算枢轴点(PP) 三个阻力位(R1, R2, R3) 三个支撑位(S1, S2, S3) 显示前一天高点/低点 实时信息面板 市场趋势方向(多头/空头)提示 显示与最近价格水平的距离 完全自定义颜色与样式 每日自动更新 支持所有周期 计算方法:基于昨日最高价、最低价、收盘价的经典枢轴点算法。 交易用途: 支撑/阻力反弹交易 突破策略 区间震荡交易 市场方向判断 盈利目标设置 使用方法: 将指标加载到图表 自动生成水平线 价格 > PP = 多头倾向 价格 < PP = 空头倾向 S1-S3 = 支撑区域 R1-R3 = 阻力区域 自定义设置: 枢轴点/支撑/阻力颜色 线条宽度与样式 显示/隐藏价格标签 显示/隐藏信息面板 面板位置与字体大小 显示/隐藏前日高低点 优点: 专业界面 无重绘 资源占用低 支持所有经纪商 适合剥头皮与日内交易 免费用于展示我的MQL5能力 如果喜欢,请留下评价。
FREE
LT Donchian Channel
Thiago Duarte
4.86 (7)
Donchian Channel is an indicator created by Richard Donchian. It is formed by taking the highest high and the lowest low of the last specified period in candles. The area between high and low is the channel for the chosen period. Its configuration is simple. It is possible to have the average between the upper and lower lines, plus you have alerts when price hits one side. If you have any questions or find any bugs, please contact me. Enjoy!
FREE
Free automatic Fibonacci is an indicator that automatically plots a Fibonacci retracement based on the number of bars you select on the BarsToScan setting in the indicator. The Fibonacci is automatically updated in real time as new highest and lowest values appears amongst the selected bars. You can select which level values to be displayed in the indicator settings. You can also select the color of the levels thus enabling the trader to be able to attach the indicator several times with differe
FREE
Weis Waves
Flavio Javier Jarabeck
2.83 (18)
The original author is David Weis, an expert in the Wyckoff Method. The Weis Wave is a modern adaptation of the 1930's Wyckoff Method, another expert in Tape Reading techniques and Chart Analysis. Weis Waves takes market volume and stacks it into waves according to price conditions giving the trader valuable insights about the market conditions. If you want to learn more about this subject you can find tons of videos in YouTube. Just look for "The Wickoff Method", "Weis Wave" and "Volume Spread
FREE
XbigCandleFibo
Alex Sandro Aparecido
This indicator marks the 50% mark of each candle. It will help you make profitable scalping trades. If the next candle opens above the 50% mark of the previous candle, you should open a BUY position, and if the next candle opens below the 50% mark of the previous candle, you should open a SELL position. This strategy is very profitable. To make the most of it, keep an eye on the candle contexts on the left. Good luck!
FREE
Tabajara V5
Flavio Javier Jarabeck
4.84 (37)
Metatrader 5 version of the famous Andre Machado's Tabajara indicator. If you don't know Andre Machado's Technical Analysis work you don't need this indicator... For those who need it and for those several friend traders who asked this porting from other platforms, here it is... FEATURES 8-period Moving Average 20-period Moving Average 50-period Moving Average 200-period Moving Average Colored candles according to the inflexion of the 20-period MA SETTINGS You can change the Period of all MA's
FREE
Girassol Sunflower MT5 Indicator
Saullo De Oliveira Pacheco
3.86 (7)
This is the famous Sunflower indicator for Metatrader5. This indicator marks possible tops and bottoms on price charts. The indicator identifies tops and bottoms in the asset's price history, keep in mind that the current sunflower of the last candle repaints, as it is not possible to identify a top until the market reverses and it is also not possible to identify a bottom without the market stop falling and start rising. If you are looking for a professional programmer for Metatrader5, please
FREE
Wave Box Market Frenquency
Jean Jacques Huve Ribeiro
4.75 (4)
Totally linked to the result of a movement and the duration he had. Its height records how many ticks the asset walked during a given movement, its width shows us the duration that movement had. Its configuration must be in line with the Weis Wave Indicator configuration to observe the movement force and can indicate a possible accumulation or distribution of the movement;
FREE
Ict market structure signals
Botsalo Martin Letlhoagoje
5 (4)
SMC Signals  (BOS/CHoCH + ADR TP/SL Zones)  SMC Signals  is a free Smart Money Concepts (SMC) market structure indicator for MetaTrader 5 that automatically detects: BOS (Break of Structure) CHoCH (Change of Character) Swing High / Swing Low pivots Trade entry levels and projected targets The indicator also calculates ADR(10) (Average Daily Range) and automatically plots: Entry level Stop Loss (SL) Take Profit 1 (TP1) Take Profit 2 (TP2) A built-in dashboard displays live performance statistic
FREE
FX Clock
Abderrahmane Benali
FXClock – Professional Clock Indicator for Traders Please leave a 5 star rating if you like this free tool! Thank you so much :) The FXClock indicator is a practical and simple tool that displays time directly on your trading platform, allowing you to track multiple key pieces of information at the same time. It is specially designed to help traders synchronize their trading with market hours and global sessions. Key Features: Displays the broker server time with precision. Displays your local c
FREE
Phoenix Delta Volume
Nigel Nii Darku Narnor Darko
5 (1)
This is the Phoenix Institutional SMC Dashboard (Emerald-Teal Edition). It is engineered to provide retail traders with the same "Volume-at-Price" clarity used by institutional desks. Below is a full breakdown of the benefits, the high-confluence logic for entries, and how to manage your trades using the current visual engine. Strategic Benefits to the User Sentiment over Price: Most indicators only look at where the price is. This dashboard tells you how much effort (Volume Delta) was required
FREE
Trade Behavior Mirror 只读取您自己账户中已经平仓的交易历史,并且只统计一种具体行为:在一次已确认的亏损之后不久,以高于自己平常水平的手数开出新仓位。这个工具不做任何预测,也不给出任何建议。面板上出现的每一个数字,都是这个账户上已经发生过的事实。 数字是这样算出来的:它读取所有品种、所有魔术号在内的最多31天已平仓交易 —— 这是整个账户的画面,而不只是当前图表所在品种的画面。从今天之前的30天里,它计算每天新开仓笔数的中位数,以及这些开仓手数的中位数。之所以用中位数而不是平均值,是为了不让某一笔异常大的交易拉偏整体基准。如果这30天窗口内的开仓不足5笔,历史数据就不足以建立一个公平的基准,面板会显示"Collecting history",而不是用过少的数据硬凑出一个数字。 核心统计,即面板上的 Entries within 10min of a loss, at above-median lot: 一行:对每一次新开仓,它都会检查前10分钟内是否有一笔亏损被确认平仓,以及这次开仓的手数是否高于30天中位数。符合条件的次数会分别按 Today 和 Last 7
FREE
WH Price Wave Pattern MT5
Wissam Hussein
4.15 (13)
Welcome to our Price Wave Pattern MT5 --(ABCD Pattern)-- The ABCD pattern is a powerful and widely used trading pattern in the world of technical analysis. It is a harmonic price pattern that traders use to identify potential buy and sell opportunities in the market. With the ABCD pattern, traders can anticipate potential price movements and make informed decisions on when to enter and exit trades. Send me a  Message and Get A Free Gift : ABCD  Symbol Scanner Dashboard! EA Version:    Price W
FREE
QuantMatrix Volatility Regime QuantMatrix Volatility Regime is a technical indicator for MetaTrader 5 that evaluates the current volatility of the selected symbol and timeframe. The indicator uses Average True Range (ATR) to compare current volatility with a historical baseline calculated from previous bars. Based on this comparison, the current market condition is classified into one of four volatility regimes: LOW – current volatility is below the historical baseline. NORMAL – current volatil
FREE
Wormhole 时间框架指标对于 MetaTrader 5 (MT5) 不仅仅是另一个交易工具——它是您在金融市场中的竞争优势。它专为初学者和专业交易者设计,Wormhole 改变了您分析数据和做出决策的方式,确保您始终领先一步。 为什么您需要(免费)Wormhole 指标 超越竞争对手: 能够在同一图表上同时查看两个时间框架意味着您总是领先一步。再也不用在图表之间切换,一切所需尽在眼前。 解锁隐藏的机会: 通过改变传统的时间框架,发现其他交易者忽略的模式,将 5 分钟图表的边界从 00:00 到 00:05 调整为 00:01 到 00:06。这些微小的变化可能揭示独特的市场动态。 获得可操作的洞察: 使用精确的工具检测趋势、反转和支撑/阻力水平,Wormhole 为您提供信心,使您能够做出明智的交易决策。 经过验证的创新 Wormhole 并非凭空猜测,而是先进研究的成果: 使用机器学习分析市场低效性。 识别零售交易群体,揭示隐藏的市场动态。 这些见解推动了该指标的开发,体现了专业级策略。 Wormhole 如何赋能您 更快的决策: 实时数据使您领先市场动态。 终极多样性: 无论
FREE
Weis Waves RSJ
JETINVEST
4.64 (11)
The Weis Waves RSJ Indicator sums up volumes in each wave. This is how we receive a bar chart of cumulative volumes of alternating waves. Namely the cumulative volume makes the Weis wave charts unique. It allows comparing the relation of the wave sequence characteristics, such as correspondence of the applied force (expressed in the volume) and received result (the price progress). If you still have questions, please contact me by direct message:  https://www.mql5.com/en/users/robsjunqueira/
FREE
Risk Calculator EA – Utility for Precise Trade Sizing If you find this tool useful consider to  Buy me a coffee!   The Ultimate Risk Calculator is a lightweight in-chart Expert Advisor (EA) designed to help you easily and quickly calculate position size and set stop-loss / take-profit levels with full control over risk management directly on the chart. What it does? It turns manual risk decisions into fast, visual, and accurate calculations. You draw or adjust the Entry, Stop-Loss and Take-P
FREE
VolumeBasedColorsBars
Henrique Magalhaes Lopes
VolumeBasedColorsBars — Free Powerful Volume Analysis for All Traders Unlock the hidden story behind every price bar! VolumeBasedColorsBars is a professional-grade, 100% FREE indicator that colorizes your chart candles based on real, adaptive volume analysis. Instantly spot surges in market activity, identify exhaustion, and catch the moves that matter. This indicator gives you:    • Dynamic color-coded bars for instant volume context    • Adaptive thresholds based on historical, session-awar
FREE
Cybertrade Keltner Channels
Emanuel Andriato
4.67 (6)
Cybertrade Keltner Channels - MT5 Created by Chester Keltner, this is a volatility indicator used by technical analysis. It is possible to follow the trend of financial asset prices and generate support and resistance patterns. In addition, envelopes are a way of tracking volatility in order to identify opportunities to buy and sell these assets. It works on periods longer than the period visible on the chart. All values ​​are available in the form of buffers to simplify possible automations.
FREE
Weis Waves(魏斯波浪) 是由大卫·魏斯 (David Weis) 开发的技术指标,灵感来源于理查德·威科夫 (Richard Wyckoff) 的原理。 与传统逐根显示的成交量不同,Weis Waves 将成交量累积为连续的上涨或下跌“波浪”,当价格方向反转时重新开始计算。 这种方法使交易者能够清晰地看到市场运动的 真实力度 ,因为每一波浪都反映了支撑一系列K线的成交量强度。 主要特点: 将成交量分组为买入波浪和卖出波浪。 突出显示市场的主导力量(买方或卖方)。 有助于识别 趋势延续 或 潜在反转 。 基于威科夫方法论,被广泛应用于成交量与资金流分析。 Weis Waves 被众多专业交易者使用,用于分析价格与成交量之间的平衡,提供更深入的市场动态视角。
FREE
该产品的买家也购买
Trade Assistant MT5
Evgeniy Kravchenko
4.43 (216)
它有助于计算每笔交易的风险,容易安装新的订单,具有部分关闭功能的订单管理, 7 种类型的追踪止损和其他有用的功能。   附加材料和说明 安装说明   -   应用程序说明   -   模拟账户应用程序的试用版 线条功能  - 在图表上显示开仓线、止损线、止盈线。 有了这个功能,就可以很容易地设置一个新的订单,并在开仓前看到它的附加特性。   风险管理  - 风险计算功能在考虑到设定的风险和止损单的大小的情况下,计算新订单的成交量。它允许你设置任何大小的止损,同时观察设定的风险。 批量计算按钮 - 启用 / 禁用风险计算。 在 " 风险 " 一栏中设置必要的风险值,从 0 到 100 的百分比或存款的货币。 在 " 设置 " 选项卡上选择风险计算的变量: $ 货币, % 余额, % 资产, % 自由保证金, % 自定义, %AB 前一天, %AB 前一周, %AB 前一个月。   R/TP 和 R/SL - 设置止盈和止损的关系。 这允许你设置相对于损失的利润大小。 例如, 1 : 1 - 这决定了 TP = SL 的大小。 2 : 1 - 这意味着 TP 是 SL 的两倍。 RR -
欢迎来到 Trade Manager EA——这是一个终极风险管理工具,旨在使交易变得更直观、精准和高效。它不仅仅是一个下单工具,而是一个用于无缝交易计划、仓位管理和风险控制的全面解决方案。不论您是新手交易员、资深交易员,还是需要快速执行的剥头皮交易员,Trade Manager EA 都可以满足您的需求,适用于外汇、指数、大宗商品、加密货币等各种市场。 借助 Trade Manager EA,复杂的计算已成过去。只需分析市场,在图表上用水平线标记入场、止损和止盈,设置您的风险水平,Trade Manager 就会立即计算出理想的头寸规模,并实时显示以点、账户货币计价的止损和止盈。每笔交易都得以轻松管理。 主要功能: 头寸规模计算器 :根据定义的风险瞬间确定交易规模。 简单的交易计划 :在图表上用可拖动的水平线直接计划交易,设置入场、止损和止盈。 实时显示 SL 和 TP :以账户货币、点或分显示止损和止盈,便于分析。 高级保护工具 盈亏平衡选项 : 基本盈亏平衡 :当您的交易达到设定水平时自动保护利润。 多级盈亏平衡 :设置多达 4 个级别以逐步保护利润。 尾随止损选项 : 基本尾随
================================================================================ POC BREAKOUT - V20.72. Full Professional Grade Toolkit ================================================================================ POC Breakout is a full MetaTrader 5 trading dashboard for discretionary traders who want breakout signals, Point of Control (POC) context, volume profiles, order flow, market structure, news, alerts, and advanced trade planning in one professional workspace. Attached directly to you
Strategy Ledger Pro
Abdullah Uygar Tuna
5 (7)
现已支持中文。 Strategy Ledger Pro 是一款适用于 MetaTrader 5 的只读账户分析面板。它按智能交易系统(EA)、策略、品种和魔术号拆分账户结果,让您看清每一个的真实贡献。 面板支持 11 种语言:English、Français、Deutsch、Español、Italiano、Português、Русский、Türkçe、中文、日本語 和 한국어。 下载演示版之前请注意。 Market 仅在策略测试器中运行任何付费产品的演示版。本面板分析的是您自己账户上的交易,而策略测试器中没有可读取的账户历史,因此演示版会打开一个空面板并加以说明。这是演示机制的工作方式,并非产品的限制。 本描述中的视频展示了面板在真实账户上的运行效果。 详细的 使用手册 (英文)介绍了每项功能, AureusAI Trading Suite 群组欢迎交流讨论并发布公告。 MetaTrader 对整个账户只显示一个余额。当多个 EA 同时交易时,这个余额无法说明每个 EA 的贡献。Strategy Ledger Pro 读取账户历史,重建已平仓头寸,将其归入各个策略,并在一个
Local Trade Copier EA MT5
Juvenille Emperor Limited
4.94 (149)
Local Trade Copier EA MT5 是一款快速、灵活的交易复制工具,用于在同一台 Windows 电脑或 Windows VPS 上的多个 MetaTrader 5 账户之间复制和管理交易。 它将本地交易同步与 Receiver 端的手数管理、风险管理、交易过滤、品种映射、交易管理和账户保护功能结合在一起。 只需约 1 分钟 即可完成 Transmitter 和 Receiver 终端的设置,并可在同一经纪商或不同经纪商的账户之间复制手动交易或 EA 交易。在合适的条件下,本地 MetaTrader 终端之间的交易信息可以在 0.5 秒以内 完成同步。实际交易执行速度取决于经纪商延迟、网络状况、电脑/VPS 性能以及终端负载。 购买前先试用免费演示版 您可以在 MT5 模拟账户上测试 功能完整的 Local Trade Copier EA MT5 免费演示版 ,每次可使用 4 小时 : 下载 Local Trade Copier EA MT5 免费演示版 将下载的文件放入: MT5 → 文件 → 打开数据文件夹 → MQL5 → Experts 然后重新启动 MT
Telegram to MT5 Multi-Channel Copier   可将您 Telegram 频道中的交易信号自动复制到 MetaTrader 5。无需机器人、无需浏览器扩展、无需手动复制。信号一到 Telegram,EA 几秒内就在您的终端开仓。 在复制某个频道之前,内置回测器还能告诉您该频道在您的账户上会有怎样的表现。 产品包含两个组件:一个监听您 Telegram 频道的 Windows 应用程序,以及在 MT5 终端执行信号的本 EA。同时提供 MT4 版本   点此 . 设置指南与应用下载:   https://www.mql5.com/en/blogs/post/768988 了解如何 回测任何 Telegram 信号频道 。 当前价格将来会上调。 工作原理 应用通过您自己的 Telegram 账号连接,因此能看到您关注的所有频道、群组、话题和机器人,包括私密和 VIP 频道。信号到达时,应用读取它,EA 按您的手数和设置在终端中开仓。 整个过程全自动,无需守在电脑前。专为 24/7 无人值守运行设计:Telegram 连接断开时,应用会自动重连。 打开应用并登录
TradePanel MT5
Alfiya Fazylova
4.88 (170)
交易面板是一款多功能交易助手。该应用包含超过50种手动交易功能,并允许您自动执行大多数交易任务。 应用程序说明 : https://www.mql5.com/zh/blogs/post/761102 用于模拟账户的应用程序试用版: https://www.mql5.com/zh/blogs/post/762579 如何安装应用程序: https://www.mql5.com/zh/blogs/post/762580 如何在可视化模式下测试应用程序: https://www.mql5.com/zh/blogs/post/770278 如何在VPS MetaTrader上安装应用程序: https://www.mql5.com/zh/blogs/post/770196 贸易. 只需单击一下即可执行交易操作: 打開掛單和頭寸,並自動計算風險。 一鍵打開多個訂單和頭寸。 打開訂單網格。 按組別關閉掛單和頭寸。 反轉頭寸方向(關閉買入>打開賣出,關閉賣出>打開買入)。 鎖定頭寸(通過開啟缺少的頭寸,使買入和賣出頭寸的數量相等)。 一鍵部分關閉所有頭寸。 將所有頭寸的止盈和止損設置在同一價格水平。
按照自己的交易规则复制 Telegram 信号 Telegram to MT5 Signal Trader 可将 Telegram 公开及私密频道和群组中的文字交易信号自动复制到 MetaTrader 5。通过一个桌面应用管理多个信号提供者和 MT5 账户,并为 每个提供者单独设置风险和交易参数 。 复制信号无需 Telegram 机器人,也无需配置 API。 只需通过手机号或二维码登录您自己的 Telegram 账户,然后选择您已加入的频道或群组。您无需创建机器人,也无需提供 Telegram API 令牌、API ID 或 API hash。 自行选择仓位大小,将平仓分配到多个止盈价位,并自动执行保本止损和移动止损。在跟随信号提供者的同时,掌握信号的实际交易方式。 本产品由这款 MT5 EA 和必须配合使用的 Windows 桌面应用组成。请参阅 安装指南及应用下载 。 管理多个信号提供者和账户 为每个提供者单独设置: 为每个频道设置专属的仓位计算方式、入场规则、止损、止盈和交易管理参数。 灵活分配至不同账户: 将同一提供者的信号复制到多个已连接的 MT5 账户,并为每个账户使用不
Farmed Hedge Yield Farming | All Markets (Manual - Hybrid - Semi/Automated EA) VERIFIED TRADING RESULTS - Farmed Hedge Yield Axi Copy:  https://www.mql5.com/en/signals/2356376 - Farmed Hedge Yield Exn Copy:   https://www.mql5.com/en/signals/2356404 - Farmed Hedge Yield V Copy:  https://www.mql5.com/en/signals/2357156 IMPORTANT NOTICE: FarmedHedge is a MANUAL-FOCUSED TRADING UTILITY ,not a fully automated EA. Results shown on this Signal include manual trades and overall strategic management.
Exp COPYLOT CLIENT for MT5
Vladislav Andruschenko
3.97 (35)
适用于 MetaTrader 5 的专业交易复制器 快速、专业、稳定可靠的 交易复制器 ,适用于 MetaTrader 。 COPYLOT 可在 MT4 和 MT5 终端之间复制 Forex 交易,并支持 Hedge 和 Netting 账户。 COPYLOT 的 MT5 版本支持: - MT5 Hedge → MT5 Hedge - MT5 Hedge → MT5 Netting - MT5 Netting → MT5 Hedge - MT5 Netting → MT5 Netting - MT4 → MT5 Hedge - MT4 → MT5 Netting MT4 版本 完整说明 + DEMO + PDF 如何购买 如何安装 如何获取日志文件 如何测试和优化 Expforex 的所有产品 您也可以将交易复制到 MT4 终端(MT4 → MT4,MT5 → MT4): COPYLOT CLIENT for MT4 COPYLOT 是一款专业的交易和持仓复制器,可同时与 2、3 甚至 10 个终端协同工作。 支持从 模拟账户和投资者账户 复制,也支持同时在多个终端上运行。 您可以使
Trade copier MT5
Alfiya Fazylova
4.61 (56)
Trade Copier 是一种专业实用程序,旨在复制和同步交易账户之间的交易。 复制发生从供应商的帐户/终端到收件人的帐户/终端,安装在同一台计算机或 vps 上。 在购买之前,您可以在演示帐户上测试演示版本。 演示 这里 。 完整说明 这里 。 主要功能和优点: 支持复制MT5>MT5、MT4>MT5、MT5>MT4,包括МТ5 netting账户。 供应商和收件人模式在同一产品中实现。 简单直观的界面,允许您直接从图表中实时控制复制。 连接中断或终端重新启动时不会丢失设置和位置。 允许您选择要复制的符号,也可以替换接收者的符号,例如 EURUSD> USDJPY。 允许为每个符号设置个性化的复制设置。 支持回拷贝。 能够仅复制某些订单。 允许您设置开仓交易价格的最大差异和最大时间延迟。 正确复制部分订单关闭的执行。 计算复制手数的几种方法。 同步止盈和止损。有几种方法可以计算它们的位置。 支持通过执行在“Market account”上工作,其中 SL / TP 仅在开仓后设置。 如何使用简单的设置复制交易 将供应商终端和接收终端安装在同一台计算机或 VPS 上。 在供应商终端上
Power Candles 策略扫描器——自优化多符号设置查找器 Power Candles策略扫描器 采用与Power Candles指标相同的自优化引擎,可同时扫描您“市场观察”中的所有交易品种。一个面板即可显示当前哪些品种在统计上具备交易价值、每种策略的最佳应用方向、最优止损/止盈组合,并在新信号触发时立即向您发送提醒。 本工具是 Stein Investments 生态系统的一部分 - 18+ 款工具,加上 Max,您的一对一 AI 交易导师。  随时在线,深入了解每一款指标,在您需要梳理思路的那一刻就在那里。  立即认识他: https://stein.investments 您的全面市场监控。每个交易品种超过3,000次自动优化。2种警报类型。一键切换图表并采取行动。 为何您需要此工具 大多数多标的扫描器仅展示价格 波动 。每只股票的波动率、百分比变化、RSI。您仍需自行摸索正确的策略、合适的止损位以及理想的入场阈值。Power Candles策略扫描器针对每只股票自动解答这些问题,仅在数学验证过的交易设置中触发实际入场信号时才会向您发出提示。这就是全部卖点。 自动
Signal TradingView to MT5 Pro Automator TradingView 与 MetaTrader 5 之间的即时专业执行 使用最强大的桥梁,将 TradingView 警报与 MT5 中的实际执行连接起来,实现交易策略的自动化。这款 Expert Advisor 专为要求速度、灵活性和完美风险管理的交易者设计,可将任何警报消息转化为精确的市价或限价订单。 优势与特点 通用解析引擎(专有): 先进技术,能够自动识别并提取任何警报格式中的数据。您不再受限于单一的死板格式;系统会自动理解交易品种(Symbol)、操作(Action)、价格(Price)、止损(SL)和止盈(TP)。 实时执行: 极速轮询技术(低于 1 秒),经过优化可将延迟降至最低。接收到信号后,订单将在毫秒内执行。 机构级风险管理: 基于以下方式自动精确计算手数: 净值/余额百分比(% of Equity/Balance): 每笔交易承担固定账户百分比的风险。 风险金额(Risk Amount): 设定在触发止损时损失的固定货币金额(例如:100 美元)。 固定手数(Static Lots)
MT5 to Telegram Signal Provider 是一个易于使用且完全可自定义的工具,它允许向 Telegram 的聊天室、频道或群组发送 指定 的信号,将您的账户变为一个 信号提供商 。 与大多数竞争产品不同,它不使用 DLL 导入。 [ 演示 ] [ 手册 ] [ MT4 版本 ] [ Discord 版本 ] [ Telegram 频道 ]  New: [ Telegram To MT5 ] 设置 提供了逐步的 用户指南 。 不需要了解 Telegram API;开发者提供了您所需的一切。 关键特性 能够自定义发送给订阅者的订单详情 您可以创建分层的订阅模型,例如铜、银、金。其中金订阅获得所有信号等。 通过 id、符号或评论过滤订单 包括执行订单的图表截图 在发送的截图上绘制已关闭的订单,以便额外核实 延迟发送新订单消息的可能性,以便在发送前对位置进行调整 订单详情完全透明: 新的市场订单*带截图 订单修改(止损、获利) 已关闭的订单*带截图 部分关闭的订单** 新的挂单 修改的挂单(进场价格) 挂单激活(作为新的市场订单附加) 已删除的挂单 历史订单报告
Premium Trade Manager - 内置交易导师的图表面板 Premium Trade Manager 将一位交易导师嵌入您的图表,并在其下搭载完整的执行引擎。像往常一样建立交易,然后让您的 AI 交易导师 Max 读取这笔具体的交易,结合您的实时账户给出直接判断,再由您决定是否下单:止损是否符合纪律化交易的要求、风险规模是否合理、高影响新闻事件是否即将发布、您是否接近资金盘限额。其下是完整的执行引擎,负责点击之后的一切:一键按风险下单、您在图表上拖动规划且交易进行中仍可随时调整的计划、最多四个分批止盈级别、七种移动止损方式、实时资金盘合规检查、新闻屏蔽保护,以及对自身成本进行评级的点差功能。决策由您做出。Max 给出第二次审视。面板负责此后的一切。 购买前先亲手体验。 直接在浏览器中点击实时面板,这是在购买前感受其工作方式的最快途径。 stein.investments/products/premium-trade-manager Max 是您的一对一 AI 交易导师,他直接内置于面板之中。  他了解您的账户、您的设置和您的规则,用您自己的语言回答,并在每笔交易下单前进
HINN MagicEntry Extra
ALGOFLOW OÜ
4.74 (19)
HINN MAGIC ENTRY – the ultimate tool for entry and position management! SIMPLE. FASTEST. INTUITIVE. MAX AUTOMATED. Place orders by selecting a level directly on the chart! full description   ::  demo-version  :: 60-sec-video-description Key features: - Market, limit, and pending orders - Automatic lot size calculation - Automatic spread and commission accounting - Unlimited partitial take-profits  - Breakeven and trailing stop-loss and take-profit  functions - Invalidation leves - Intuitive, a
EA Overfitter
Stephen J Martret
5 (1)
回测看起来很漂亮。但它明天、下周、下个月还能继续赚钱吗? EA Overfitter 让您的 EA 在 100 段它从未见过的价格历史上重新运行。一个分数告诉您这个优势是否真实。 回测告诉您的,是 EA 在某一段价格历史上的表现——那段恰好发生过的历史。您无法从中判断,这个结果有多少来自策略本身,又有多少只是那一条特定路径带来的。 EA Overfitter 回答的正是这个问题。它构建最多 100 段您的 EA 从未交易过的合成价格历史,让策略在全部这些历史上重新运行,并展示它所产生的完整结果区间。您得到的不再是一条幸运或不幸路径上的单个数字,而是一幅真实的图景:策略在陌生数据上多久能赚钱、典型结果是什么样(而不是最好的那一次),以及您的回测离它有多远。 这些世界是由您自己的近期历史重建而成,因此这不是预测——任何从历史数据出发的检验都不可能是预测。它告诉您的是:这个优势是否依赖于价格的某一种特定排列,以及回测数字距离典型结果有多远。在投入资金之前,这才是值得回答的问题。 三个步骤 1. 构建。在图表上选择时间区间和世界数量,然后按 Build。EA Overfitter 会
购买后请联系我,以获取完整手册包 + 3天 OpenAI API 试用,用于测试 AI 功能 + 另一份额外奖励 当前价格为八月重新发布更新的限时折扣价——请在价格上涨前立即锁定您的版本。 下一阶段价格:$340 这与您尝试过或在市场上见过的任何交易面板都完全不同。这是目前零售市场上最具创新性的 AI 驱动交易面板之一。 想象一下,将   AI 直接连接到您的图表   ——获取 AI 建议、账户审计、接收 AI 交易信号,并通过一次点击执行交易。 想象一下,通过 Telegram 在手机上管理您的   整个交易账户   ——与 AI 聊天、接收即时提醒、管理交易,并随时随地保护您的账户。 想象一下,运行   多个 EA   ,并能够分别监控每个 EA 的表现、管理其交易,或直接通过智能手机关闭特定仓位。 想象一下,您拥有一个   内置风险规划器   ,可以随时准备在图表上直接执行任何交易想法。 想象更多,更多……这一切都可以通过这款面板实现。 我们打造它的目标远不止是一款交易面板——它是一个   完整的交易套件、交易助手和 AI 导师,集于一体。 AI Desk 一个真正能够看到您账
Footprint Chart Pro — Professional OrderFlow EA for MetaTrader 5 Version 6.34 | Professional tool for real traders | Institutional-Grade Visualization DEMO USERS - PLEASE SELECT EVERY TICK / REAL TICK WHEN TESTING AND YOU HAVE DOWNLOADED HISTORICAL DATA. IF YOU SEE A WAITING SCREEN AND IT IS NOT DOWNLOADING, IT MEANS YOU HAVE LOW HISTORICAL DATA. TRY 1 MIN AND 5 MIN FIRST ON 1 DAY DATA. ONE DAY DATA SHOULD BE THE NEWEST AND MOST CURRENT DATE. PLEASE WAIT UNTIL THE MARKET HAS ROLLED OVER PERIOD.
EA Slipstream
Stephen J Martret
5 (1)
EA Slipstream — MQL5 市场产品说明(简体中文) 您的回测按照 EA 要求的价格成交了每一笔订单,您的账户却不会。 EA Slipstream 使用您自己的成交价、滑点和点差,衡量执行成本对 EA 的影响,呈现 EA 的真实表现。 回测按 EA 指定的价位计算每一笔交易。而在实盘中,挂单会按触发瞬间可获得的价格成交,止损会在行情触及时的位置平仓,当时的点差就是账户当时的报价。这两者之间的差异既不是观点,也不是模型——它已经记录在您的 EA 所下的订单里,也记录在您终端保存的价格历史里。 EA Slipstream 同时读取两者。它衡量您的账户在成交时让出了多少,每笔交易开仓那一分钟的点差是多少,以及重要新闻发布后的几秒内点差发生了什么变化。随后,它把这些测量结果应用到交易本身:既包括已在您账户上运行的 EA,也包括您加载的任意一份策略测试器报告。结果是同一个 EA 的第二次呈现——按您自己的执行条件计价,而不是按完美成交计价。 执行条件因账户而异,也因交易品种而异。本工具不对其做优劣评判,也不比较不同的服务提供方。它衡量的是您的账户实际发生了什么,并显示这对策略意味着
Trade Manager DaneTrades
Levi Dane Benjamin
4.23 (30)
交易管理器可帮助您快速进入和退出交易,同时自动计算风险。 包括帮助您防止过度交易、报复性交易和情绪化交易的功能。 交易可以自动管理,账户绩效指标可以在图表中可视化。 这些功能使该面板成为所有手动交易者的理想选择,并有助于增强 MetaTrader 5 平台。多语言支持。 MT4版本  |  用户指南+演示 交易经理在策略测试器中不起作用。 如需演示,请参阅用户指南 风险管理 根据%或$自动调整风险 可选择使用固定手数或根据交易量和点自动计算手数 使用 RR、点数或价格设置盈亏平衡止损 追踪止损设置 最大每日损失百分比,在达到目标时自动平仓所有交易。 保护账户免遭过多提款并阻止您过度交易 最大每日损失(以美元为单位)在达到目标时自动关闭所有交易。 保护账户免遭过多提款并阻止您过度交易 一键实现所有交易的盈亏平衡 自动计算从手机/电话发送的交易的风险 OCO 在设置中可用 交易和头寸管理 通过设置每月、每周、每天、每小时或每分钟的最大交易次数,停止过度交易和报复性交易。 高级挂单管理。 调整何时关闭挂单的规则 追踪挂单 支持市价订单和挂单 每日最大利润目标(以美元为单位)以确保头寸并停止
Telegram To MT5 Ultra
Mirel Daniel Gheonu
5 (5)
Telegram To MT5 — 信号复制器 将您的 Telegram 频道中的交易信号变成真实的 MT5 订单 — 自动执行,可用于任意数量的账户,风险与规则完全由您掌控。 Telegram To MT5 将您已在 Telegram 关注的 VIP / 信号频道连接到您的 MetaTrader 5 终端。一个免费的配套桌面应用读取消息(即使是禁止机器人的频道),而本 EA 在您的账户上执行这些信号 — 应用您自己的风险设置、品种映射、止盈处理、交易时段与新闻过滤。 它是一个信号复制器,而非黑箱策略:由您决定信任哪些频道,以及每笔交易如何计算手数和管理。 分步设置与配套应用安装指南 工作原理 [您的 Telegram 频道] -> [配套桌面应用] -> [MT5 + 本 EA] -> 订单 配套桌面应用(免费,已包含)使用您的 Telegram 账户登录并监视您所选择的频道。即使是禁止机器人的 VIP 频道也能正常工作,它通过一个私有、加密的本地桥接转发每条消息。 本 EA 挂在一个图表上,在 MT5 接收这些信号,并按照您的规则开仓 / 管理交易。 应用与 EA 之间的连接是位于
Dynamic Fibonacci Grid
Tsvetan Tsvetanov
5 (1)
推出最新版本的 MT5 动态斐波那契网格仪表盘(Dynamic Fibonacci Grid Dashboard)。 全新版本配备了众多新功能,为您的交易体验带来彻底升级,并让您从全新的角度观察市场和价格行为。通过同时分析多个时间周期和多个交易品种,探索更多可能性。界面友好,支持手动交易和持仓管理,并大幅扩展了预设自动化策略的应用能力。此外,DFG 现在在策略测试器中可作为交易模拟器全面运行,您可以使用历史数据重现不同的交易环境。在可视化模式中练习手动交易,在高速模式中测试自动化策略。 主要功能 • 基于动态斐波那契通道(Dynamic Fibonacci Bands)的多周期、多品种高级技术分析。 通过我们的实时市场监控仪表盘,体验前所未有的高效分析能力。我们将来自 M1、M5、M15 和 H1 图表的复杂数据合成为易于理解的网格水平。这种独特呈现方式让交易者能够在同一个屏幕上监控 10 个不同品种的价格行为,而无需依赖传统图表。结果是更快速的决策过程,以及更简洁、不杂乱的交易环境。 • 可自定义且用户友好的界面,集成最重要的功能。 包括账户状态与信息、快捷手动交易与持仓管理按
Trade Indicator Assistant   is a powerful MT5 utility designed to turn indicators into automated trading systems. Its main feature is the ability to automatically detect an indicator’s   BUY and SELL signal buffers , without requiring you to know the buffer numbers, search through indicator settings, or modify the indicator source code. Bonus Indicator:   After purchasing Trade Indicator Assistant, contact me to receive   Trade Signal Pro   completely free as a bonus indicator. [Download Demo V

Welcome to ENTRY IN THE ZONE AND SMC MULTI TIMEFRAME Entry In The Zone and SMC Multi Timeframe is a real-time market analysis tool based on Smart Money Concepts (SMC), designed to analyze market structure, price direction, and key trading zones. It supports both Single-Timeframe Analysis and Multi-Timeframe Analysis, providing a clearer view of the overall market structure across multiple timeframes, with real-time BUY / SELL signals that do not repaint. It is designed to help filter trading opp
Grid Manual MT5
Alfiya Fazylova
4.73 (22)
Grid Manual是一个交易面板,用于处理订单网格。 该实用程序是通用的,具有灵活的设置和直观的界面。 它不仅可以在亏损方向上设置订单网格,还可以在盈利方向上设置订单网格。 交易者不需要创建和维护订单网格,实用程序会这样做。 打开一个订单就足够了,Grid manual会自动为它创建一个订单网格,并伴随它直到非常关闭。 完整说明和演示版 此處 。 该实用程序的主要特性和功能: 伴隨以任何方式打開的訂單,包括從移動終端打開的訂單。 適用於兩種類型的網格:“限制”和“停止”。 使用兩種方法計算網格間距:固定和動態(基於 ATR 指標)。 允許您更改未結訂單網格的設置。 顯示圖表上每個網格的盈虧平衡水平。 顯示每個網格的利潤率。 允許您一鍵關閉網格中的盈利訂單。 讓您一鍵關閉每個訂單網格。 允許您對訂單網格應用追踪止損功能。 允許您在訂單網格上應用將訂單網格的止損轉移到盈虧平衡水平的功能。 相對於訂單網格的盈虧平衡水平自動重新排列止盈(僅在限價網格模式下,距離取決於所選的計算類型:“保守”或“激進”)。 最多可管理 20 個訂單網格,每個網格最多可包含 100 個訂單。 計算初始手數時,
DrawDown Limiter
Haidar Lionel Haj Ali
5 (22)
DrawDown Limiter v5.0 — 高级账户保护控制器 DrawDown Limiter v5.0 是一款运行于客户端的交易账户保护控制器,用于监控您的交易账户,并在达到您所设定的风险、盈利、新闻、时间计划、Rollover 或持仓数量限制时自动采取相应措施。 它可以通过一个独立图表监控 手动交易、自动化策略、多个 EA、挂单以及浮动持仓 。它既可以保护整个交易账户,也可以通过 Magic Number 仅监控特定 EA 或一组 EA。 DrawDown Limiter 的目的不仅仅是显示回撤,而是 主动执行您设定的交易规则 ,并在保护条件保持有效期间持续执行这些规则。 DrawDown Limiter v5.0 不仅用于监控您的亏损程度,还用于控制策略何时可以继续运行、哪些风险敞口可以保留、何时必须停止交易,以及自动化交易环境何时可以安全恢复运行。 需要帮助或有任何问题?  请查看   DrawDown Limiter 用户指南 我是  Lio ,欢迎随时联系我!  我们始终愿意为您解答问题、提供帮助并持续改进产品。 统一的保护系统 DrawDown Limiter v
Exp5 Duplicator
Vladislav Andruschenko
4.78 (9)
Duplicator for MetaTrader 5 —— 单终端内的专业持仓复制系统 这是一款面向专业交易者的可靠 Expert Advisor,用于在 MetaTrader 5 中自动复制已经打开的持仓、放大总仓位、应用自定义手数规则,并按照明确的逻辑管理复制出来的持仓。 它非常适合手动交易者、自动化系统使用者,以及希望在同一个终端内更灵活地管理已有持仓的用户。 Duplicator for MT5 并不会依靠自己的交易策略主动开仓。它的职责是监控 MetaTrader 5 账户中已经存在的持仓,并根据你的设置创建对应副本,包括复制次数、手数、Stop Loss、Take Profit、注释以及额外的管理条件。 如果你需要的是 同一个 MetaTrader 5 终端内部 的持仓复制工具,而不是不同平台或不同终端之间的复制系统,那么 MT5 版 Duplicator 正是为这种需求而设计。 MT4 版本 详细描述 + DEMO + PDF 如何购买 如何安装 如何获取日志文件 如何测试和优化 Expforex 的所有产品 链接 如果你需要 MetaTrader 终端之间 的交易复
Seconds Chart MT5
Boris Sedov
4.61 (18)
秒级图表 (Seconds Chart) - 一款专为 MetaTrader 5 设计的独特工具,用于创建秒级时间框架的图表。 通过 秒级图表 ,您可以构建以秒为单位的时间框架图表,获得标准分钟或小时图表无法提供的极致灵活性和分析精度。例如,时间框架 S15 表示每根蜡烛图持续15秒。您可以使用任何支持自定义交易品种的指标和EA交易系统。操作它们就像在标准图表上交易一样方便。 与标准工具不同, 秒级图表 让您能够在超短时间框架下进行高精度交易,无延迟干扰。 免费演示版: Seconds Chart v2.29 Demo.ex5 下载免费演示版,亲自体验: 功能齐全 - 所有功能均可使用 24小时测试 - 足够评估准确性和便利性 仅限模拟账户 - 大多数经纪商均可轻松开立 仅限GBPCAD图表 - 大多数终端均可使用 这些限制仅适用于演示版。完整版适用于任何账户类型(真实、演示、竞赛)和任何图表(XAUUSD、EURUSD 等),无任何限制。 如何安装演示版 通过上方链接下载演示文件 打开MetaTrader -> 文件 -> 打开数据文件夹 -> MQL5 -> Experts 将下
Multi Account Local Trade Copier 是一款快速的 MetaTrader 本地跟单工具:在同一台 Windows 电脑或 VPS 上的 MT4/MT5 终端之间复制交易,从一个主账户复制到多个接收账户 —— 您自己的真实、模拟和自营公司账户,同一经纪商或不同经纪商均可。它是 事件驱动 的:主终端在每笔交易发生的瞬间立即发布,接收端会 测量并记录每一笔复制的真实延迟 — 通常为 50-150 毫秒 。无 DLL,无网络桥接,无配置文件。 一个 EA,两种模式 在源终端上以 MASTER 模式挂载,在每个目标终端上以 RECEIVER 模式挂载。使用 Master ID = AUTO 时,接收端会自动找到活跃的主终端:拖入图表即可。一个主终端可以供给 无限个接收端 ,一个终端可以运行多个接收端,甚至同一个终端可以同时充当主终端和接收端。 每个接收端都有自己独立的设置 :一个按风险 % 复制,另一个按余额比例,另一个反向复制 — 资金管理始终在接收端完成。与 Multi Account Local Trade Copier MT4 配合可覆盖全部四种组合:MT5>
作者的更多信息
Gold VWAP Drift
Ubaldo Barranco Jimenez
Gold VWAP Drift is a complete, self-contained trading system for XAUUSD , engineered around one of the most reliable structural relationships in intraday gold: the interaction between price, the session Volume-Weighted Average Price, and a dynamic trend filter. It does not chase breakouts and it does not guess tops or bottoms. It waits for the market to show its hand, then acts with precision. The system establishes a clear directional bias using a long-term trend filter, then engages only when
FREE
DriftLock ETH
Ubaldo Barranco Jimenez
Cross-Asset Order Flow EA: Automated ETHUSD Trading on H1 In Plain Language If you've never used an EA (Expert Advisor) before: this is a program that watches the market and places trades on your MT5 account automatically, following one fixed strategy, without you having to sit and watch charts. DriftLock ETH uses a cross-asset approach : Bitcoin acts as an external source of market information, while ETHUSD is the asset actually traded by the EA. The EA continuously evaluates market conditions
FREE
Gold StairStep Pro
Ubaldo Barranco Jimenez
GOLD STAIRSTEP PRO An Automated, Institutional-Grade System Built for Disciplined Market Execution Gold StairStep Pro is an automated trading solution engineered for traders who demand precision, structural confluence, and strict risk parameters in high-volatility environments. Tailored specifically for XAUUSD on the M5 timeframe , the system constantly evaluates price behavior through four proprietary multi-layer market filters: structural trend regimes, momentum expansion, short-term positioni
FREE
Native Session Volume
Ubaldo Barranco Jimenez
Native Session Volume Splits traded volume by trading session: Asia, London, the London/New York overlap, New York, and everything outside those windows. Free tools that show session times only paint a coloured box on the chart. None of them tell you how much volume actually happened inside each session, because MetaTrader 4 never had real volume at all. MetaTrader 5 does, and this indicator uses it. WHAT IT SHOWS A histogram in a sub-window, one bar per candle, coloured by the session it fal
FREE
Native Spread Monitor
Ubaldo Barranco Jimenez
Native Spread Monitor answers a simple question: is the spread you are being charged right now normal for this hour of the day, or are you about to overpay? Every free spread tool shows the CURRENT spread. None of them show what is typical for this hour, because MetaTrader 4 never kept per-bar spread history. MetaTrader 5 does, and this indicator uses it. HOW TO USE IT 1. Drag the indicator onto any chart. A panel appears in the bottom-left corner (you can move it to another corner in the set
FREE
Native Account Stats
Ubaldo Barranco Jimenez
Native Account Stats breaks your own closed-trade history down by symbol, by hour of day and by weekday, with profit factor, win rate, expectancy and the drawdown of the closed-trade equity curve. Trades are reconstructed from MT5 deals, so deposits, credits and corrections never count as winning trades. WHAT IT SHOWS A panel on the chart reports: Trades, net result, profit factor, win rate, expectancy and max drawdown Average win, average loss, largest win, largest loss A breakdown by symbol
FREE
Crypto Triangle Pro
Ubaldo Barranco Jimenez
Crypto Triangle Pro is a fully automated ETHUSD trading system built around cross-market confirmation. Instead of relying on Ethereum price action alone, the system evaluates Ethereum together with Bitcoin and Solana to determine whether the broader crypto market is supporting the same directional regime. The system establishes a directional bias on Ethereum, then requires confirmation from Bitcoin and Solana before opening a position. A trade is taken only when the three-asset structure is alig
筛选:
classicaltrading
374
classicaltrading 2026.09.16 07:35 
 

用户没有留下任何评级信息

Ubaldo Barranco Jimenez
901
来自开发人员的回复 Ubaldo Barranco Jimenez 2026.09.17 00:09
Thanks a lot. If you've got any comments or suggestions, feel free to share them, happy to look at including them in the next version.
回复评论