The Cube Bars Brasil
- インディケータ
- バージョン: 1.0
- アクティベーション: 5

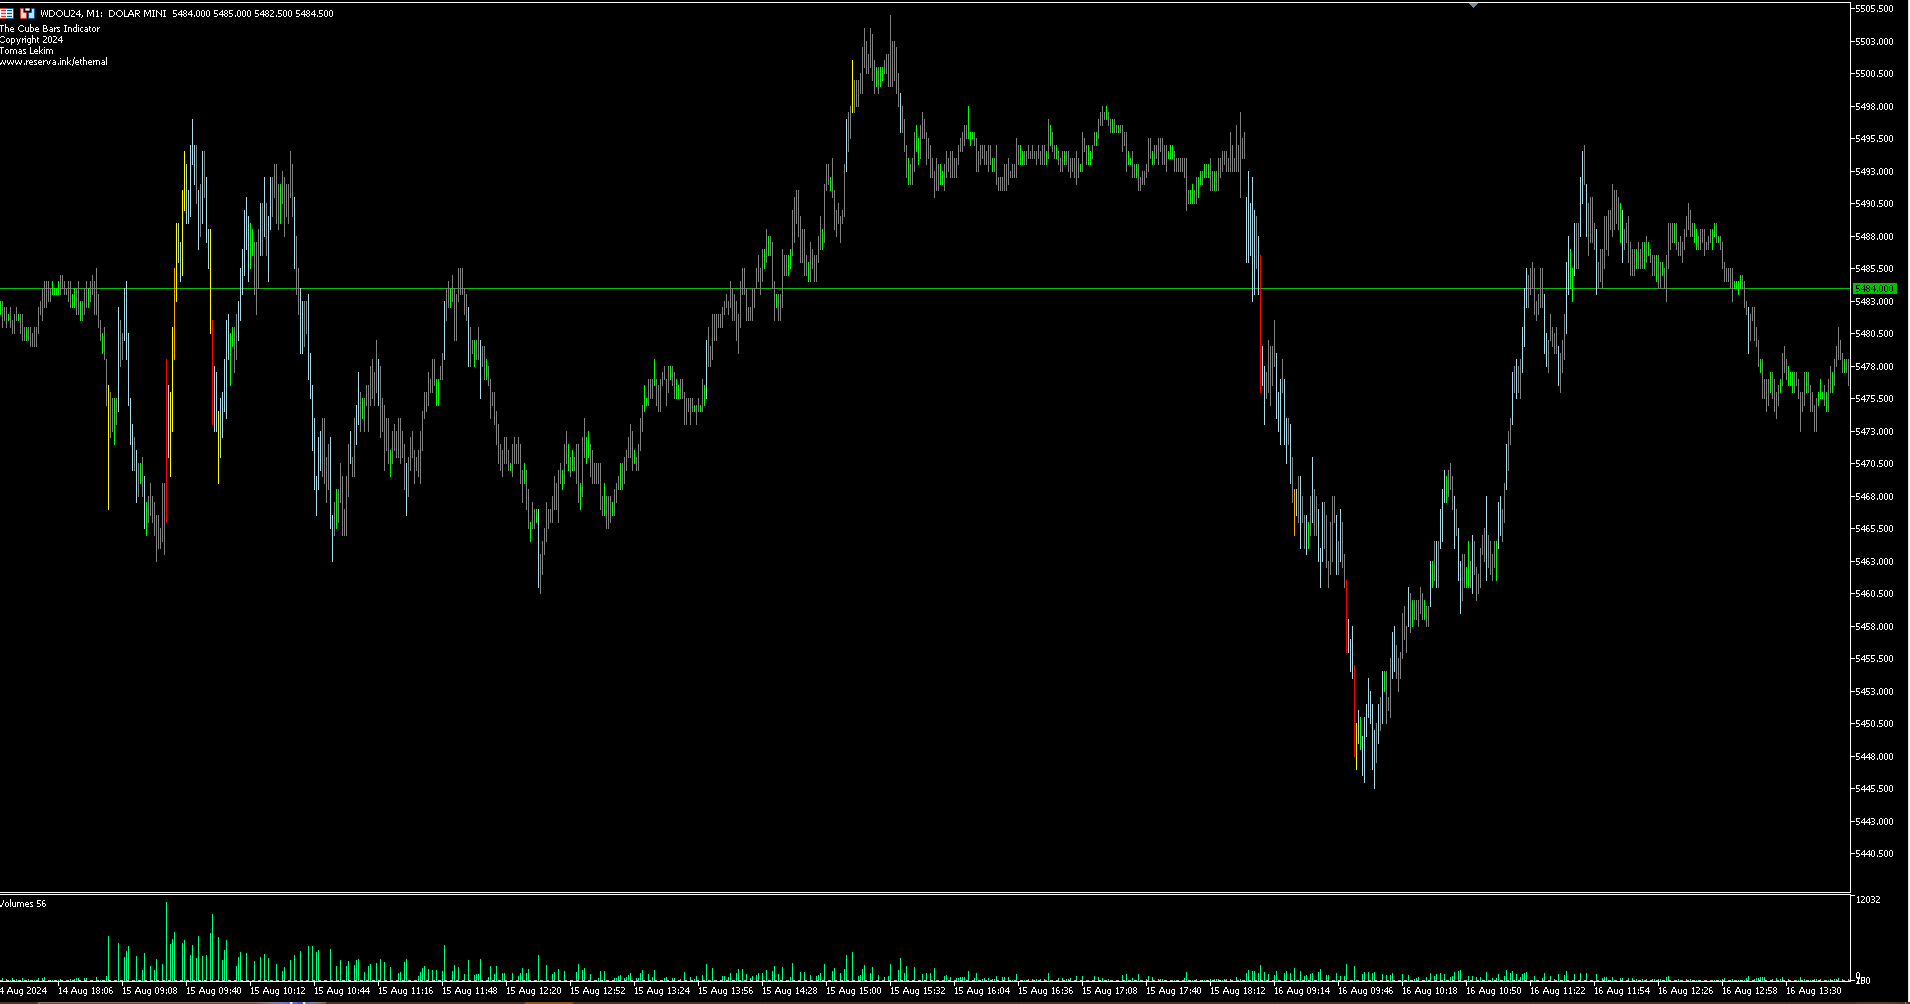
TheCubeBars - Colored Volume Indicator for MetaTrader 5
📌 Full Description
🔥 What is TheCubeBars?
TheCubeBars is a revolutionary indicator that transforms volume visualization in MetaTrader 5, coloring candles according to the intensity of tick volume. Developed by Ethernal, it offers:
Instant visualization of volume strength in each candle
📌 Testimonials
"After I started using TheCubeBars, my breakout hit rate improved by 40%!" - Ricardo F., Professional Trader
"Finally a volume indicator that really works in MT5!" - Juliana M., Investor
🚨 Disclaimer
Does not guarantee profits
Recommended to test on a demo account
Always use risk management
TheCubeBars - See the Volume, Master the Market! 📊🔴🟠🟡🔵
(Ready for sales! Adapt prices and payment methods as needed.)