KD HTF Candles
- インディケータ
-
Dien Du Khanh Duong
 KD Trading System: Trade with context. Read structure. Confirm across timeframes. Plan the risk.
==================================================================================== - バージョン: 1.0
KD HTF Candles projects transparent higher-timeframe candle bodies and wicks (e.g., H1/H4) directly onto your lower-timeframe chart, allowing you to view higher-timeframe candlestick patterns while trading a lower timeframe.
Reviewing a higher-timeframe candle typically requires switching charts, which can interrupt focus on the execution timeframe. This tool displays the higher-timeframe candle directly on the lower-timeframe chart.
Key Features
- Transparent HTF Overlay: Semi-transparent higher-timeframe candle bodies/wicks plotted over your execution chart.
- Live-Forming Candle Preview: View the current higher-timeframe candle as it forms.
- Multi-Timeframe Pattern Recognition: View engulfing bars, pin bars and other candlestick patterns at the higher-timeframe level while trading a lower timeframe.
- Adjustable Transparency & Color: Adjust opacity so the overlay does not obstruct your execution-timeframe price action.
- Selectable HTF Anchor: Choose any higher timeframe independent of your chart's own timeframe.
Synergy with the KD Trading System
KD HTF Candles is the 6th pillar — a higher-timeframe candlestick reference:
- KD Ultimate SMC: Its structure zones can be reviewed alongside a higher-timeframe candlestick pattern from this tool forming at the same level.
- KD SMC Mini Charts: The higher-timeframe slot and this tool's overlay can be cross-checked for the same candle behavior.
- KD Auto SLTP: A higher-timeframe rejection wick shown by this tool can help inform a structural invalidation point for the stop.
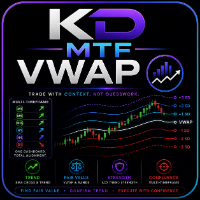
- KD MTF VWAP: A higher-timeframe engulfing candle at a Standard Deviation band is one additional factor some traders consider for a mean-reversion setup.
- KD MTF Candle Timer: Shows when the projected higher-timeframe candle shown by this tool will close.
- KD HTF Candles (This Tool): Projects the higher-timeframe candle directly onto your execution chart.
- KD MTF Dashboard: Can be used to check whether the trend behind an observed HTF candle is strong before that candle is given weight.
Practical Use Cases
Use Case 1: Reviewing a Higher-Timeframe Candle at a Key SMC Zone
- Setup: Price reaches an Order Block or liquidity pool identified by KD Ultimate SMC.
- In practice: An H4 pin bar or engulfing candle forming at that zone is visible directly on your M15 chart via this tool, providing an additional data point to consider alongside the structure.
Use Case 2: Tracking Higher-Timeframe Candle Development
- Setup: The higher-timeframe candle overlay shows a large-bodied candle still forming.
- In practice: Some traders use this to monitor whether the higher-timeframe candle continues to develop in a given direction while managing a position on the lower timeframe.
User Settings & Customization
- Select the higher timeframe to project (independent of chart timeframe).
- Adjust body/wick opacity and border color.
- Toggle live-forming candle preview on/off.
- Offset overlay position to avoid obstructing price action.