KD HTF Candles
- Indicateurs
-
Dien Du Khanh Duong
 KD Trading System: Trade with context. Read structure. Confirm across timeframes. Plan the risk.
==================================================================================== - Version: 1.1
- Mise à jour: 23 septembre 2026
KD HTF Candles projects transparent higher-timeframe candle bodies and wicks (e.g. M15/H1) directly onto your lower-timeframe chart, allowing you to view higher-timeframe candlestick patterns while trading a lower timeframe.
Reviewing a higher-timeframe candle typically requires switching charts, which can interrupt focus on the execution timeframe. This tool displays the higher-timeframe candle directly on the lower-timeframe chart.
Key Features
- Transparent HTF Overlay: Semi-transparent higher-timeframe candle bodies/wicks plotted over your execution chart.
- Live-Forming Candle Preview: View the current higher-timeframe candle as it forms.
- Multi-Timeframe Pattern Recognition: View engulfing bars, pin bars and other candlestick patterns at the higher-timeframe level while trading a lower timeframe.
- Adjustable Transparency & Color: Adjust opacity so the overlay does not obstruct your execution-timeframe price action.
- Selectable HTF Anchor: Choose any higher timeframe independent of your chart's own timeframe.
Synergy with the KD Trading System
KD HTF Candles is the 6th pillar — a higher-timeframe candlestick reference:
- KD Ultimate SMC: Its structure zones can be reviewed alongside a higher-timeframe candlestick pattern from this tool forming at the same level.
- KD SMC Mini Charts: The higher-timeframe slot and this tool's overlay can be cross-checked for the same candle behavior.
- KD Auto SLTP: A higher-timeframe rejection wick shown by this tool can help inform a structural invalidation point for the stop.
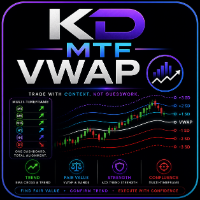
- KD MTF VWAP: A higher-timeframe engulfing candle at a Standard Deviation band is one additional factor some traders consider for a mean-reversion setup.
- KD MTF Candle Timer: Shows when the projected higher-timeframe candle shown by this tool will close.
- KD HTF Candles (This Tool): Projects the higher-timeframe candle directly onto your execution chart.
- KD MTF Dashboard: Can be used to check whether the trend behind an observed HTF candle is strong before that candle is given weight.
Practical Use Cases
Use Case 1: Refining M1 Entries with Higher-Timeframe Context
- Scenario: You trade primarily on M15 and use M1 for precise scalping entries, while H1 provides the higher-timeframe context to identify nearby support and resistance.
- How to use it: Project the M15 and/or H1 candle directly onto your M1 chart. This lets you fine-tune entries on M1 while seeing how price is developing within the higher-timeframe candle.
- What to observe: Watch the HTF candle body and wicks for expansion or rejection as M1 price approaches nearby M15/H1 support, resistance, or structure — without repeatedly switching timeframes.
Use Case 2: Combining HTF Candles with Multi-Timeframe SMC Context
- Scenario: You want precise M1 entry timing while keeping your primary M15 structure and broader H1 context visible at the same time.
- How to use it: Project an M15 or H1 candle onto the M1 chart and use KD SMC Mini Charts to keep M15/H1 market structure visible alongside your execution chart.
- What to observe: KD HTF Candles shows how the higher-timeframe candle is developing, while the Mini Charts provide structure, zones, support and resistance across M15/H1. Together, they give you both precise M1 price action and broader market context in one workspace.
Use Case 3: Multi-Timeframe Backtesting with M1 Entry Precision
- Scenario: You are visually backtesting with KD Trade Panel or practicing a strategy where M15 provides the main trading context and M1 is used to refine entries.
- How to use it: Keep M1 as your execution chart, project M15 or H1 candles with KD HTF Candles, and optionally use KD SMC Mini Charts to monitor M15/H1 structure within the same Strategy Tester workspace.
- What to observe: Review each historical setup with three layers of information: precise M1 price action, the developing M15/H1 candle, and broader M15/H1 market structure. This helps you study entry timing while remaining aware of nearby higher-timeframe support, resistance, and structural areas.
User Settings & Customization
- Select the higher timeframe to project (independent of chart timeframe).
- Adjust body/wick opacity and border color.
- Toggle live-forming candle preview on/off.
- Offset overlay position to avoid obstructing price action.