KD HTF Candles

  • Indicatori
  • Dien Du Khanh Duong
    Dien Du Khanh Duong
    KD Trading System: Trade with context. Read structure. Confirm across timeframes. Plan the risk.
    ====================================================================================
  • Versione: 1.1
  • Aggiornato: 23 settembre 2026

KD HTF Candles projects transparent higher-timeframe candle bodies and wicks (e.g. M15/H1) directly onto your lower-timeframe chart, allowing you to view higher-timeframe candlestick patterns while trading a lower timeframe.

Reviewing a higher-timeframe candle typically requires switching charts, which can interrupt focus on the execution timeframe. This tool displays the higher-timeframe candle directly on the lower-timeframe chart.

Key Features

  • Transparent HTF Overlay: Semi-transparent higher-timeframe candle bodies/wicks plotted over your execution chart.
  • Live-Forming Candle Preview: View the current higher-timeframe candle as it forms.
  • Multi-Timeframe Pattern Recognition: View engulfing bars, pin bars and other candlestick patterns at the higher-timeframe level while trading a lower timeframe.
  • Adjustable Transparency & Color: Adjust opacity so the overlay does not obstruct your execution-timeframe price action.
  • Selectable HTF Anchor: Choose any higher timeframe independent of your chart's own timeframe.

Synergy with the KD Trading System

KD HTF Candles is the 6th pillar — a higher-timeframe candlestick reference:

  1. KD Ultimate SMC: Its structure zones can be reviewed alongside a higher-timeframe candlestick pattern from this tool forming at the same level.
  2. KD SMC Mini Charts: The higher-timeframe slot and this tool's overlay can be cross-checked for the same candle behavior.
  3. KD Auto SLTP: A higher-timeframe rejection wick shown by this tool can help inform a structural invalidation point for the stop.
  4. KD MTF VWAP: A higher-timeframe engulfing candle at a Standard Deviation band is one additional factor some traders consider for a mean-reversion setup.
  5. KD MTF Candle Timer: Shows when the projected higher-timeframe candle shown by this tool will close.
  6. KD HTF Candles (This Tool): Projects the higher-timeframe candle directly onto your execution chart.
  7. KD MTF Dashboard: Can be used to check whether the trend behind an observed HTF candle is strong before that candle is given weight.

Practical Use Cases

Use Case 1: Refining M1 Entries with Higher-Timeframe Context

  • Scenario: You trade primarily on M15 and use M1 for precise scalping entries, while H1 provides the higher-timeframe context to identify nearby support and resistance.
  • How to use it: Project the M15 and/or H1 candle directly onto your M1 chart. This lets you fine-tune entries on M1 while seeing how price is developing within the higher-timeframe candle.
  • What to observe: Watch the HTF candle body and wicks for expansion or rejection as M1 price approaches nearby M15/H1 support, resistance, or structure — without repeatedly switching timeframes.

Use Case 2: Combining HTF Candles with Multi-Timeframe SMC Context

  • Scenario: You want precise M1 entry timing while keeping your primary M15 structure and broader H1 context visible at the same time.
  • How to use it: Project an M15 or H1 candle onto the M1 chart and use KD SMC Mini Charts to keep M15/H1 market structure visible alongside your execution chart.
  • What to observe: KD HTF Candles shows how the higher-timeframe candle is developing, while the Mini Charts provide structure, zones, support and resistance across M15/H1. Together, they give you both precise M1 price action and broader market context in one workspace.

Use Case 3: Multi-Timeframe Backtesting with M1 Entry Precision

  • Scenario: You are visually backtesting with KD Trade Panel or practicing a strategy where M15 provides the main trading context and M1 is used to refine entries.
  • How to use it: Keep M1 as your execution chart, project M15 or H1 candles with KD HTF Candles, and optionally use KD SMC Mini Charts to monitor M15/H1 structure within the same Strategy Tester workspace.
  • What to observe: Review each historical setup with three layers of information: precise M1 price action, the developing M15/H1 candle, and broader M15/H1 market structure. This helps you study entry timing while remaining aware of nearby higher-timeframe support, resistance, and structural areas.

    User Settings & Customization

    • Select the higher timeframe to project (independent of chart timeframe).
    • Adjust body/wick opacity and border color.
    • Toggle live-forming candle preview on/off.
    • Offset overlay position to avoid obstructing price action.
    Prodotti consigliati
    The Sessions and Bar Time indicator is a professional utility tool designed to enhance your trading awareness and timing precision on any chart. It combines two key features every trader needs — market session visualization and real-time bar countdown — in one clean, efficient display. Key Features: Candle Countdown Timer – Shows the remaining time before the current candle closes, helping you anticipate new bar formations. Market Session Display – Automatically highlights the four main trading
    FREE
    RAD CRITICAL LEVES RAD indicator tracks “Relevant Volume” in real time, identifying accumulation and distribution processes, projecting them in the chart as SUPPORT or RESISTANCE zones. Natural   support   and resistance levels are generated by Volume Accumulation and Distribution processes. As these processes evolve, levels at which the relevant volume in the market place is positioned, become difficult areas to cross upwards or downwards. By using this information, traders can identify very s
    Time And Sales Layout indicator shows traded buy and sell volumes right on the chart. It provides a graphical representation of most important events in the time and sales table. The indicator downloads and processes a history of real trade ticks. Depending from selected depth of history, the process may take quite some time. During history processing the indicator displays a comment with progress percentage. When the history is processed, the indicator starts analyzing ticks in real time. The l
    Was: $249  Now: $99   Market Profile defines a number of day types that can help the trader to determine market behaviour. A key feature is the Value Area, representing the range of price action where 70% of trading took place. Understanding the Value Area can give traders valuable insight into market direction and establish the higher odds trade. It is an excellent addition to any system you may be using. Inspired by Jim Dalton’s book “Mind Over Markets”, this indicator is designed to suit the
    La Master Edition è uno strumento analitico di livello professionale progettato per visualizzare la struttura del mercato attraverso l'obiettivo del volume e del flusso di denaro. A differenza degli indicatori di volume standard, questo strumento visualizza un Profilo di Volume Giornaliero direttamente sul tuo grafico, permettendoti di vedere esattamente dove si è verificata la scoperta dei prezzi e dove è posizionato il "denaro intelligente". Questa Master Edition è progettata per chiarezza e v
    BoxChart MT5
    Evgeny Shevtsov
    5 (7)
    The market is unfair if only because 10% of participants manage 90% of funds. An ordinary trader has slim changes to stand against these "vultures". This problem can be solved. You just need to be among these 10%, learn to predict their intentions and move with them. Volume is the only preemptive factor that faultlessly works on any timeframe and symbol. First, the volume appears and is accumulated, and only then the price moves. The price moves from one volume to another. Areas of volume accumu
    L'indicatore costruisce le quotazioni attuali, che possono essere confrontate con quelle storiche e su questa base fanno una previsione del movimento dei prezzi. L'indicatore ha un campo di testo per una rapida navigazione fino alla data desiderata. Opzioni: Simbolo - selezione del simbolo che visualizzerà l'indicatore; SymbolPeriod - selezione del periodo da cui l'indicatore prenderà i dati; IndicatorColor - colore dell'indicatore; HorisontalShift - spostamento delle virgolette disegnate d
    Bastion Sentinel Core
    Matthew David Cracknell
    Bastion Sentinel Core — Daily Zones, 4-Hour Rejection Signals Overview Bastion Sentinel Core identifies supply and demand zones on the Daily timeframe — price levels where the market has previously attempted to break through and failed — and marks non-repainting BUY/SELL arrows when price re-tests and rejects those zones on the 4-Hour timeframe. Timeframes are fixed in this edition: zones are always mapped from Daily, and rejections are always confirmed on the 4-Hour close.  This is an analysis
    Forex Volume MT5
    KEENBASE SOFTWARE SOLUTIONS
    KT Forex Volume mostra il volume di acquisto e vendita di una coppia di valute sotto forma di istogramma colorato. Il volume è composto dalle transazioni di acquisto e vendita su un asset. Nel mercato Forex: Se il volume di acquisto supera quello di vendita, il prezzo della coppia di valute tende a salire. Se il volume di vendita supera quello di acquisto, il prezzo della coppia di valute tende a scendere. Caratteristiche Evita operazioni sbagliate confermandole con i dati di volume per tick. T
    What if you could finally SEE where the market really wants to go? Most traders watch price. Pros watch VOLUME — where the money was actually traded. Volume Profile Fibo Confluence puts that reading right in front of you, in plain language, no jargon. WHAT YOU SEE ON YOUR CHART • The POC, the most-traded price: the market's natural magnet • The value area (VAH / VAL): the "house" where price spends its time • Automatic Fibonacci retracement + the golden pocket • Low-volume nodes
    Here   our more valuable tools SMC Trend Trading   ,  Easy SMC Trading  ,  Institutional SMC Architect Volume Analysis Tools  ,  Volume flow Profile  ,  Market volume profile  , FVG with Volume  , Liquidity Heatmap Profile  ,  Volume Spread Analysis The    Liquidity Heatmap   is a sophisticated institutional trading tool designed to reveal where over-leveraged traders are trapped. By calculating estimated liquidation levels based on volume spikes and leverage, this indicator draws a dynamic "h
    Spike Blast Pro
    Israr Hussain Shah
    Here   our more valuable tools SMC Trend Trading   ,  Easy SMC Trading  ,  Institutional SMC Architect Volume Analysis Tools  ,  Volume flow Profile  ,  Market volume profile  , FVG with Volume  , Liquidity Heatmap Profile  ,  Volume Spread Analysis Spike Blaster Pro is a next-generation MT5 indicator designed specifically for synthetic markets. It works seamlessly on Boom Index and Weltrade Index , providing traders with sharp, reliable spike detection signals. What makes Spike Blaster Pro po
    Candle Time Phases Et Indicator - Split any candle into three time-based phases and control the sequential development of the candle in real time. Candle Time Phases is a precision timing indicator that divides the current candle into three time-based phases as a percentage of its total duration. The indicator determines and clearly separates the initial uncertainty phase, the main movement, and the completion phase, while also analyzing the structure and sequential development of the candle in
    FREE
    Apex Trend Zone — Product Description Apex Trend Zone is a trend-following signal indicator designed to capture the market's primary direction and help you stay in a position throughout the trend. By tracking price momentum, it marks potential reversal and continuation points on the chart using clean arrow markers and an adaptive trailing line. The indicator uses a dynamic zone logic that adjusts itself to market volatility. As the trend strengthens, the trailing area widens, aiming to reduce ea
    MSS Levels HTF
    Milana Muslimova
    MSS Levels HTF - Milana Trades Higher-timeframe Market Structure Shift levels that turn into Support / Resistance and Mirror levels as price interacts with them. THE IDEA When price breaks a swing high or swing low on a higher timeframe, that swing becomes an important reference level. The indicator marks it, then follows how price reacts to it: first touch, retest, and finally a flip to the other side. Everything is drawn on your current chart, so you can work on a lower timeframe, while the
    FREE
    Boom Crash SMC
    Israr Hussain Shah
    Here   our more valuable tools SMC Trend Trading   ,  Easy SMC Trading  ,  Institutional SMC Architect Volume Analysis Tools  ,  Volume flow Profile  ,  Market volume profile  , FVG with Volume  , Liquidity Heatmap Profile  ,  Volume Spread Analysis Deriv boom and crash index spike killer system you can use it only on m5 timeframe  follow the structure and get signal with alert on phone open trade set sl tp and enjoy easy analysis and trading made simple 
    Market Structure, Liquidity and Price Action Analysis for MetaTrader 5 A chart can contain plenty of information and still leave a trader without a clear decision. A BOS label may appear, liquidity may be nearby, and an order block may remain active, yet the real challenge is understanding how those elements relate to one another. ICT Yoshi Pro organizes that process into a cleaner, more disciplined MetaTrader 5 workflow. What ICT Yoshi Pro Does ICT Yoshi Pro is a manual decision-support indicat
    THE PRICE WILL BE SUCH ONLY FOR THE FIRST 100 ORDERS, AFTER THAT, FOR EVERY 100 ORDERS, THE PRICE WILL INCREASE BY 20% COMPARED TO THE PREVIOUS ONE!!! What is NEXUS? NEXUS is a professional indicator for MetaTrader 5, designed to show the real volume flow and the balance between buyers and sellers in the market. The indicator analyzes price and volume movements to detect the moments when the market changes direction and large participants begin to accumulate or unload positions. Key Features
    VSA Wyckoff Volume is a volume analysis tool built on Volume Spread Analysis (VSA) and Wyckoff methodology principles. Instead of showing raw volume bars, it classifies every bar's volume relative to its own trailing average, making it immediately clear when a bar's activity is unusually high or low — often the first sign of institutional participation, climax moves, or exhaustion. Key Features: 1. Six-Level Volume Classification Each volume bar is compared against a Wilder-smoothed volume movi
    Supply demand arrows
    Smaylle Rafael Coelho Mariano
    The   "Supply Demand Arrows"   indicator for MetaTrader 5 (MT5) is a powerful trading tool designed to help traders identify critical supply and demand zones in the market. By visually marking these zones with arrows, the indicator enhances trading precision and decision-making. Key Features Identification of Supply and Demand Zones : The indicator effectively highlights key supply and demand zones on the price chart, allowing traders to see where significant buying or selling pressure exists. T
    FREE
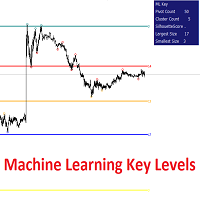
    OVERVIEW This script plots   Machine Learning Key Levels   on your chart by detecting historical pivot points and grouping them using agglomerative clustering to highlight price levels with the most past reactions. It combines a pivot detection, hierarchical clustering logic, and an optional silhouette method to automatically select the optimal number of key levels, giving you an adaptive way to visualize price zones where activity concentrated over time. CONCEPTS Agglomerative cluster
    Cumulative Volume Delta (CVD) MA-X: Strumento Intelligente di Sentiment per l'Order Flow Sblocca i meccanismi nascosti del mercato con il Cumulative Volume Delta (CVD) MA-X . Mentre gli indicatori di volume standard ti dicono solo quanto è stato scambiato, il CVD MA-X ti dice CHI sta vincendo la battaglia tra compratori e venditori e QUANDO . Aggregando l'azione del prezzo a livello di tick e la distribuzione del volume, questo indicatore fornisce una mappa cristallina della convinzione e dell'
    Symbol: EURUSD Timeframe: 30 minutes (M30) For other symbols or timeframes, adjust the settings to match the market. Volume Profile POC Breakout builds a volume profile from recent candles, finds the Point of Control (POC) and marks clean breakouts of that level. Each breakout is shown as a complete trade plan with entry, stop loss and three take profit levels, filtered by the higher timeframe trend and rated by a quality score. The indicator does not open trades. It is a visual and analysis to
    Market Profile Suite
    Muhammad Minhas Qamar
    Developed by MMQ —  Market Profile Suite   Was: $79 Now: $59 A comprehensive Market Profile indicator for MetaTrader 5 that visualizes price distribution through TPO (Time Price Opportunity) analysis. The implementation draws from concepts presented in Jim Dalton's "Mind Over Markets," providing traders with tools to understand market structure, value areas, and volume distribution across multiple timeframes and session configurations. Links [ Documentation  |  Video  | More ] Feature Highlight
    The PrimeX7Trader Auto-Visible Volume Profile is a next-generation, highly optimized market analysis tool designed specifically for serious traders who require extreme precision without terminal freezing. Unlike traditional volume profiles that clutter your chart with manual lines or slow down your platform by calculating thousands of unseen historical bars, this indicator dynamically reads only the visible viewport. It is engineered for fast, manual trade execution, making it the perfect compan
    Versione MT4: https://www.mql5.com/en/market/product/157433 Versione MT5: https://www.mql5.com/en/market/product/167286 Volume Imbalance è uno strumento di visualizzazione leggero con Profilo Volume + Squilibrio Delta, progettato per aiutarti a individuare zone di prezzo ad alta attività, pressione direzionale e aree di prezzo "vuote" all'interno di un intervallo di retrospettiva configurabile. A differenza del classico profilo volume che mostra solo il volume totale, questo indicatore suddiv
    VOLUME PROFILE SAF-XII Analisi Market Profile Professionale per MT5 (L'indicatore ideale per i trader che utilizzano strategie Grid) COS'È IL VOLUME PROFILE? Il Volume Profile è uno strumento istituzionale professionale che visualizza l'attività di trading a specifici livelli di prezzo, a differenza dei tradizionali indicatori di volume che mostrano il volume nel tempo. Rivela DOVE sono avvenuti gli scambi all'interno della finestra temporale scelta, aiutando a identificare: VALUE AREAS (VAH/VA
    This is a multi timeframe version of the  Supply and Demand indicator . It allows you to analyze a chart using the law of supply and demand on three different timeframes at a time. You will see zones of sales and purchases and determine the most profitable points to open positions. The indicator is based on the principle of market fractality. Supply and demand zones show places where a strong buyer or seller has made the price reverse and change its direction. The indicator has several types of
    FREE
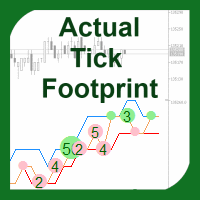
    This new unique indicator Actual tick footprint (volume chart) is developed for using on Futures markets, and it allows seeing the volume of real deals right when they are performed. The indicator Actual tick footprint (volume chart) represents a greatly enhanced tick chart that includes additional information about the volume of deal performed at a specific price. In addition, this unique indicator for MetaTrader 5 allows to clearly detecting a deal type – buy or sell. Alike the standard tick c
    The zigzag mtf
    Marouane Sammoudi
    Italiano: Descrizione dell'Indicatore Nome:   ZigZag Multi-Timeframe (ASTRA TREND) Descrizione:   Questo indicatore per MetaTrader 5 permette di visualizzare   tre diversi ZigZag   basati su tre differenti timeframes simultaneamente su un unico grafico. È ideale per i trader che seguono strategie multi-unitarietà, permettendo di vedere la correlazione tra i cicli brevi e quelli lunghi. Caratteristiche Principali: Doppia Modalità:   Permette di scegliere tra il calcolo   Classico   (basato s
    FREE
    Gli utenti di questo prodotto hanno anche acquistato
    Trend Sniper X
    Sarvarbek Abduvoxobov
    4.86 (43)
    Trend Sniper X è un indicatore trend-following multi-timeframe per MetaTrader 5 che aiuta i trader a identificare la direzione del trend e i potenziali punti di inversione con chiarezza e precisione. per MT4: https://www.mql5.com/en/market/product/193245 Informazioni sul prezzo: Il prezzo attuale è promozionale ed è soggetto a modifiche con il rilascio di futuri aggiornamenti e nuove funzionalità. Offerta Bonus: Per ricevere GRATIS l'Auto-Trade Assistant EA per questo indicatore, invia un messa
    Smart Trend Trading System — MetaTrader 5 Dopo l'acquisto, inviami un messaggio su MQL5 per ricevere GRATUITAMENTE Smart Universal Expert Advisor, insieme al corso online, al manuale PDF e all'accesso al gruppo privato. STTS riunisce la direzione del trend, i segnali di entrata e uscita, le zone di inversione e i livelli di prezzo importanti direttamente sul grafico. Segui il sistema manualmente oppure collega un EA compatibile separato per eseguire le operazioni automaticamente con le impostazi
    Un nuovo Re in città - Indicatore + Gestione ordini (TP1 + TP2 + TP3) + Invio opzionale di segnali Telegram INCLUSO (GRATIS) (SISTEMA COMPLETO DI TRADING e SEGNALI) Il nostro miglior EA per l’Oro: Gold Slayer Questo indicatore include una strategia avanzata, un sistema di trading con gestione ordini personalizzabile e un sistema mean reversion che combina estensioni di envelope, supportato da molteplici filtri intelligenti di conferma come RSI per individuare ingressi di inversione ad alta proba
    Zoryk Gold
    Reda El Koutbane
    4.78 (18)
    ZORYK — Sistema avanzato di segnali XAUUSD per MetaTrader 5 Conosci sicuramente questa sensazione. Passi molto tempo ad analizzare l’oro. Aspetti il punto d’ingresso corretto. Finalmente apri l’operazione e il prezzo inizia immediatamente a muoversi contro di te. Chiudi troppo presto, sposti lo Stop Loss o esiti per alcuni secondi. Successivamente il mercato raggiunge esattamente l’obiettivo che avevi previsto inizialmente, ma senza di te nella posizione. Il problema non era sempre la direzione.
    Ultra Indicator
    Ihor Otkydach
    5 (1)
    ULTRA è un indicatore tecnico che funziona secondo un approccio “tutto in uno”: analizza autonomamente il mercato, genera segnali di trading, visualizza i livelli per l’impostazione degli ordini stop-loss e suggerisce quando chiudere le operazioni per realizzare profitti o ridurre al minimo le perdite. In altre parole, non importa se non sai come analizzare il mercato, determinare i livelli — dove impostare lo stop-loss — o se hai difficoltà con la gestione del capitale. ULTRA farà tutto questo
    M5 Sniper
    MeanFX
    5 (4)
    Porta il tuo vantaggio nel trading sotto i riflettori! M5 Sniper è un nuovo indicatore di MeanFX. Combina segnali di trading precisi con livelli TP/SL adattivi , creando così le migliori operazioni statistiche possibili! Il prezzo aumenta ogni 5 acquisti, il prossimo prezzo è di 69$ Scrivimi dopo l'acquisto per ricevere consigli/guida e un EA bonus Cosa lo rende diverso? Performance statistica comprovata su Gold XAUUSD ( funziona su quasi ogni asset , concentrandosi sulla padronanza di un singol
    Nel 2019 ho mostrato al mondo intero di cosa è capace questo indicatore. Ho operato seguendo i suoi segnali manualmente, su un conto reale, alla luce del sole — il conto era monitorato su Myfxbook e raccontavo in dettaglio il mio esperimento su Facebook. Risultato: in quattro mesi 10.000 dollari sono diventati 941.411. Il rischio era volutamente estremo — il drawdown arrivava fino al 54%, perché nella nostra professione profitto e rischio vanno sempre di pari passo. Lo screenshot di Myfxbook è l
    SuperScalp Pro
    Van Minh Nguyen
    4.54 (37)
    SuperScalp Pro - Professional Multi-Layer Confluence Scalping System SuperScalp Pro è un indicatore di scalping avanzato che potenzia il Supertrend classico con diversi filtri intelligenti di conferma. Aiuta a individuare opportunità di trading Buy/Sell con una maggiore probabilità di successo, riducendo significativamente i falsi segnali. Le frecce Buy e Sell vengono visualizzate chiaramente direttamente sul grafico, insieme ai livelli di Stop Loss e Take Profit basati sull’ATR, calcolati autom
    Gann Made Easy è un sistema di trading Forex professionale e facile da usare che si basa sui migliori principi del trading utilizzando la teoria di mr. WD Gann. L'indicatore fornisce segnali ACQUISTA e VENDI accurati, inclusi i livelli di Stop Loss e Take Profit. Puoi fare trading anche in movimento utilizzando le notifiche PUSH. CONTATTAMI DOPO L'ACQUISTO PER RICEVERE GRATUITAMENTE LE ISTRUZIONI DI TRADING E OTTIMI INDICATORI EXTRA! Probabilmente hai già sentito parlare molte volte dei metodi d
    SMC Intraday Formula
    VividMind Digital Solutions
    5 (26)
    Cominciamo con la verità. Nessun indicatore da solo ti renderà profittevole. Se qualcuno ti dice il contrario, ti sta vendendo un sogno. Qualsiasi indicatore che mostra frecce perfette di acquisto/vendita può essere reso impeccabile — basta ingrandire la giusta sezione della storia e catturare solo i trade vincenti. Noi non lo facciamo.  SMC Intraday Formula è uno strumento. Legge la struttura del mercato per te, identifica le zone a più alta probabilità e ti mostra esattamente come appare la t
    M1 Sniper MT5
    Oleg Rodin
    5 (7)
    M1 SNIPER   è un sistema di indicatori di trading facile da usare. Si tratta di un indicatore a freccia progettato per l'intervallo temporale M1. L'indicatore può essere utilizzato come sistema autonomo per lo scalping sull'intervallo temporale M1 e come parte del tuo sistema di trading esistente. Sebbene questo sistema di trading sia stato progettato specificamente per il trading sull'intervallo temporale M1, può comunque essere utilizzato anche con altri intervalli temporali. Inizialmente ho p
    GoldenX Entry MT5
    VividMind Digital Solutions
    5 (17)
    GoldenX Entry è un indicatore per MT5 con un algoritmo adattivo Smart Entry Trend, un sistema di scoring dei segnali, un rilevatore del regime di mercato e un filtro di volatilità. Ogni segnale include un livello di ingresso calcolato, tre livelli di Take-Profit (TP1, TP2, TP3) e un livello di Stop-Loss. È costruito su più livelli analitici progettati per adattarsi a diverse condizioni di mercato, combinando un sistema analitico multilivello con un ottimizzatore integrato e un sistema di traccia
    Gold Entry Sniper
    Tahir Mehmood
    5 (21)
    Gold Entry Sniper – Dashboard ATR Multi-Timeframe per Scalping e Swing Trading sull’Oro Gold Entry Sniper è un indicatore avanzato per MetaTrader 5 che offre segnali di acquisto/vendita precisi per XAUUSD e altri strumenti, basato sulla logica ATR Trailing Stop e l' analisi multi-timeframe . Caratteristiche e Vantaggi Analisi Multi-Timeframe – Visualizza trend su M1, M5, M15 in un'unica dashboard. Trailing Stop Basato su ATR – Stop dinamici che si adattano alla volatilità. Dashboard Professional
    Gold Trend Coach MT5
    Cristhian Alexander Gaibor Cuasquer
    5 (5)
    Gold Trend Coach è un indicatore di trend per l'oro (XAUUSD) su MetaTrader 5 con segnali di acquisto e vendita, stop loss e tre take profit confermati alla chiusura della candela (non ridisegna), un coach che ti guida dall'ingresso fino al TP3, un pannello multi-timeframe e avvisi sul telefono e su Telegram. Pensato per lo scalping su M1 e M5 e l'intraday su M15 nelle sessioni di Londra e New York. BONUS: EA di auto-trading GRATIS per Gold Trend Coach. Scrivimi dopo l'acquisto e ti invio l'EA ch
    Prossimo aggiornamento — Versione 2.52 in arrivo! [NOVITÀ] Preparati a 4 nuove funzionalità principali progettate per migliorare la tua analisi di mercato e il tuo flusso di lavoro nel trading Portiamo l’analisi di mercato a un livello superiore con 4 nuove funzionalità progettate per soddisfare le tue esigenze di trading. Ecco le novità: 1. TRADE OVERVIEW DASHBOARD 2. CONFLUENCE AT ZONE 3. STRONG & WEAK HIGH/LOW 4. OTE 1. TRADE OVERVIEW DASHBOARD Una dashboard che ti aiuta a comprendere più fa
    Atomic Analyst MT5
    Issam Kassas
    4.5 (64)
    Atomic Analyst — MetaTrader 5 Dopo l'acquisto, inviami un messaggio su MQL5 per ricevere GRATUITAMENTE Smart Universal Expert Advisor, insieme al corso online, al manuale PDF e all'accesso al gruppo privato. Atomic Analyst riunisce l’azione del prezzo, la direzione del trend, i segnali di entrata e uscita, lo Stop Loss e diversi livelli di Take Profit direttamente sul grafico. INDIVIDUA IL SEGNALE. COMPRENDI IL CONTESTO OPERATIVO. Atomic Analyst organizza la sua analisi in informazioni visive ch
    Adaptive Price Action Engine Acquista un indicatore, ricevi l'EA gratis Analisi Auto-Ottimizzata del Trend e dei Pattern Candlestick Multi-Timeframe I mercati cambiano continuamente e non tutti i pattern di Price Action hanno lo stesso valore in ogni condizione di mercato. Adaptive Price Action Engine è progettato per adattarsi alle condizioni di mercato in continua evoluzione, combinando struttura del trend, analisi Multi-Timeframe, pattern Candlestick e ottimizzazione statistica in un unico fr
    ARICoins
    Temirlan Kdyrkhan
    ARICoin is a powerful trading companion designed to generate high-probability entry signals with dynamic TP/SL/DP levels based on volatility. Built-in performance tracking shows win/loss stats, PP1/PP2 hits, and success rates all updated live. Key Features: Buy/Sell signals with adaptive volatility bands Real-time TP/SL/DP levels based on ATR Built-in MA Filter with optional ATR/StdDev volatility Performance stats panel (Success, Profit/Loss, PP1/PP2) Alerts via popup, sound, push, or email Cust
    Boba Analysis Suite
    Trade Ready Solutions LLC
    5 (2)
    Boba Analysis Suite Boba Analysis Suite è un indicatore di analisi per MetaTrader 5. Riunisce la struttura del mercato, le zone di prezzo rilevanti e il contesto generale del mercato in un’unica visualizzazione del grafico. Sviluppato sulla base dell’esperienza pratica come trader e formatore di trading, supporta un processo di analisi strutturato: valutare la direzione del mercato, individuare livelli importanti e analizzare congiuntamente più intervalli temporali. Analisi nel contesto del merc
    ScalpPoint
    Temirlan Kdyrkhan
    ScalpPoint is a powerful trading companion designed to generate high-probability entry signals with dynamic TP/SL/DP levels based on volatility. Built-in performance tracking shows win/loss stats, PP1/PP2 hits, and success rates — all updated live. Key Features: Buy/Sell signals with adaptive volatility bands Real-time TP/SL/DP levels based on ATR Built-in MA Filter with optional ATR/StdDev volatility Performance stats panel (Success, Profit/Loss, PP1/PP2) Alerts via popup, sound, push, or emai
    Auto Optimized SpeedAngle è un sistema di vettorizzazione del momento di livello istituzionale che elimina l'overfitting ( curve-fitting ) attraverso l'ottimizzazione continua Walk-Forward (WFO). Invece di affidarsi a input statici che si degradano quando i regimi di mercato cambiano, l'indicatore recalibra dinamicamente i suoi parametri utilizzando la validazione Out-of-Sample (OOS), assicurando che i segnali visualizzati rappresentino reali vantaggi statistici anziché anomalie storiche. Quadro
    Zain Gold Scalping
    Ahmed Gamal Abdel Nasser Mohamed
    Uno strumento completo di analisi della price action basato su una doppia logica di ingresso indipendente – ciascuna confermata da una banda di volatilità – e integrato da un set configurabile di nove filtri di conferma opzionali, che consentono di modulare con precisione il comportamento dei segnali, rendendoli più conservativi o più aggressivi. Strategia Fondamentale Due configurazioni di ingresso indipendenti, ciascuna delle quali si attiva solo quando il prezzo esce da una banda di volatil
    Tokyo mt5 Indicator
    Vasiliy Strukov
    5 (14)
    Il Tokyo Indicator offre una chiara panoramica visiva della direzione del trend, dei potenziali segnali di trading e delle condizioni di mercato. La sua linea di trend a gradini, codificata a colori, distingue le fasi rialziste (in blu) da quelle ribassiste (in magenta). Frecce direzionali dedicate evidenziano potenziali opportunità di acquisto e vendita al variare del trend visualizzato. Una dashboard integrata riunisce in un'unica visualizzazione pratica il segnale corrente, il bias di mercato
    Azimuth Pro
    Ottaviano De Cicco
    5 (7)
    Azimuth Pro V2: Synthetic Fractal Structure and Confirmed Entries for MT5 Overview Azimuth Pro is a multi-level swing structure indicator by Merkava Labs . Four nested swing layers, swing-anchored VWAP, ABC pattern detection, three-timeframe structural filtering, and closed-bar confirmed entries — one chart, one workflow from micro-swings to macro-cycles. This is not a blind signal product. It is a structure-first workflow for traders who care about location, context, and timing. Halloween P
    Superhero
    Ihor Otkydach
    5 (3)
    L'indicatore SUPERHERO è un sistema di trading multivaluta progettato secondo un approccio "all-inclusive". L'indicatore analizza autonomamente il mercato e fornisce segnali su quando aprire e chiudere le posizioni. Utilizza ordini Stop Loss e Take Profit. Il rapporto R:R è 1:1. Questo sistema è in grado di inviare notifiche push sul tuo smartphone, consentendoti di effettuare operazioni "in mobilità" senza dover rimanere incollato al PC. È perfetto per le società di trading proprietario. UN OMA
    Indicatore multi-valuta di forza e momentum MT5 Dynamic Forex28 Navigator è l'evoluzione dei nostri indicatori popolari da lungo tempo e unisce la potenza di tre strumenti in uno: Advanced Currency Strength28 Indicator (700 recensioni) Advanced Currency IMPULSE with ALERT (530 recensioni) CS28 Combo Signals (bonus attuale) I due indicatori precedenti hanno insieme più di 1.200 recensioni sul MQL5 Market e sono un punto di riferimento nella comunità MT4 dal 2016. Dynamic Forex28 Navigator MT5 por
    Volatility Master for MetaTrader is a real-time dashboard tool that scans up to  50 symbols  to identify high-volatility , trending markets instantly. With bullish/bearish signals, customizable alerts, and a user-friendly interface, it helps you avoid range-bound conditions and focus on high-probability trades. Clarity leads to confidence. Trade confidently and protect your capital effectively with this powerful dashboard. We don't offer free or bonus indicators in exchange of reviews from you.
    Apex Patterns PRO Acquista l'indicatore - Ottieni GRATUITAMENTE l'Expert Advisor basato su di esso. Intelligenza auto-ottimizzante per pattern grafici e breakout Gli scanner di pattern tradizionali si basano su input fissi, registrando spesso prestazioni inferiori quando la volatilità e le strutture del mercato cambiano. Apex Patterns PRO è progettato per adattarsi alle mutevoli condizioni di mercato combinando il riconoscimento dei pattern grafici strutturali, il filtraggio del momentum e l'au
    Neuro Poseidon MT5
    Daria Rezueva
    4.68 (53)
    Neuro Poseidon is a new indicator by Daria Rezueva. It combines precise trading signals with adaptive TP/SL levels - creating best possible trades as a result! Message me and get  Neuro Poseidon Assistant  as a gift to automize your trading process! What makes it stand out? 1. Proven profitability on all assets and timeframes 2. Only confirmed BUY and SELL signals present on the chart 3. Adaptive TP & SL levels generated by the software for each trade 4. Easy to understand - suitable for al
    Break and Retest Hunter is a powerful MetaTrader 5 indicator designed to automatically identify support and resistance levels, breakout structures, and potential retest opportunities in real time. Bonus Indicator: After purchasing Break and Retest Hunter , contact me to receive Trade Indicator Assistant EA completely free as a bonus utility. $65 for the next 10 copies . Next price is $120.  Combining adaptive market analysis, clear BUY/SELL signals, Fibonacci-based profit targets, and a premiu
    Altri dall’autore
    KD Mtf VWAP
    Dien Du Khanh Duong
    KD MTF VWAP is a Volume Weighted Average Price (VWAP) indicator for MetaTrader 5, designed for lower-timeframe traders (M1, M5, M15) and intraday momentum trading. It projects multi-timeframe Anchored VWAPs, 3-Tier Standard Deviation Bands (±1σ, ±2σ, ±3σ), EMA trend filters, and a Sigma & Pip Distance HUD onto a single chart. VWAP is a benchmark commonly referenced in institutional and algorithmic trading. Combining multi-timeframe VWAP projections with standard deviation bands can help identify
    KD MTF Dashboard
    Dien Du Khanh Duong
    KD MTF Dashboard displays ADX, RSI, MACD and EMA trend readings for the current chart's symbol across any combination of timeframes from M1 to D1 (up to 6 at once, M1/M5/M15/H1 by default), in a single table. It is designed to show whether a symbol's timeframes agree with each other, without needing to switch between charts. Key Features Multi-Timeframe Indicator Table: Displays ADX(14), RSI(14), MACD Main/Signal comparison, and EMA(20)/EMA(200) comparison for the current symbol, one column per
    FREE
    KD MTF Candle Timer
    Dien Du Khanh Duong
    KD MTF Candle Timer — Multi-Timeframe Candle Countdown & Synchronized Clocks for MetaTrader 5 Have you ever entered a trade prematurely on the lower timeframe, only to watch a Higher Timeframe (H1 or H4) candle wick violently against you before closing as a rejection pinbar? Or entered right before the candle close and suffered severe slippage during the transition? In discretionary trading and prop firm challenges, entry timing relative to candle closure is just as critical as your price level
    FREE
    KD Ultimate SMC
    Dien Du Khanh Duong
    KD Ultimate SMC is an automated institutional order-flow indicator for MetaTrader 5, designed to map market structure — BOS/CHoCH shifts, Order Blocks, Fair Value Gaps and Liquidity Pools — across multiple timeframes on a single chart. It is intended as the structural reference the other six tools in the KD Trading System are designed to work alongside. This structure map is intended to serve as a reference point for other tools in the system — including VWAP reactions, mini-chart confirmations
    KD SMC Mini Charts
    Dien Du Khanh Duong
    KD SMC MiniCharts is a multi-timeframe analysis tool for MetaTrader 5 that displays up to four synchronized mini charts directly inside your main chart. Each mini chart can use its own timeframe and display SMC and Price Action information independently. This allows you to monitor lower- and higher-timeframe structure without repeatedly switching the timeframe of your main chart or opening multiple chart windows. Key Capabilities 1. Up to 4 Multi-Timeframe Mini Charts Display up to four mini cha
    KD Auto SLTP and Custom Price Alerts is a trade planning and risk management indicator for MetaTrader 5. It calculates Stop Loss levels from nearby swing structure, provides multiple Take Profit methods, calculates position size according to a selected percentage of account balance, and includes up to nine user-defined price alert lines. The indicator uses a configurable ZigZag structure engine together with an Average True Range (ATR) buffer to determine structural Stop Loss levels. Swing struc
    KD Trade Panel
    Dien Du Khanh Duong
    KD Trade Panel — Precision Trade Execution & Dynamic Risk Management for MetaTrader 5 Have you ever missed a high-probability trade setup because you spent precious seconds calculating your position size manually? Or worse, suffered an accidental drawdown breach on your prop firm account due to a miscalculated lot size or a delayed stop loss placement? In fast-moving financial markets, execution latency and manual calculation errors are among the primary causes of avoidable trading losses.   KD
    Filtro:
    Nessuna recensione
    Rispondi alla recensione