Yoshi SMC Trend Planner for MT5

  • インディケータ
  • Le Quang Thanh
    Le Quang Thanh
    MetaTrader 5向けプロフェッショナルトレーディングツール
    私は、世界中のプロフェッショナルトレーダーや市場研究者によって広く知られているトレーディング手法に着想を得た、高品質なMetaTrader 5用インジケーターおよびエキスパートアドバイザー(EA)の開発を専門としています。
    私の開発方針は、実績のあるトレーディングコンセプトを、トレーダーが市場構造、トレンドの挙動、モメンタム、プライスアクション、ブレイクアウトの動向、そしてリスク管理を、より一貫性と効率性を持って分析できる実用的かつ使いやすいツールへと形にすることです。
  • バージョン: 2.35
  • アクティベーション: 10

Yoshi SMC Trend Planner Y02 for MT5

Market Structure, Trend Context and Structured Trade Planning for MetaTrader 5

Trade With Context, Not Isolated Signals

A trading signal is easy to notice. The harder part is deciding whether that signal makes sense within the current market structure, price location and higher-timeframe direction. Many traders can identify a Buy or Sell arrow, yet still hesitate because the surrounding context is unclear. Yoshi SMC Trend Planner Y02 was designed to bring those separate pieces into one practical workflow.

Yoshi SMC Trend Planner Y02 is a layered Smart Money Concepts indicator for MetaTrader 5. It connects internal and swing market structure, important price-action zones, higher-timeframe context, volatility-adaptive trend signals and a structured Trade Plan. Rather than asking traders to follow signals in isolation, the indicator helps them examine where a signal appears, what the broader market is doing and how a possible trade idea may be organized.

Key Features at a Glance

· Internal and swing market structure with Break of Structure (BOS) and Change of Character (CHoCH).

· HH, HL, LH and LL swing labels, together with strong and weak high/low references.

· Order Blocks, Fair Value Gaps (FVG), Equal Highs and Equal Lows, and Premium/Discount zones.

· Previous daily, weekly and monthly high/low levels for broader price context.

· A higher-timeframe Context Panel covering Bias, structure, market phase and price zone.

· Volatility-adaptive Buy and Sell signals confirmed on the closed candle.

· One active Trade Plan with a reference Entry, Stop Loss and TP1, TP2 and TP3.

· Trading-session overlays, configurable alerts and flexible visual controls.

Market Structure and Price Location

The indicator separates internal structure from the broader swing framework. Internal structure highlights shorter price transitions, while swing structure provides a clearer view of the larger directional sequence. BOS and CHoCH support the study of continuation and structural change, and HH, HL, LH and LL labels make price development easier to follow.

Price location is equally important. Order Blocks, Fair Value Gaps, Equal Highs and Equal Lows, previous-period levels and Premium, Equilibrium and Discount zones form a practical map around the market. These areas do not guarantee a reaction, but they help traders judge whether a trend signal appears near a relevant level, inside a pullback area or in a location where patience may be more appropriate.

The objective is not to predict every move. It is to present market information clearly so decisions can be based on visible context rather than an isolated signal.

Higher-Timeframe Context and Trend Confirmation

The Context Panel brings together Bias, higher-timeframe structure, market phase and the current price zone. It helps distinguish expansion from pullback and can highlight transition, structural shift or an early reversal attempt according to the indicator's rules. This overview reduces repeated chart switching while leaving the final interpretation with the trader.

Trend confirmation uses an ATR-based trailing framework that adapts to volatility. When price confirms a transition across the trend level, the indicator can display a Buy or Sell signal on the closed candle. In directional markets, this gives a systematic view of trend changes. In ranges, signals may alternate more frequently, so structure, location and higher-timeframe context remain important.

The indicator does not claim that every signal becomes a high-probability setup. Its value lies in placing signals inside a broader analytical framework for more disciplined evaluation.

From Signal to a Structured Trade Plan

When a new signal is accepted by the planning process, the indicator can display a visual Trade Plan with a reference Entry, an ATR-based Stop Loss and three configurable profit targets calculated from risk multiples. Only one active Trade Plan is maintained at a time, helping preserve chart clarity and reduce overlapping ideas.

The Trade Plan organizes a possible setup; it does not replace judgment or execute trades. Users remain responsible for market assessment, position sizing and deciding whether the proposed levels suit their method and risk tolerance.

A Practical Trading Workflow

A clear way to use the indicator is:

1.       Read the larger swing structure and note the current internal behavior.

2.       Check the Context Panel, market phase and current Premium/Discount location.

3.       Review nearby Order Blocks, FVGs, equal levels and previous daily, weekly or monthly highs and lows.

4.       Evaluate the closed-bar trend signal and the active Trade Plan.

5.       Apply independent confirmation and define risk before taking any action.

There is no requirement to use every module at the same time. The display, alerts and analytical components can be adjusted to support different workflows, allowing experienced traders to keep their preferred method while giving newer users a clearer structure for observation.

Who Is It Designed For?

Yoshi SMC Trend Planner Y02 is intended for manual traders who work with market structure, Price Action, Smart Money Concepts or trend-following analysis. It can support Forex, XAUUSD, indices and CFD analysis across intraday and broader trading approaches.

It is not an Expert Advisor and is not designed for fully automatic execution. It is most useful for traders who want a cleaner chart, a consistent decision process and a practical connection between context, signal and trade planning.

Sessions, Alerts and Customization

Trading-session overlays help users focus on the periods that matter to their routine. Configurable alerts can report selected structure events, trend signals and new Trade Plans through available MT5 notification channels. Visual settings allow the chart to be simplified or expanded according to personal preferences.

Important Notes

· This product is an indicator, not an Expert Advisor.

· It does not open, modify, manage or close trades.

· Entry, Stop Loss and Take Profit levels are analytical references.

· Trend-following signals may change more frequently during ranging conditions.

· Results can vary by symbol, timeframe, spread, volatility and user settings.

· Test the indicator carefully before applying it to a live trading account.

Explore the Yoshi Trading Ecosystem

Traders interested in other strategy-focused indicators can explore more Ichiyoshi tools through the official MQL5 Seller page. Each product follows a distinct analytical workflow, helping users choose the approach that best fits their trading style.

yoshi Official MQL5 Seller Page
https://www.mql5.com/en/users/ichiyoshi/seller

Trading Forex, CFDs and other leveraged markets involves risk. Yoshi SMC Trend Planner Y02 is an analytical and trade-planning tool and does not guarantee profit or future performance. Users remain fully responsible for all trading decisions and should test their settings before live use.

おすすめのプロダクト
CISD Levels Pro automatically draws CISD Buy and Sell levels directly on your chart. It highlights pending levels while they are forming, then marks confirmed levels after the confirmation candle closes. Optional confirmation arrows help you spot the signal quickly. This tool is designed for traders who want clean, simple CISD level visualization without extra indicators or clutter. Key Features Draws Bullish (BUY) CISD levels and Bearish (SELL) CISD levels Shows Pending levels (dashed) and
Introduction to Fractal Pattern Scanner Fractal Indicator refers to the technical indicator that makes use of the fractal geometry found in the financial market. Fractal Pattern Scanner is the advanced Fractal Indicator that brings the latest trading technology after the extensive research and development work in the fractal geometry in the financial market. The most important feature in Fractal Pattern Scanner is the ability to measure the turning point probability as well as the trend probabil
KT Candlestick Patterns Scanner is a Multi-Symbol and Multi-Timeframe scanner that fetches and shows various candlestick patterns on 28 currency pairs and 9 time-frames concurrently . The scanner finds the candlestick patterns by loading the KT Candlestick Patterns indicator as a resource in the background. Features The scanner can find the candlestick patterns on 252* combinations of symbols and time-frames from a single chart. Open the signal's chart loaded with a predefined template with a s
THE QUANTUM UNIFIED BRAIN FOR MT5 The indicator that thinks, adapts, remembers, and dominates across 9 timeframes simultaneously. Most indicators show you one signal. GRID PACMAN TITAN X ESTEROIDES v2.0 runs 17 interconnected intelligence modules in real time — and they vote together before a single arrow appears on your chart. This is not a crossover indicator. This is not a repackaged RSI. This is a complete autonomous analysis engine built for traders who are tired of chasing the market and
Manyal trading system, CovEchoTrend Robot, focuses on reliability and flexibility. By employing statistical analysis methods to study the relationships between the base indicator and market patterns, the system enables a deeper understanding of market processes. Intelligent pattern analysis: The application of statistical data processing helps identify key trend reversal points more accurately, signaling significant market shifts. Informed decision-making is based on the intersection of indicato
Introduction This indicator detects volume spread patterns for buy and sell opportunity. The patterns include demand and supply patterns. You might use each pattern for trading. However, these patterns are best used to detect the demand zone (=accumulation area) and supply zone (=distribution area). Demand pattern indicates generally potential buying opportunity. Supply pattern indicates generally potential selling opportunity. These are the underlying patterns rather than direct price action. T
このインジケーターは実践的なトレードに最適な自動波動分析のインジケーターです! 場合... 注:   Tang Lun (Tang Zhong Shuo Zen) の命名規則の影響で、私は波のグレーディングに西洋の名前を使用することに慣れていません。基本的な波を ペン 、二次波のバンドを セグメント と名付けました。同時に、 セグメント にはトレンドの方向が指定されます (この命名方法は将来のノートで使用されます。最初に言っておきます)。ただし、アルゴリズムは曲がりくねった理論とはほとんど関係がないため、付けるべきではありません。これは、私の市場分析 によって要約された、絶えず変化する複雑な運用ルール を反映しています。 バンドは標準化され、人によって異なることがないよう定義されており、市場参入を厳密に分析する上で重要な役割を果たす人為的な干渉の描画方法が排除されています。 このインジケーターを使用することは、取引インターフェイスの美しさを改善することと同等であり、元の K ライン取引を放棄し、取引の新しいレベルに連れて行きます。また、宣伝の観点から顧客の認識も向上します。 イ
Crypto_Forex MT5用インジケーター「 TREND Histogram 」(リペイント不要) - TREND Histogramインジケーターは、標準的な移動平均線クロスよりもはるかに高感度で効率的です。 - インジケーターの色は2色から選択可能:弱気トレンドは黄色(金色)、強気トレンドは緑(色は設定で変更できます)。 - TREND Histogramには、モバイルとPC向けのアラート機能が組み込まれています。 - このインジケーターは、プライスアクション、VSA、その他のインジケーターなど、他の取引手法と組み合わせるのに最適です。 - このヒストグラムは、価格と数量のデータを 1 つの値に結合する主要な指標の 1 つです。 高品質のトレーディングロボットとインジケーターをご覧になるにはここをクリックしてください! これは、このMQL5ウェブサイトでのみ提供されるオリジナル製品です。
LSTM Surge Detector
Fabian Guillermo Sanchez Urquijo
LSTM Surge Detector — AI-Powered Volatility Expansion Indicator Predict major market moves before they happen. LSTM Surge Detector uses a trained Long Short-Term Memory (LSTM) neural network to identify when the EURUSD M15 market is building up for a significant volatility expansion — before the breakout occurs. How it works The model analyzes 30 hours of market context (120 M15 candles × 11 technical features) and outputs a real-time probability score between 0 and 1. When the probability re
My PVSR
Ashok Kumar Singha
My PVSR   is based on All Type of Pivot Points. Use this Indicator to get proper Support / Resistance Zone and Trade accordingly.. Recommendation: Use this Indicator along with my another Indicator --->>> Dr. Trend   <<<--- Click Here ; To get the best output result feel free to contact me ; Best of Luck It can be used for: All Pairs: Forex, Cryptocurrencies, Metals, Stocks, Indices etc. All Timeframe All Brokers All type of Trading Style like Scalping, Swing, Intraday, Short-Term, Long-
フィボナッチ ソナー フィボナッチ ソナーには、28 のシンボルと 7 つの時間枠から収集された価格アクション パターンの内部ライブラリがあります。 各パターンは 2 つのサイドに分割されます。前サイドと後サイドです。フィボナッチ ソナーは前サイドを使用して類似パターンを認識します。最新のバーの始値までの最新の価格アクション (任意の時点) が、ライブラリの検索に前サイドとして使用されます。 後サイドには、各パターンで発生したすべてのアクティビティの集計が保持されます。ここでフィボナッチ項が登場します。過去の各パターンのすべてのインスタンスの始値から、始値の上と下の価格レベルをフィボナッチ シーケンスで展開しました。次に、価格レベルに到達した回数を測定しました。価格レベルに到達した回数を、1 つの個別の価格パターンに存在するインスタンスの数で割ると、パーセンテージ (%) として抽出できます。 当然、各パターンには、上部のフィボナッチ価格と下部のフィボナッチ価格にパーセンテージがあることが想像できます。これにより、% 値を指定して価格を見つけるメソッドが可能になります。たとえば、
Candle Timer Countdown v2.5 is an advanced MQL5 indicator designed to enhance your trading precision. It provides a live countdown for each candle while simultaneously analyzing multiple timeframes to detect trend direction and potential early reversals. Key features include: Candle Countdown & Progress Bar: Monitor the exact time remaining for each candle with a clear progress visualization. Advanced Trend Detection: Analyze both fast and slow trends with configurable sensitivity and multi-time
AURUM MID-QUANT PRO v5.60 Quantitative Excellence for Gold (XAU/USD) & Volatility Trading Gain a professional edge over institutional markets with AURUM MID-QUANT PRO , an advanced Price Action Pattern Detection and Breakout Engine designed exclusively for MetaTrader 5 . Built specifically to capture the unique volatility of Gold (XAU/USD) and other major financial instruments, this powerful indicator combines high-precision algorithmic pattern recognition with real-time dynamic accumulation z
Yawabeh SD Pro –  Professional Supply and Demand Indicator Trade Smarter with Volume-Confirmed Supply/Demand Zones Our institutional-grade algorithm identifies high-probability reversal zones before price reacts, giving you the edge in Forex, Crypto, and Stocks. Key Features Multi-Timeframe Confirmation – View trend strength across multiple timeframes simultaneously – Align your trades with higher timeframe momentum Smart Alert System – Real-time notifications for: – Strong demand/supply zone
Orderflow Super Candles - Simple Footprint Chart Indicator Platform: MetaTrader 5 (MT5)  (The last screenshot shows the use of the DOM tool in conjunction with the product.) 1. Product Introduction Orderflow Super Candles is a professional charting tool based on underlying Tick data analysis, designed to provide traders with a deep "X-ray" view of the market. By parsing the buy and sell volume distribution within each candlestick, this indicator visualizes the hidden market microstructure. It
Precision Strike Arrows PRO Precision Strike Arrows PRO is a professional-grade signal indicator for MetaTrader 5 that plots precise buy and sell arrows directly on the price chart. Unlike most arrow indicators that repaint signals or flood the chart with entries on every minor price movement, Precision Strike Arrows PRO is built around a philosophy of signal quality over signal quantity. Every arrow that appears on the chart has passed through multiple internal conditions before being displayed
UT Bot Alerts MT5
Mohammad Taher Halimi Tabrizi
5 (2)
This indicator is converted from UT Bot alerts indicator by @QuantNomad of Trading View to MT5. its considering ATR and creating new candles on chart and also is giving good entry points based on its candles. all buffers of new candles and also entry signals are included as buffer so can be used easily on any EA. there are also some different strategies on the internet that can be used or contact me to create it for you.
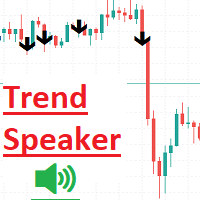
Trend Speakerインジケーター は、リアルタイムで市場のトレンドを簡単に追跡し、分析したいトレーダーのために設計された強力なツールです。チャート上で明確で信頼できる買いと売りのシグナルを提供し、市場の現在のトレンドを非常に便利に評価できます。ユーザーフレンドリーなインターフェースを備えたTrend Speakerは、潜在的な取引機会を見逃すことなく、情報に基づいた意思決定を行い、取引戦略を強化するのに役立ちます。すべてのBUYおよびSELLシグナルには、ストップロス(Stop Loss)とテイクプロフィット(Take Profit)が表示されます。 スクリーンショットでは: 緑の点は、TP1からTP7までのTake Profitを表します 赤い点は、Stop Lossを表します。 使用法: すべての時間枠で実行できます。 BUYおよびSELLの矢印の色と幅を自分で簡単に変更できます。 このインジケーターの使用は非常に簡単で便利です。リラックスして、すべてがうまくいきます。 プロパティを変更することで、TPとSLを簡単に表示または非表示にできます。 もしこのインジケーターが
Session Map Pro automatically plots the critical price levels from previous trading days and overlays visual session markers, giving you an instant "roadmap" of potential support and resistance.   It transforms your chart into a strategic trading battlefield.   Detailed Line Reference Guide (For visual display m1-m5 works best but can be attached to any time frame) Default lookbackDays=5. "Set to 1 for today only and a less cluttered display"  1.Horizontal lines (n) Days)    Solid GREEN Line (
It's a self-learning indicator. You need to set a starting time and download the relevant historical data for it to learn. Learn as few rules as possible and give the maximum freedom to the indicators. Therefore, the principle of choosing the best outcome during the learning period does not guarantee that every transaction is profitable. In general, the longer the study, the more reliable the results. In the strategy tester, you need to set the time parameter before the test starts so that the i
DuhokTrend
Ismael Nayif Ismael Ismael
How to Add a Product Description (MetaTrader Market) To add the product description effectively in MetaTrader's Market, follow these steps: 1. Log into the MetaTrader Market: Go to your MQL5 account . Navigate to the "Seller's Dashboard" or "Products" section. Select your product, DuhokTrend . 2. Writing the Description: To enhance the product's rating, write a detailed and structured description : Template for Product Description: DuhokTrend - Advanced Indicator for Trend Analysis Overview:
# MT5用スクイーズ・モメンタム・インジケーター MetaTrader 5向けにプロが開発した強力な**スクイーズ・モメンタム・インジケーター**で、爆発的な市場チャンスを掴みましょう。 この高度なボラティリティ・モメンタム・インジケーターは、トレーダーが大きな市場変動が起こる前の低ボラティリティ期間を特定するのに役立ちます。ボリンジャーバンドとケルトナーチャネルの強みを組み合わせたこのインジケーターは、市場が「スクイーズ」状態にあり、ブレイクアウトの準備をしているタイミングを明らかにします。 内蔵のモメンタム・ヒストグラムにより、トレンドの方向とモメンタムの変化を容易に把握でき、トレーダーは自信と精度を持ってトレードを行うことができます。 ## 機能 * 高度なスクイーズ検出システム * プロフェッショナルなMT5実装 * 急激なブレイクアウト前にボラティリティスクイーズを検出 * 動的な色変化を伴うモメンタムヒストグラム * 市場状況を容易に把握できるスクイーズステータスドット * 以下の指標を組み合わせ: * ボリンジャーバンド * ケルトナーチャネル * 線
The Plasma Trend indicator is a simple technical indication that is used to determine the current trend direction in the market. The Plasma Trend indicator is a powerful tool for determining the direction of the trend in the Forex market. It is based on both standard technical indicators and proprietary mathematical calculations, which provides a more accurate and reliable trend determination. Its implementation in the form of lines of two colors simplifies the visual determination of a change
高い成功率で Indirection Break Out Signal を検出します。 価格は8月15日までに119$に値上がりします Market Structure Break Out (MSB) の紹介 , このインジケーターは MT4およびMT5プラットフォーム 向けに設計された高度なツールで、トレーダーが価格構造の視点から市場の動きを把握できるよう支援します。矢印とアラートを使用して、主要な トレーディングシグナル を識別・強調表示し、 トレンド方向 および 逆方向 (反転シグナル)の両方に対応します。 際立った機能の一つは、 未突破の供給・需要ゾーンを描画する 能力であり、トレーダーに重要な価格エリアへの明確な洞察を提供します。さらに、 ライブバックテスト機能 により、ユーザーはチャート上で直接インジケーターの過去のパフォーマンスを確認でき、シグナルへの透明性と自信を提供します。 受け取り方法は? ここをクリックしてEAをダウンロード 。このEAは、すでにMarket Structure Break Outインジケーターを購入済みの場合にのみ動作します。 無料のMarke
Develop this indicator for periods of 30 minutes or more, focus on getting market trends right and making sure they are met. MFOP v8.1 gets straight to the point: it scans the market and tells you exactly when there is enough strength to enter a trade. This indicator doesn't do magic, it uses mathematical algorithms to filter out market noise, not enter into false breakouts and show you clear BUY (blue arrow) and SELL (red arrow) opportunities. It is designed and optimized specifically to take
Substantial Arrows — 方向を見て、勢いを読み、シグナルに集中する Substantial Arrows は、MetaTrader 5 用に設計されたプロフェッショナルなトレーディングインジケーターです。 市場方向とトレード候補を、よりシンプルで整理された方法で確認したいトレーダー向けに設計されています。 マルチタイムフレームの Market Trend、Trend Candles、適応型 Arrow Signals を1つのチャート環境に統合しています。 Multi-Timeframe Market Trend 対応タイムフレーム: MN1 • W1 • D1 • H4 • H1 • M30 • M15 • M5 • M1 各タイムフレームは、 BUY • SELL • NEUTRAL として表示されます。 Trend Candles Trend Candles は、市場の強気・弱気状態を視覚的に表示します。 表示をOFFにしても、他のインジケーター機能には影響しません。 Main Arrows 条件が確認された後、BUY / SELL の矢印がチャート上に表示さ
This EA is sessions trading robot that allows you to trade the trading session of yours choice as it waits for market markers to make decision for the direction of the day before taking any trades. It has 3 entry signals that uses candle stick patterns, Moving Averages and Range Break to maximize profits and to take advantage of the trending market. The EA practices risk management and has the ability to grow account by risking certain percentage of your account(risk percentage) each time there
Tatino Super Signals is Non Repaint Indicator for Binary Option trading and Forex trading. Recommendations: Timeframe: All timeframes. For best results we recommend using it on M1, M5 and M15 timeframes. Currency pairs: All Pairs Account type: All Type Broker time: Any Brokers : Alls Binary Trading : Expired 1 Candle Buffer Buy=1, Sell=0, Entry Next Candle Recommended Forex trading stop loss : 15 pips Recommended  Forex tradingTake profit levels : 15 pips Specifications: Does not repaint   Pa
Avez-vous toujours rêvé de pouvoir entrer sur le marché juste après la clôture d'une bougie… et de voir le marché évoluer immédiatement dans votre sens ? Avez-vous toujours souhaité détecter les retournements de tendance plus tôt, éviter les faux signaux et, surtout, saisir les tendances longues avant la majorité des traders ? Aujourd'hui, je vais vous présenter mon nouvel indicateur : Prophète du retournement intelligent. Contrairement aux indicateurs traditionnels qui réagissent avec un certa
このプロダクトを購入した人は以下も購入しています
Neuro Poseidon is a new indicator by Daria Rezueva. It combines precise trading signals with adaptive TP/SL levels - creating best possible trades as a result! Message me and get  Neuro Poseidon Assistant  as a gift to automize your trading process! What makes it stand out? 1. Proven profitability on all assets and timeframes 2. Only confirmed BUY and SELL signals present on the chart 3. Adaptive TP & SL levels generated by the software for each trade 4. Easy to understand - suitable for al
もう勘でトレードしなくていい。 エントリーのタイミング、決済の場所、相場がどちらに傾いているか、そのすべてが1つのチャートで分かります。 RelicusRoad Proは、20種類近くのツールを1つのインジケーターにまとめました。自分のトレードスタイルに合うツールだけをオンにできます。 エントリーは明確に。決済も明確に。すべてのチャートに計画を。 心当たりはありませんか? 買った途端、1分もしないうちに価格が逆行する。 早めに決済してしまい、その後も値動きが続くのを眺めている。 チャートにインジケーターを5つ並べても、答えは5通りある。 ストップロスの位置は、なんとなく決めている。 開発した理由 私たちは18年間、FXを取引してきました。RelicusRoadの中核となるアルゴリズムは、最初は非公開で、私たちプロのトレーダー仲間のために作られました。 きっかけは個人的なものでした。毎回同じラインを手で引き、自分たちで決めたルールを破り、チャート上の重要な一点を見落とすことに、私たちは疲れていたのです。 私たちにとって効いたのは一貫性です。毎日同じ方法で相場を読み続け、それが体に染みつく
トレーダーの皆さん、こんにちは! 多くの個人トレーダーは、動作の遅いウェブスクリプトに頼っています。真の収益性を実現するには、体系化されたフレームワークが必要です。 Astro AIインジケーターは、一般的なチャートオーバーレイではありません。これは、ターミナル上で直接動作する2つのエージェントを含む、コンパイル済みのニューラルネットワークです。 システムの具体的な技術は以下のとおりです。 1. エージェント1:アナリスト(グラフィカルニューラルネットワーク - GNN) 市場は孤立した価格バーではなく、相互に連結されたデータネットワークです。 機能:エージェント1は、グラフィカルニューラルネットワークを使用して、これらの複雑で非線形な関係をマッピングします。 利点:一般的なインジケーターは過去の移動平均しか考慮しませんが、当社のGNNは市場の深い構造的関係をリアルタイムで処理し、個人トレーダーの取引量が大きな影響を与える前に、隠れた相関関係を明らかにします。 2. エージェント2:エグゼキューター(近接戦略最適化 - PPO) パターン認識は、戦いの半分に過ぎません
Quant Direction は、3次元の市場分析ツールです。完全に客観的なアルゴリズムベースの市場分析を提供し、様々なパラメータにわたる正確なパーセンテージ偏差を同時に算出します。高度なAI搭載モデリングツールで開発され、厳密なテストを経て開発されたこのアルゴリズムは、かつてない精度で市場を分析するように設計されています。プラットフォーム上では、あらゆる通貨ペアや金融商品を分析できます。 短期取引、デイトレード、スイングトレードなど、どのような取引スタイルに も、Quant Directionは最適な選択肢です。 オペレーターの本当の利点 Quant Directionの真の利点は、感情、眼精疲労、過剰分析を完全に排除できる点にあります。方向性を探るために何十ものチャートを手作業で精査したり、自分の好みを常に疑ったりする必要がなくなります。このシステムは、8つの時間間隔(5ヶ月から月単位まで)をミリ秒単位で処理します。あらゆる瞬間に市場を支配している主体を正確に明らかにし、常に成功確率が最も高い方向で取引できるようにします。 市場分析の3つの側面 このアルゴリズムは市場を3つの
BTMM State Engine Pro by G-Labs — Beat The Market Maker indicator for MetaTrader 5. Asian session range, London and New York kill zones, level progression (L1/L2/L3), peak formation detection (PFH/PFL), entry signals, and a multi-pair scanner from one chart. Stop scanning charts one pair at a time. The State Engine tracks the BTMM daily cycle automatically — Asian box, room boundaries, level blocks, peak formations, and filtered entries — while the scanner dashboard shows level, peak status, d
The Oracle Pro
Ottaviano De Cicco
5 (1)
The Oracle Pro:MT5向け合成マルチタイムフレーム・バイアスエンジン ️ サマー・ローンチ・オファー — The Oracle Pro を 199 USD で(早期購入者向け)。価格は普及に応じて上昇します。最終価格 399 USD。 The Oracle Pro は、要求の高いプロのトレーダーのために作られた MetaTrader 5 向けのプレミアム・マルチタイムフレーム バイアスエンジン です。ひとつの問いに規律をもって答えます。すなわち、各タイムフレームの現在の方向バイアスは何か、その強さはどれほどか、そしてタイムフレーム同士はどれだけ一致しているか。すべては確定足のみで計算され、リペイントはありません。 The Oracle Pro はマルチファクター・コンセンサス・システムです。独自のインジケーターと最適化されたアルゴリズムを単一の高度なコンセンサス・ベクトルに統合し、それを単一のインジケーター・インスタンス内で現在足と上位足のスタックにわたって読み取ります。複数のチャートにばらばらのツールを積み重ねる代わりに、です。 これは Oracle コンセンサス手法
PainX 400 FAKEOUT DETECTOR MT5 Custom Indicator  ·  Sell-Side Bias  ·  Scalping  ·  RSI(6) Filtered   OVERVIEW   The Spike Fakeout Detector is a non repaint precision technical indicator built exclusively for Crash / PainX synthetic indices on the platform. It is engineered around one of the most consistent and exploitable patterns on this instrument — the false breakout above resistance followed by a sharp price drop. Crash/PainX is a growing index that produces a significant price drop app
Mahra Pro Indicator MT5 Overview Mahra Pro is a MetaTrader 5 chart indicator designed to support structured analysis of XAUUSD (Gold). It combines trend, momentum, volatility and price-structure conditions to identify potential buy and sell setups and display them directly on the chart. The indicator does not open, modify or close trades. All trading decisions and order execution remain under the user's control. Main features • Buy and sell signal arrows on the chart. • Fast and slow EMA lines w
M1 Quantum を使用したライブトレードシグナル : シグナル (取引は 自動的に Quantum Trade Assistant によって実行され、この製品に 無料 で含まれています。) 最新ニュース: バージョン1.64がリリースされました。現在、すべての取引で、関連するサポート/レジスタンスゾーンの後ろにStop Lossが設定されます。今回のバージョンでは、EAのパフォーマンスを向上させるためにSmart Close機能も改善されました。 8月9日から、ライブシグナルはバージョン1.64で稼働しています。 価格プラン: 現在価格: $169 (早期購入者向けオファー) 次回予定価格: $189 予定小売価格: $299 開発者からのお知らせ: ご購入後、 最新の推奨設定ファイル(Set File) 、運用アドバイス、および他の M1 Quantum ユーザーと交流できる VIPサポートグループ への招待をご希望の場合は、お気軽にご連絡ください。 よくある質問 - 設定ファイル - インストールガイド M1 Quantum は、M1専用のプロフェッショナルトレーディング
Smart Market Structure Pro by G-Labs — ICT and Smart Money Concepts toolkit with built-in multi-symbol scanner for MetaTrader 5. Break of structure, change of character, order blocks, fair value gaps, liquidity sweeps, premium and discount zones, ICT sessions, confluence scoring, AI trade ideas, and a traffic-light scanner across up to 30 pairs and four timeframes from one chart. Map SMC and ICT on the active chart while the built-in scanner monitors your full watchlist. Each cell shows BUY, S
Azimuth Pro
Ottaviano De Cicco
5 (7)
Azimuth Pro V2:MT5向けシンセティック・フラクタル構造分析と確認済みエントリー 概要 Azimuth Pro は Merkava Labs によるマルチレベルスイング構造インジケーターです。4つのネストされたスイングレイヤー、スイングアンカーVWAP、ABCパターン検出、3タイムフレーム構造フィルタリング、そして確定バーでの確認済みエントリー — 1つのチャートで、ミクロスイングからマクロサイクルまでを網羅するワークフロー。 これはブラインドシグナル製品ではありません。ロケーション、コンテキスト、タイミングを重視するトレーダーのための構造ファーストワークフローです。 ️ サマーセール — 夏至とThe Oracle Proの発売を記念して、Azimuth Proが30%オフ。現在279 USD(通常399 USD)。期間限定の夏季オファー。 1. V2での変更点 シンセティック・マルチタイムフレームエンジン 上位タイムフレーム分析をMeridian Proと同じ独自のシンセティックアーキテクチャで一から再構築。よりクリーンなHTFコンテキスト、安定したライブ動作、
UZFX {SSS} スキャルピング・スマートシグナル v5.0 MT5は、変動の激しい市場において正確かつリアルタイムのシグナルを求めるスキャルパー、デイトレーダー、スイングトレーダー向けに設計された、リペイントのない高性能な取引インジケーターです。(UZFX-LABS)によって開発されたこのインジケーターは、価格行動分析、トレンド確認、スマートフィルタリングを組み合わせることで、すべての通貨ペアおよび時間枠において、高確率の売買シグナル、警告シグナル、トレンド継続の機会を生成します。 トレードの判断に迷うのはもうやめましょう。明確さ、正確さ、そして規律ある市場執行を求めるトレーダーのために設計された、体系的なシグナルシステムに従い始めましょう。 間違いなく、MQL5で入手可能な最高のインジケーターの一つです。絶対に見逃さないでください!!「スマートなトレーダーのためのスマートシグナル」 最新バージョン5.0がリリースされました。価格は予告なく最大499.99ドルまで値上がりする可能性がありますので、チャンスを逃さないようお早めにお求めください!! 購入を決める前に!無料トライアル
TPA True Price Action indicator reveals the true price action of the market makers through 100% non-repainting signals strictly at the close of a candle! TPA shows entries and re-entries, every time the bulls are definitely stronger than the bears and vice versa. Not to confuse with red/green candles. The shift of power gets confirmed at the earliest stage and is ONE exit strategy of several. There are available now two free parts of the TPA User Guide for our customers. The first "The Basics"
By the time you've clicked through forty charts looking for a first red day at a monthly high, the setup you wanted has already closed. Market Maker Reversal Scanner reads your Market Watch, finds a fixed set of reversal and exhaustion patterns, scores each one on a transparent 10-point scale, and puts the results in a single sortable panel on one chart. You stop hunting. You start choosing. New in v12.1: a DAYS / SESSIONS switch. Sessions mode runs the same scanner on closed H4 candles and tags
MERAVITH SCANNERは、MetaTrader 5用のプロフェッショナルな金融市場インジケーターで、複数の分析ツールを一つの統合システムにまとめています。独自の出来高加重平均価格(VWAP)手法を使用してすべての計算を自動で行い、主観的な解釈を完全に排除します。 このインジケーターは、すべての資産クラス(FX、株式、指数、商品、暗号通貨)およびM1から月足までのすべての時間軸で動作します。基本原理は「価格は出来高に従う」というものです。MERAVITHは機関投資家の出来高が集中するポイントを特定し、その集中から数学的に正確な価格レベルを導き出します。予測や投機は行わず、計算のみを行います。 MERAVITH SCANNERを使用すると、28の主要FX通貨ペアをすべての時間軸でわずか2~3分でスキャンできます。また、任意の市場をスキャンすることも可能です。例えば、約100銘柄の株式を約10分でスキャンできます。 インジケーターは、消耗レベル、均衡線、偏差、統計レベル、およびターゲット予測を算出します。 チャート要素 Origin Point :すべての計算が始まる起点です。イン
MERAVITH は MetaTrader 5 向けのマルチタイムフレームの出来高・流動性インジケーターで、すべての時間足でトレンド、サポートとレジスタンスのゾーン、エントリー、ターゲット、ストップロスを表示します。市場の完全な流動性マップ、ヘッジファンド流の流動性ツールを提供し、独自の出来高加重平均価格の手法ですべての計算を自動で行うため、主観的な解釈はありません。 FX、ゴールド(XAUUSD)、指数、仮想通貨に対応し、すべての時間足で機能します。 購入後の特典:MERAVITH での取引方法を解説した動画レッスン集。購入後にメッセージをお送りください。 MERAVITH の機能 すべての時間足を分析し、それぞれで有効なトレンドを表示します。 流動性ゾーン(Volume Equilibrium)を示します。強気と弱気の出来高が等しくなる場所です。 すべての時間足の流動性レベルをチャート上に直接表示します。 参考用に市場のテキスト分析を書き出します。 現在のトレンドからエントリー、ターゲット、サポートレベル、ストップロスを計算します。 取引のリスクリワード比を計算します。 口座残高に
Volatility Master for MetaTrader is a real-time dashboard tool that scans up to  50 symbols  to identify high-volatility , trending markets instantly. With bullish/bearish signals, customizable alerts, and a user-friendly interface, it helps you avoid range-bound conditions and focus on high-probability trades. Clarity leads to confidence. Trade confidently and protect your capital effectively with this powerful dashboard. We don't offer free or bonus indicators in exchange of reviews from you.
IQ FX Gann Levels a precision trading indicator based on W.D. Gann’s square root methods . It plots real-time, non-repainting support and resistance levels to help traders confidently spot intraday and scalping opportunities with high accuracy. William Delbert Gann (W.D. Gann) was an exceptional market analyst, whose trading technique was based on a complex blend of mathematics, geometry, astrology, and ancient mathematics which proved to be extremely accurate. We don't offer free or bonus indic
This indicator automatically detects internal & swing market structure, Fibonacci Retracement and Fibo Levels. Features Full internal & swing market structure labeling in real-time Fibonacci Retracement Fibonacci Levels After purchasing the indicator, the full source code is provided, and via indicator buffers it can be easily integrated into your Expert Advisors (EAs) for automated trading strategies.
First time on MetaTrader, introducing IQ Star Lines, an original Vedic Astrology Based Intraday Trading Indicator. We don't offer free or bonus indicators in exchange of reviews from you. You won't need any free products with this indicator to make it work. ;) Enjoy! Welcome to the new and updated  IQ Star Lines , the ultimate fusion of ancient planetary cycles and modern quantitative trading, published for the first time on Metatrader. This is an indicator built by the developer, who has spent
Volume Arrow Signal Product Description Volume Arrow Signal is a smart trading indicator designed to help traders identify potential buy and sell opportunities using price action, volume behavior, and directional arrow signals. The indicator places clear arrows directly on the chart, making it easy to spot possible market reversals, trend continuations, and entry opportunities without spending hours analyzing charts manually. Whether you are trading Gold (XAUUSD) , Forex pairs, Indices, or Crypt
GEM Signal Pro GEM Signal Pro は、MetaTrader 5 向けのトレンドフォロー型インジケーターです。より明確なシグナル、より整理されたトレードセットアップ、そして実用的なリスク管理をチャート上で確認したいトレーダーのために設計されています。 単純な矢印だけを表示するのではなく、GEM Signal Pro はトレード全体の考え方を、より見やすく分かりやすい形で表示します。条件が確認されると、インジケーターはエントリー価格、ストップロス、利確目標をチャート上に表示し、トレードセットアップをより効率的に確認できるようにします。 動作の仕組み このインジケーターは、まず内部ロジックに基づいて有効なシードシグナルを検出します。 確認条件が満たされると、GEM Signal Pro はチャート上に完全なセットアップを表示します。これにより、トレーダーはトレード構造をより明確に把握し、手作業による分析を減らすことができます。 チャート上のトレードレベル 確認済みシグナルに対して、GEM Signal Pro は以下を表示できます。 エントリー価格 ストップロス テ
ORB Seeker MT5
Marcela Goncalves De Oliveira
数量限定で特別価格!希少性を維持するための特別価格です! たったの599ドル! ご購入後、ボーナスとしてORB Seeker EAと個人最適化セットファイルをお受け取りいただくため、私にご連絡ください。 クリーンなセッションブレイクアウトを自信を持ってキャッチしましょう! ORB Seeker MT5は、正確性、シンプルさ、柔軟性、そして明確なチャート構造を求めるトレーダー向けに開発された、プロ仕様のオープニングレンジブレイクアウト(ORB)インジケーターです。 このシステムは、あらゆる銘柄のプレマーケットまたはカスタムセッションのレンジを自動的にプロットし、エントリー、ストップロス、テイクプロフィット、およびオプションの50%部分TPレベルを含む明確なブレイクアウトシグナルを提供します。すべての計算結果はリアルタイムでチャート上に表示されます。 ロンドンオープン、ニューヨークセッション、アジアセッション、または独自のカスタム市場時間帯で取引できます。ORB Seeker MT5は選択したセッション時間帯に合わせて調整されるため、市場レンジ、ブレイクアウトレベル、トレードレベルの位
KenKem Master Volume Profiler - Brief Introduction A Display-only volume-profile cockpit for XAUUSD, BTCUSD and other liquid symbols. Draws profile structure, multi-timeframe flow, EMA trend and study-only setup markers. Places no orders. Not a signal service.  It maps where the market has actually traded and reads recent order flow, so you can see structure and lean at a glance.  What it shows: Master and local volume profiles (POC and value-area high/low) - the price shelves that matter. A liv
Presenting one-of-a-kind Gann Indicator for XAUUSD IQ Gold Gann Levels is a non-repainting, precision tool designed exclusively for XAUUSD intraday trading. It uses W.D. Gann’s square root method to plot real-time support and resistance levels, helping traders spot high-probability entries with confidence and clarity. William Delbert Gann (W.D. Gann) was an exceptional market analyst whose trading technique was based on a complex blend of mathematics, geometry, astrology, and ancient calculation
Navigator Equilibrium:市場のフェーズ、モメンタム、ピーク、ダイバージェンスをひとつのウィンドウで モメンタム・オシレーター、トレンドフィルター、ボラティリティ指標、ダイバージェンス・スキャナーを行き来する必要はもうありません。Navigator Equilibrium は、それらを色分けされたひとつのウィンドウにまとめました。モメンタムが強まっているのか弱まっているのか、どちらが主導権を握っているのか、相場がトレンド中なのか持ち合いなのか、そして価格とモメンタムがどこで食い違っているのかが、ひと目でわかります。 相場を明確に読み取りたい裁量トレーダーにも、整理されたドキュメント付きのバッファを必要とする EA 開発者にも向いています。 他との違い 上昇・下落だけではない、5つの状態を持つヒストグラム。 方向に加えて、モメンタムが強まっているのか、弱まっているのか、ピーク状態まで伸びきっているのかを色で示します。 相場環境を示すゼロライン。 色が変わり、相場がトレンド中か持ち合い中かを教えてくれます。 「誰が主導権を握っているか」がひと目でわかる。 ヒストグラムの棒
一言でいうと このインジケーターは RSI と MACD という2人の専門家を1つにまとめたもの です。2つのチャートを別々に見て判断する代わりに、両方が同意したときだけ「買い」または「売り」の矢印を表示します。 矢印は再描画されません 。一度出現すれば、そのまま固定されます。 「コンボ」の意味 通常、トレーダーは RSI(値動きの勢い)と MACD(トレンドの方向)を別々に見ます。しかし両者が矛盾することも多いです。 このインジケーターでは、 両方が同時に同意したときのみシグナル を出します。これにより、多くの偽シグナルが排除されます。 画面で見えるもの 価格チャートとは別のインジケーターウィンドウ 青と赤の矢印 —— そのまま使えるシグナル 拡大表示された MACD ヒストグラム(見やすく強調されている) RSI と MACD のラインも表示されるが、注目すべきは矢印 こんな人におすすめ 初心者 —— 2つのインジケーターを別々に解釈し、矛盾に対処する必要がない 経験者 —— シグナルの高速フィルタリングと、再描画しないクリアなロジック 迷いたくない人 —— 「買い」「売り」「待て
Ace Trend
Mikhail Sergeev
5 (3)
私たちはあなたにトレンド取引の世界でゲームのルールを変える革命的な指標を提示します。 指標は、パフォーマンスを再考し、前例のない高さにあなたの取引経験を高めるように設計されています。 私たちの指標は、競合他社とは一線を画す高度な機能のユニークな組み合わせを誇っています。 "実質の価格設定要因"の先端技術は最も困難で、揮発市況の最高の安定性を保障する。 不安定なパターン、壊れた指標に別れを告げ、意識的で制御された取引を歓迎します。 指標は単なる美しい絵ではありません! 指標は、トレーダーの側にオッズをシフトし、それによって利益を得る必要があります。 インジケータ信号(完全自動モード)に基づいて取引結果に慣れる: https://www.mql5.com/ja/signals/2339244 AceTrendは、rbtiバージョンによるトレンド指標のランキングで第一位にランクされています。AceTrend-取引における最大の収益性と制御。 私たちの指標は、歴史ではなく、現在の市場相場に基づいて収益性を強調しています。 革命に参加-あなたの取引経験の可能性のロックを解除! インジケーターは、
このインジケーターは、市場で 関心が示されたゾーン をハイライトし、その後に 注文の蓄積ゾーン を表示します。 これは、大規模な**板情報(オーダーブック)**のように機能します。 これは、 巨大な資金 のためのインジケーターです。その性能は卓越しています。 市場にどんな関心が存在していても、 必ず目に見えるようになります 。 (これは 完全に再設計され、自動化されたバージョン です。もはや手動分析は必要ありません。) トランザクションスピード(取引速度) は新しい概念のインジケーターで、市場で大口注文が どこに・いつ 集中しているかを示し、それに基づいたチャンスを提供します。 トレンドの変化を 非常に早い段階 で察知することができます。 FXでは「出来高」と呼ばれているものは誤解されています。実際には、これは 時間あたりの価格変動量 です。したがって、正しい名称は トランザクションスピード です。 考え方・行動・分析の仕方すべてが問われます。 分析パラダイムの転換は非常に重要です。 このインジケーターは、FXにおける出来高の考え方を 根本から再定義 し、論理的な形で正確に活用する、
KURAMA GOLD SIGNAL PRO(MT5版)— 7層フィルター・自動TP/SL・品質スコア・サイン履歴保存搭載 XAUUSD完全トレードシステム リアルタイムでリペイントしません。サインが出た瞬間、矢印・エントリー・TP・SLはその場で固定され、後から動きません。あなたがトレードするのは、この「リアルタイムで出たサイン」です。さらにv7.20では、実際に通知されたサインを自動保存し、再起動後もそのまま復元します。 購入者限定特典 買い切りライセンスをご購入いただいた方に、AI Zone Radar($59相当)+完全PDFマニュアルを無料プレゼント。本体価格に$59相当の特典が付いてきます。購入後にMQL5でメッセージをお送りください。 AI Zone Radar: https://www.mql5.com/en/market/product/175834 ゴールドトレーダーのコミュニティで実際に使用され、精度と使いやすさで高く評価されています。 あな
作者のその他のプロダクト
Yoshi Pro Rejection Zones: A Smarter Way to Read Support, Resistance and Price Rejection on MetaTrader 5 In trading, one of the most important skills is knowing where the market is likely to react. Whether a trader focuses on forex, gold, indices, crypto, or CFDs, price often responds around meaningful support and resistance areas. These areas can become turning points, breakout zones, retest levels, or simply locations where traders should pay closer attention. The challenge is that most charts
FREE
Liquidity Delta Profiler Yoshi Read liquidity-zone interaction with a four-part relative delta view on MetaTrader 5 Many indicators draw a line and leave the trader to decide what the next touch means. In live trading, the difficult part is not locating every swing. It is judging how price behaves after it reaches an area where liquidity may be resting. A brief test, a decisive sweep and a failed breakout can look similar at first, yet they call for different decisions. Liquidity Delta Profiler
FREE
Yoshi Order Blocks and Breaker Blocks A structured MT5 framework for tracking Order Block zones and their transition into Breaker Blocks Key Features • Bullish and bearish Order Block visualization • Order Block to Breaker Block transition tracking • Adjustable Swing Lookback • Independent recent bullish and bearish zone controls • Full-candle or candle-body zone construction • Configurable zone colors and opacity • Optional Historical Polarity Stars with separate colors • Maximum Calculation Ba
FREE
Pinbar Yoshi Pro – Clean Multi-Timeframe Pin Bar Detection for MetaTrader 5 Pinbar Yoshi Pro is a clean and practical MT5 indicator designed for traders who use price action, candlestick rejection, support and resistance, market structure and multi-timeframe analysis in their daily trading routine. The purpose of this tool is simple: to help traders detect bullish and bearish Pin Bar candles more clearly, more consistently and with less manual chart scanning. In real trading, a Pin Bar is not
FREE
Yoshi Adaptive RSI Adaptive Confirmed Momentum for MetaTrader 5 Momentum tools are useful only when their signals are read in context. A standard RSI can react quickly to small price changes while the current candle is still forming. That may tempt traders to act before the move is confirmed. The real challenge is not simply finding an overbought or oversold reading, but understanding whether momentum is holding, weakening, or leaving an extreme area at a meaningful point on the chart. Yoshi Ada
FREE
Ichiyoshi Trend Pullback Framework for MT5 — Version 2.3 Holy Grail Inspired Trend-Pullback Indicator Ichiyoshi Trend Pullback Framework for MT5 — Version 2.3 is a professional trend-pullback indicator created for traders who want to read the market with structure, discipline and context. The framework is inspired by the practical logic of the well-known Holy Grail trend-pullback approach, widely associated with Linda Raschke’s professional trading philosophy. The idea is simple, but powerful: i
ORBYoshi V1.26 – Professional Opening Range Breakout Framework for MetaTrader 5 The Opening Range Breakout (ORB) is one of the most respected intraday trading concepts in modern market history. Popularized through the research and trading work of renowned traders such as Toby Crabel , Larry Williams , and Mark Fisher , the ORB methodology focuses on identifying directional opportunities that emerge after the market establishes its initial opening range. ORBYoshi was developed to bring this timel
Price Action Structure Yoshi for MetaTrader 5 Introduction Price Action Structure Yoshi is a professional Price Action and Market Structure Indicator designed for MetaTrader 5. This MT5 Indicator helps traders visualize market structure, liquidity areas, order blocks, liquidity sweeps, and trendline relationships directly on the chart in a clear and organized manner. Inspired by widely recognized Price Action Analysis and Market Structure concepts, the indicator focuses on helping traders unders
UT Bot Yoshi Trend ATR MT5 – Professional ATR Trailing Stop Trend Indicator for MetaTrader 5 UT Bot Yoshi Trend ATR MT5 is a professional trend-following indicator for MetaTrader 5, designed to help traders read market direction, follow volatility-based trailing stop behavior, and organize Buy/Sell trading ideas with a clean visual structure. The indicator is built around a practical and well-known trading concept: ATR trailing stop logic . Instead of trying to predict the market or identify per
ATR-based trend signals, structured trade planning and higher-timeframe price-action context in one MetaTrader 5 indicator. LTYoshi_Pro is a decision-support indicator built around an ATR trailing-stop engine. It is designed to help traders organize trend signals, risk levels and market context without mixing every chart element into a single automatic decision. The indicator separates its work into independent layers. The core engine produces raw Buy/Sell events when the selected price source
SMC ICT Yoshi v2.19 Smart Money Concepts, Market Structure, Order Blocks and Fair Value Gaps for MetaTrader 5 SMC ICT Yoshi v2.19 is a multi-layer Smart Money Concepts (SMC) and ICT-style market structure indicator for MetaTrader 5. It brings market structure, liquidity references, Order Blocks, Fair Value Gaps, premium and discount zones, higher-timeframe context and session timing into one clear analytical workflow. The product is designed for traders who want more than isolated BOS, CHoCH or
MA Yoshi Pro Moving Average Trend, Momentum and Price Action Confirmation for MetaTrader 5 A Clearer Way to Evaluate Trend Setups Many traders do not struggle because they lack indicators. The harder problem is deciding which information deserves attention, which signal should be ignored, and when it is better to wait. A moving average crossover may appear during a choppy phase. A strong candle may form in the wrong location. MA Yoshi Pro was created to bring these separate observations into o
Yoshi MTF Candlestick Patterns is a visual Price Action indicator for MetaTrader 5 that combines Three-Line Strike, Momentum Engulfing and closed-bar Pin Bar recognition in one clean chart workspace. A compact multi-timeframe panel reviews the latest closed candle on M1, M5, M15, M30, H1, H4 and D1, helping traders check candle-pattern context without repeatedly switching charts. Yoshi MTF Candlestick Patterns is a visual Price Action indicator for MetaTrader 5. It brings Three-Line Strike, Mome
Volatility-Adaptive Trend Signals and Visual Trade Planning for MetaTrader 5 TrendYoshi is a manual decision-support indicator for MetaTrader 5 that combines ATR-based trend states, clear Buy/Sell transitions, session context, alerts and structured visual trade plans. A Clearer Way to Move from Trend Signal to Trade Plan A direction change alone is rarely enough. Traders still need to know where the trend reference sits, how much room exists between entry and invalidation, whether the setup appe
Trading a pullback often looks simple after the move is complete. In real time, however, traders must decide which swing matters, where the retracement should be measured from, and whether price is returning to a meaningful area or merely moving through noise. Manual Fibonacci drawing can become inconsistent, especially when the market extends to a new high or low. Yoshi ICT Fibonacci OTE was created to bring more structure to that process. Product Overview Yoshi ICT Fibonacci OTE is a manual de
Market Structure, Liquidity and Price Action Analysis for MetaTrader 5 A chart can contain plenty of information and still leave a trader without a clear decision. A BOS label may appear, liquidity may be nearby, and an order block may remain active, yet the real challenge is understanding how those elements relate to one another. ICT Yoshi Pro organizes that process into a cleaner, more disciplined MetaTrader 5 workflow. What ICT Yoshi Pro Does ICT Yoshi Pro is a manual decision-support indicat
Structured ICT Market Analysis for MetaTrader 5 Reading a chart is rarely difficult because price lacks information. The real challenge is deciding which information matters now. A Break of Structure can support continuation, but the same event may mean something different near liquidity, inside an imbalance, or during an active session. Yoshi ICT Framework Y1.01 brings these elements into one organized MetaTrader 5 workspace, helping discretionary traders evaluate structure, location, timing, a
Reading market structure is rarely difficult because of the terminology. The real challenge is applying the same rules every time: deciding which swing matters, whether price has genuinely broken it, and what to do after a Break of Structure or Change of Character appears. Without a consistent process, charts become crowded and traders can react to isolated labels instead of evaluating the full setup. SMC Yoshi Pro is a market structure indicator for MetaTrader 5 built for manual traders who wan
Yoshi Opening Range Breakout Navigator Structured ORB Analysis for MetaTrader 5 Trading the Open Is Simple in Theory—Not in Practice The Opening Range gives intraday traders a clear starting point: define the early-session high and low, then observe how price behaves around those boundaries. The concept is straightforward. The execution is not. In live trading, ranges are often drawn inconsistently, an intrabar spike can be mistaken for a confirmed breakout, and traders may chase price before th
A structured MT5 trend, momentum and pullback framework for clearer manual trading decisions Moving-average trading often looks simple until the market becomes less cooperative. A crossover may appear after a move is extended, timeframes may disagree, and a clean signal can turn into whipsaw inside a narrow range. The challenge is rarely a lack of indicators. It is the lack of an orderly way to connect trend, momentum, market regime, confirmation and risk. Yoshi Adaptive MA Cloud is a MetaTrader
フィルタ:
レビューなし
レビューに返信