Central Pivot Range Plus
- インディケータ
- バージョン: 2.0
- アクティベーション: 5

CPR Pivot Range Plus Framework v2.0 - プロフェッショナル・マルチタイムフレーム・ピボットポイント&CPRインジケーター
概要
CPR Pivot Framework v2.0は、6種類のピボット計算メソッド、中央ピボットレンジ(CPR)分析、マルチタイムフレームの合流(コンフルエンス)検知、そして新たにインテリジェントなエントリー&エグジット矢印シグナルを組み合わせた、プロフェッショナル仕様の機関投資家向けトレーディングツールです。
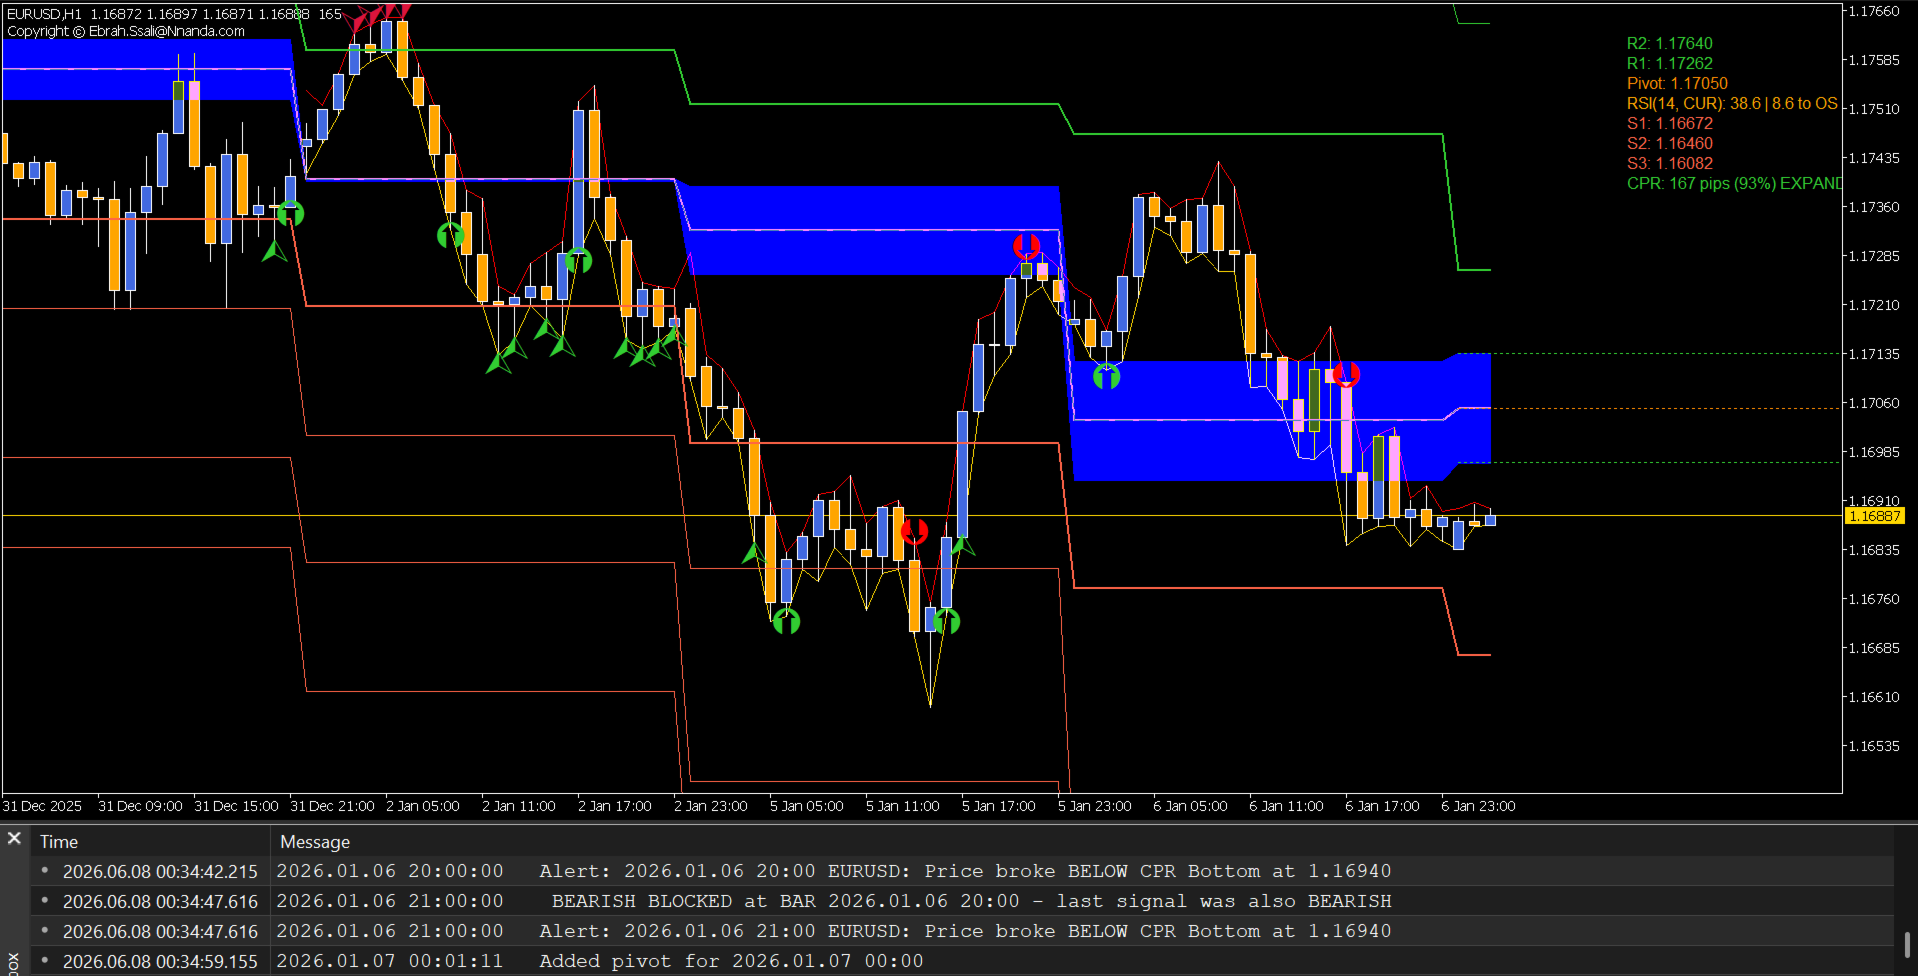
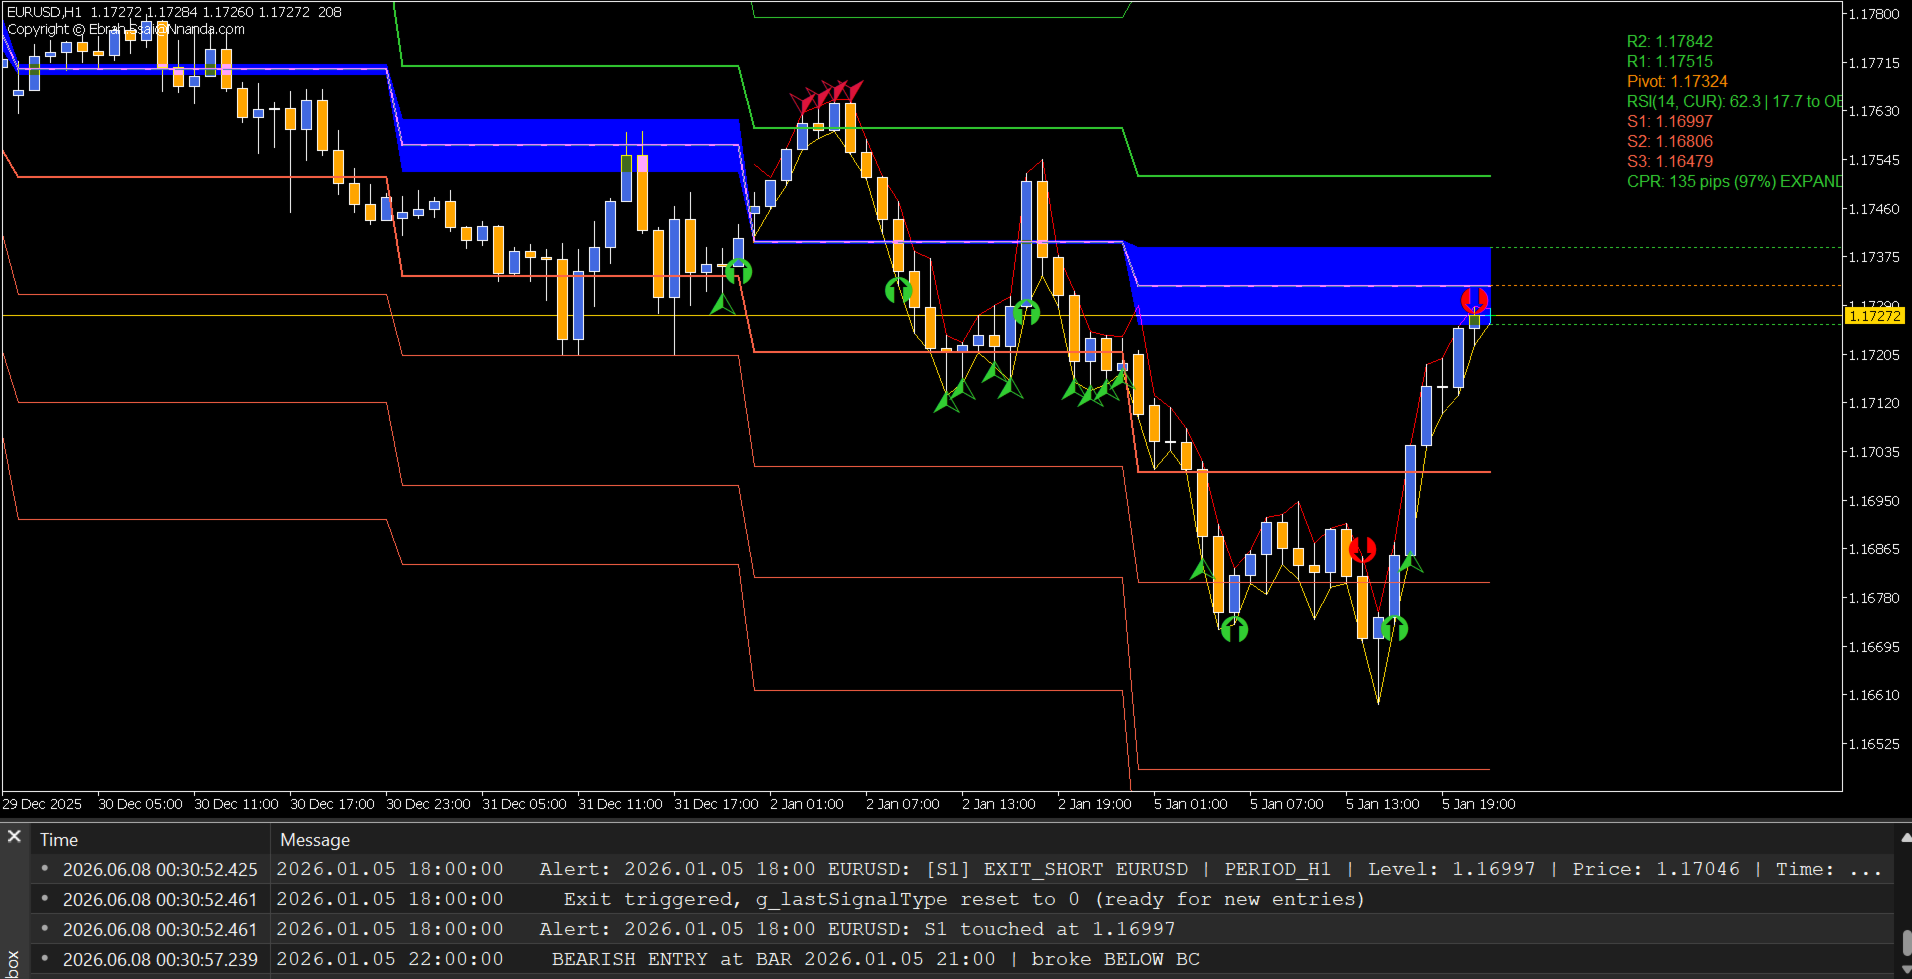
フラットな静止線を描くだけの一般的なピボットインジケーターとは異なり、本フレームワークは市場のセッションを認識した「過去のピボット(履歴)」を生成するため、過去の市場構造を正確にチャート上へ反映します。Central Pivot Range Plusで導入された視覚的な矢印シグナルは、トレードのエントリーとエグジットの正確なタイミングを示すため、裁量トレード(ディスプレショナリー・トレード)だけでなく、自動売買(EA:エキスパートアドバイザー)にも最適です。
本フレームワークは、リアルタイムで以下の6つの重要なトレードの疑問に答えるように設計されています:
-
現在の市場構造(環境認識)はどうなっているか?
-
最良のエントリーゾーンはどこか?
-
どこでトレードにエントリーすべきか? ← 新機能
-
どこでトレードをエグジットすべきか? ← 新機能
-
シグナルの強度はどのくらいか?
-
リスク管理(損切りなど)はどこで行うべきか?
各シグナルには、複数のタイムフレームの一致(アライメント)から算出される「コンフルエンス・スコア(合流度)」が含まれており、トレーダーはすべてのトレードセットアップに対して定量化された信頼度を把握することができます。矢印シグナルにより、即座にアクションへ移せる取引判断が可能になります。
CPR Pivot Range Plus バージョンの新機能
エントリーシグナル(AUTO モード)
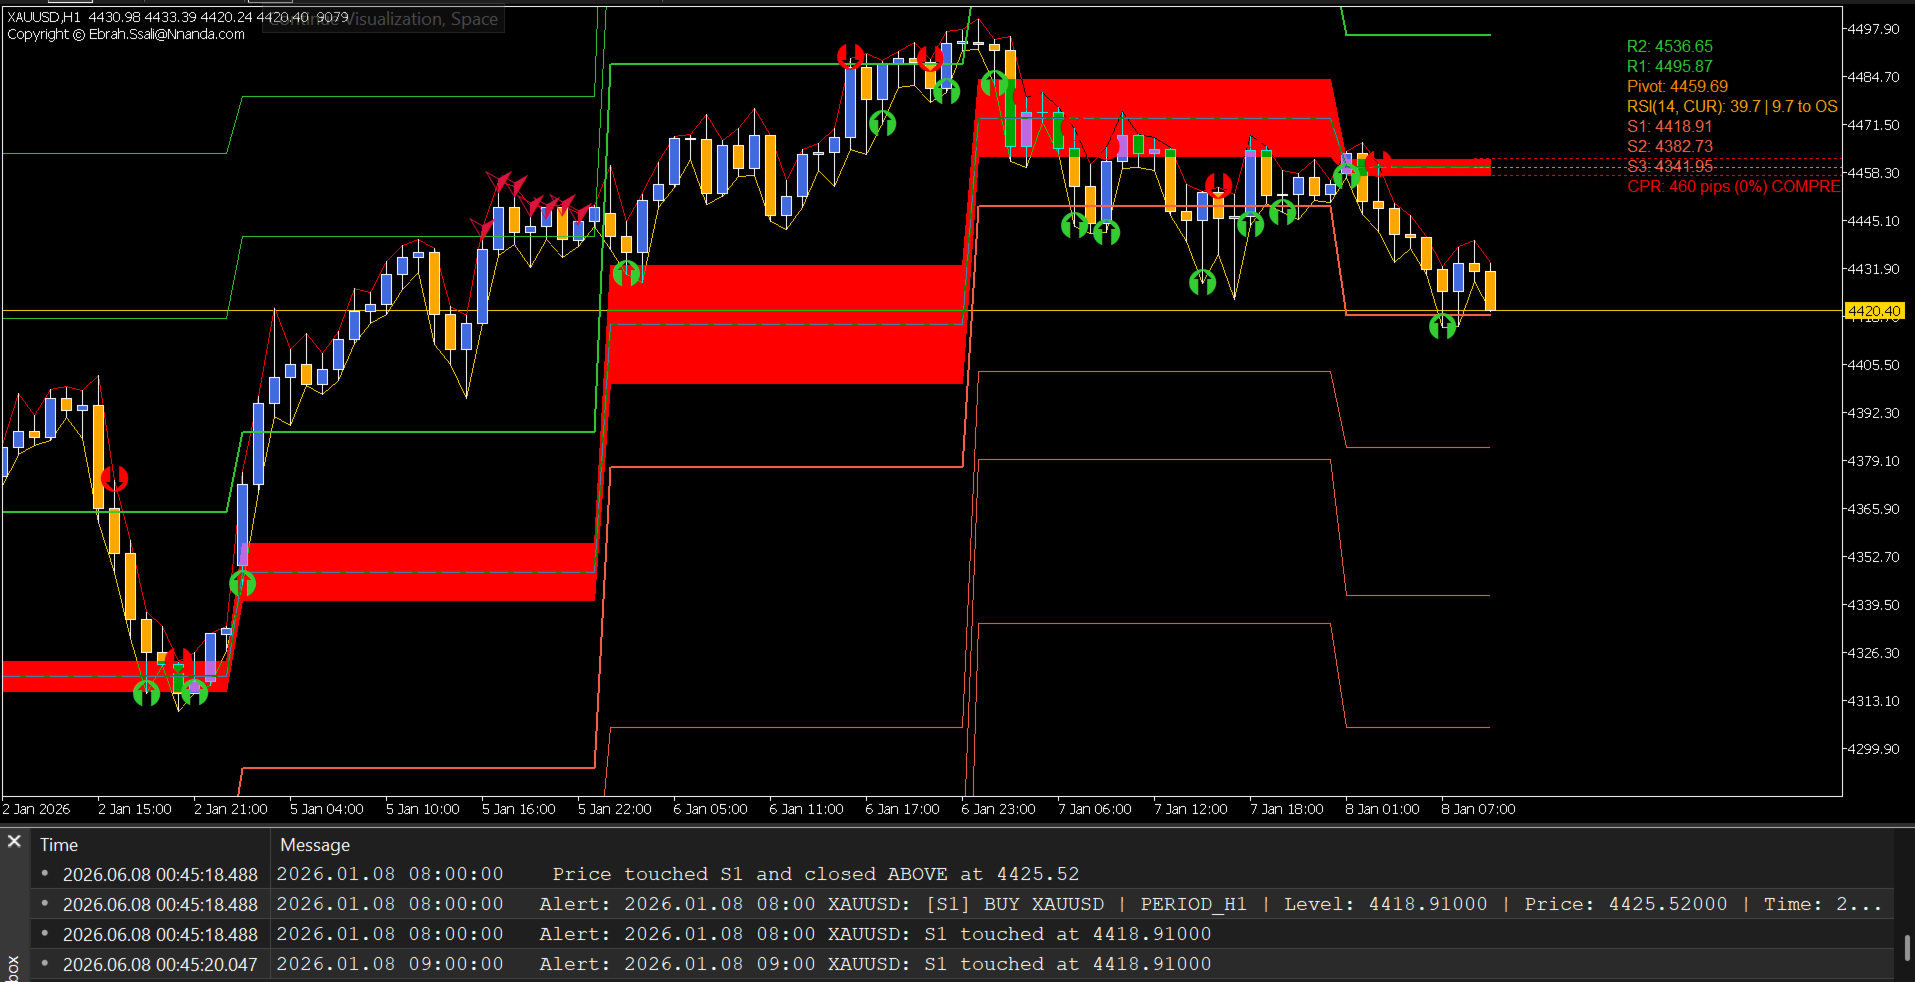
価格がキーレベルでブレイクアウトまたは反転を確認すると、インジケーターがチャート上に緑色の買い矢印(BUY ARROWS)と赤色の売り矢印(SELL ARROWS)を直接プロットします。
AUTO モードの仕組み:
-
価格がローソク足の形成中にそのレベルにタッチ(TOUCH)する必要がある。
-
価格がそのレベルより上で終値を迎える(CLOSE ABOVE) = BUY 矢印を表示。
-
価格がそのレベルより下で終値を迎える(CLOSE BELOW) = SELL 矢印を表示。
-
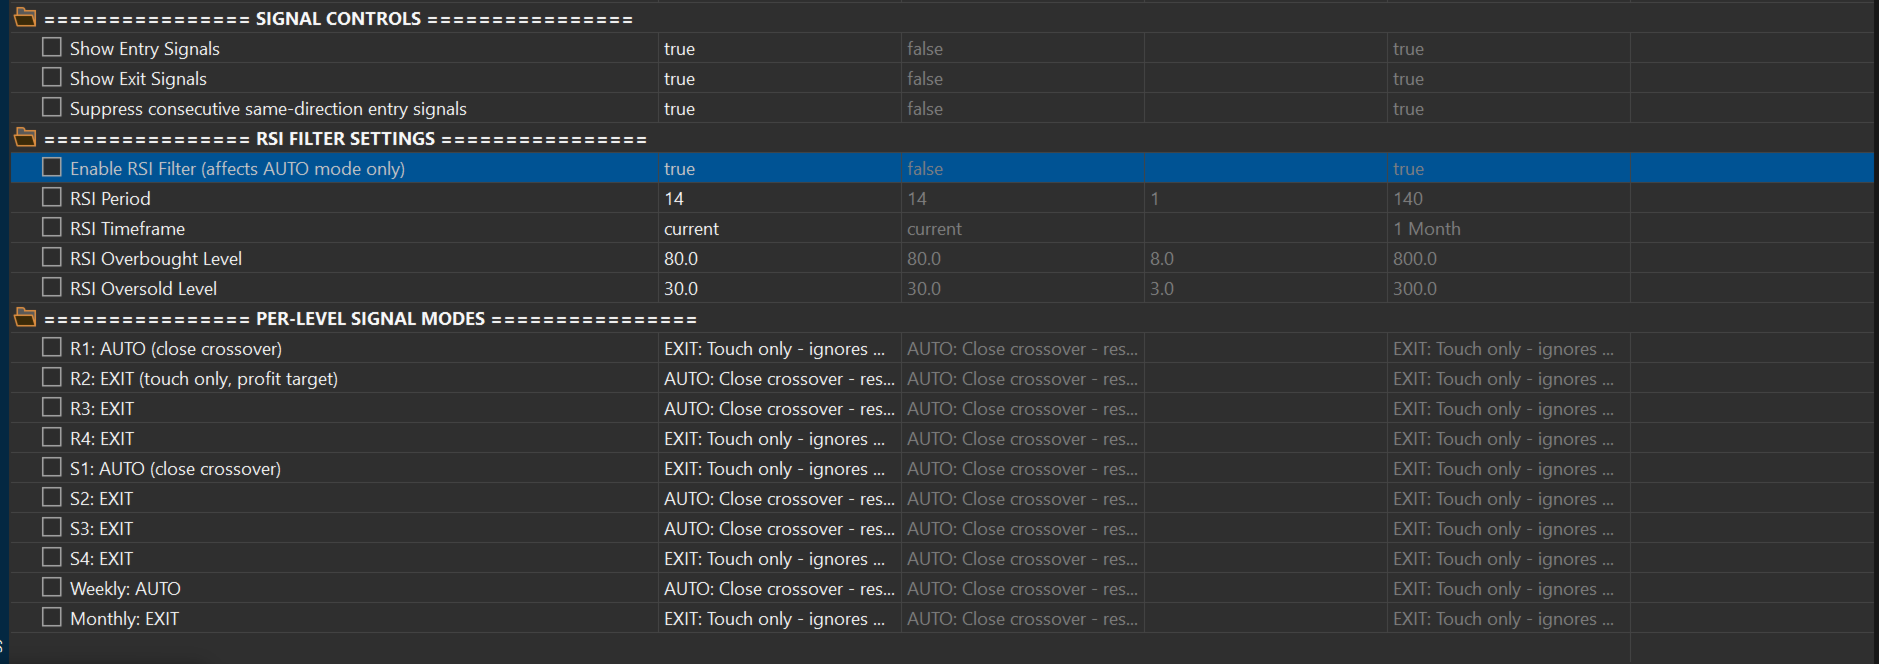
RSIフィルターにより、買われすぎ/売られすぎエリアでのエントリーをブロック。
AUTO モードはすべてのレベルで動作します(完全カスタマイズ可能)
-
例 - 積極的(アグレッシブ)なトレード設定:
-
R1 = AUTO(レジスタンス1でショート/売りエントリー)
-
R2 = AUTO(さらに高いレジスタンス2でショートを買い増し/ナンピン)
-
S1 = AUTO(サポート1でロング/買いエントリー)
-
S2 = AUTO(さらに低いサポート2でロングを買い増し/ナンピン)
-
より高いレベル = EXIT(利益確定)
-
-
例 - 保守的(コンサバティブ)なトレード設定:
-
R1 = EXIT(最初のレジスタンスで利益確定)
-
S1 = EXIT(最初のサポートで利益確定)
-
R2 = EXIT(追加の利益ターゲット)
-
S2 = EXIT(追加の利益ターゲット)
-
リスク許容度やトレードスタイルに合わせて、すべてのレベルを個別に設定できます。
エグジットシグナル(EXIT モード)
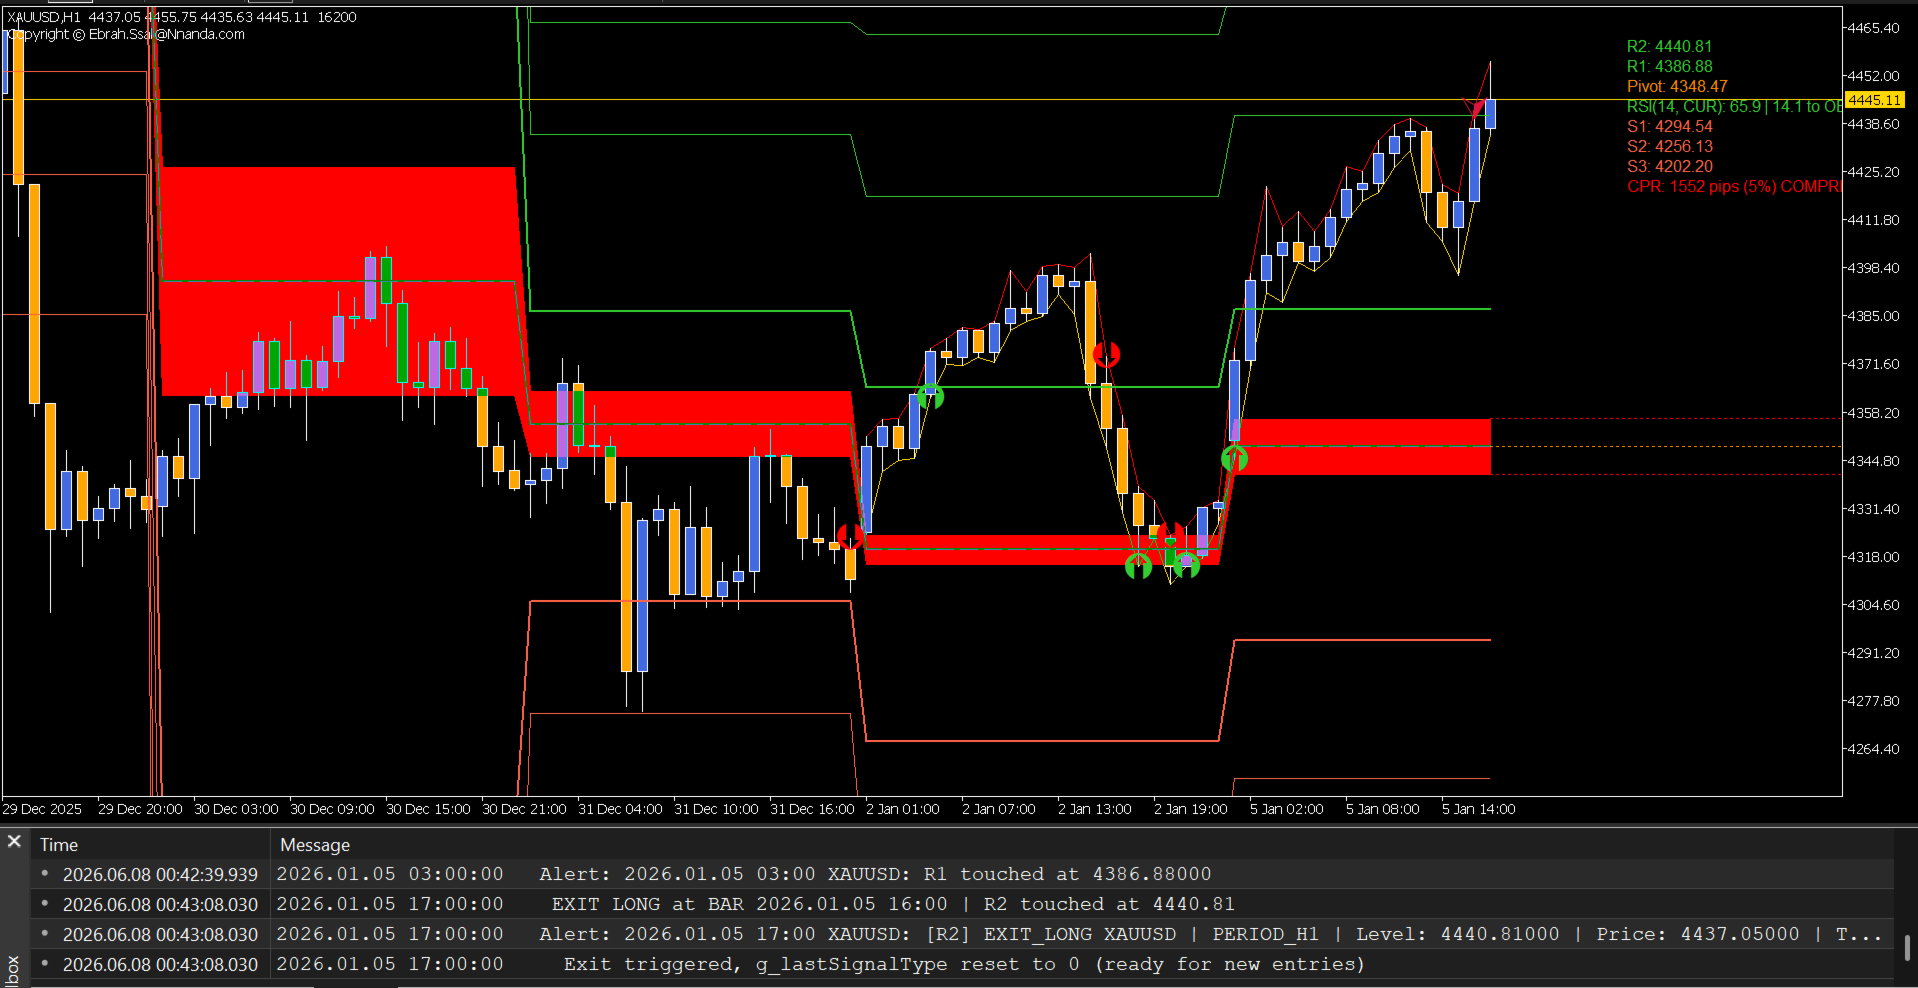
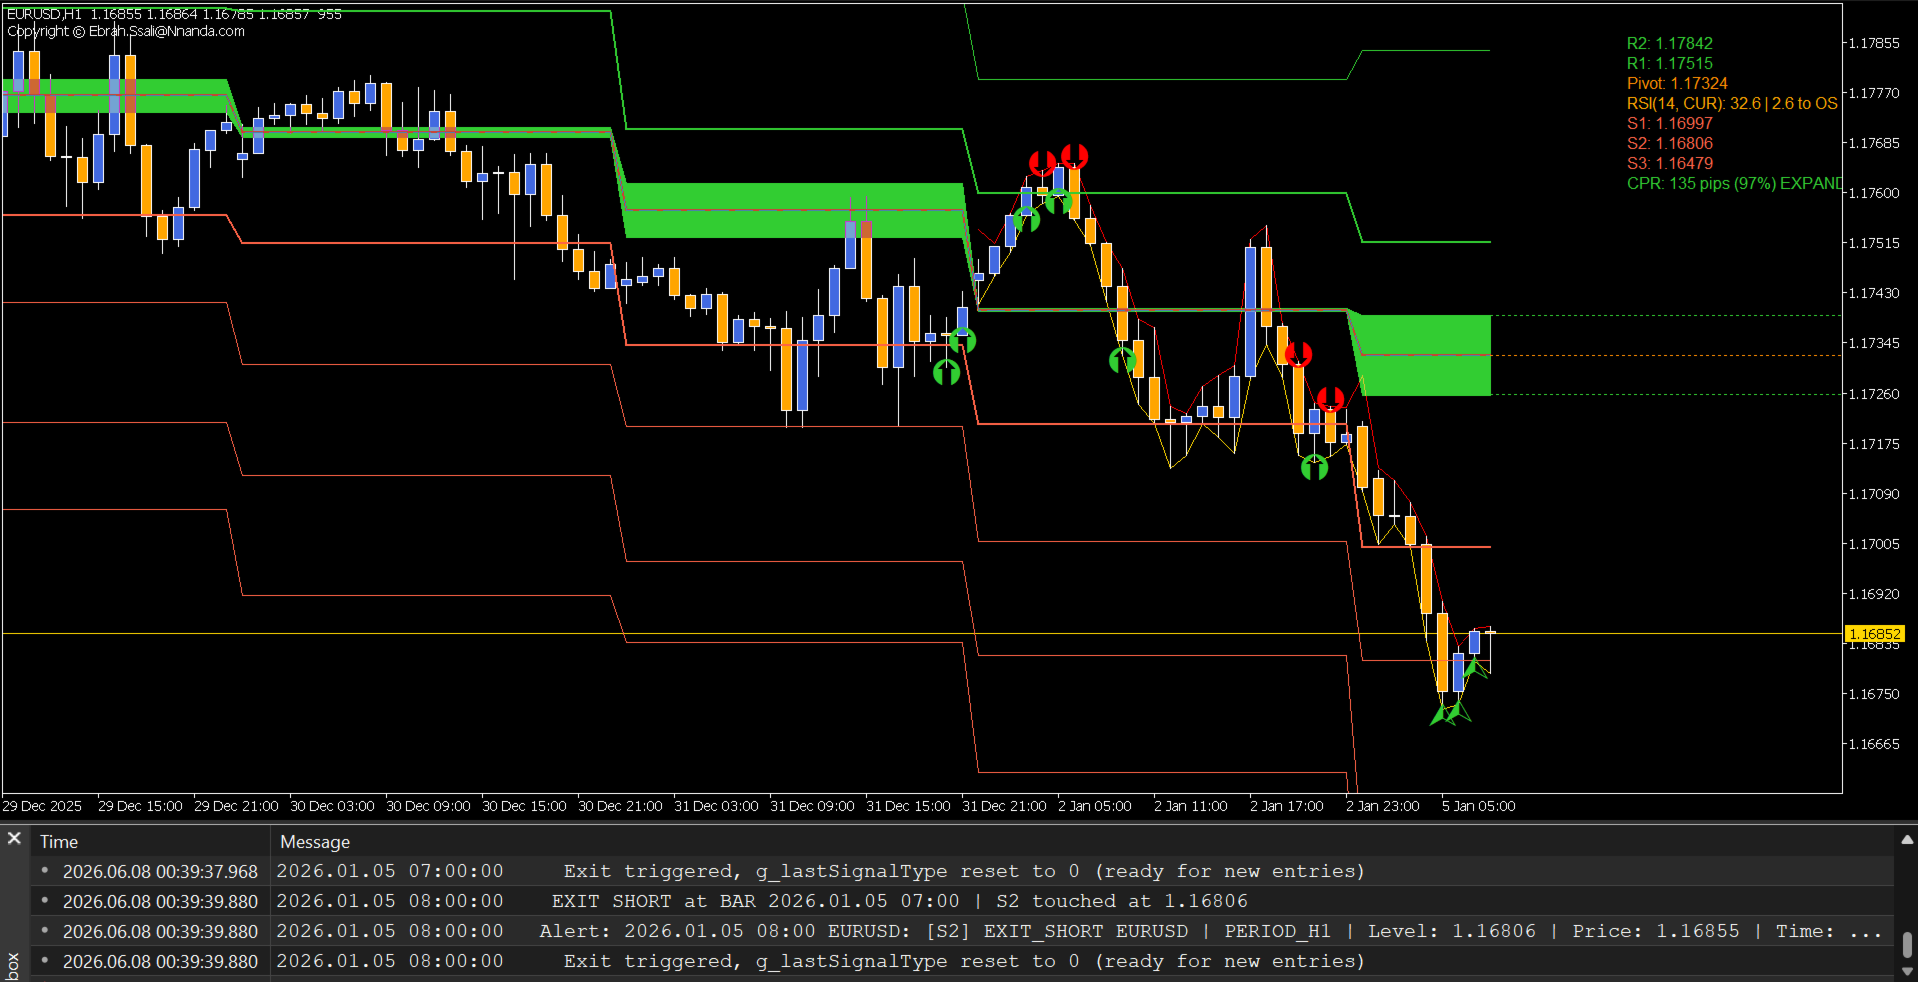
価格が利確ゾーンにタッチすると、インジケーターが赤色のエグジット矢印(ロングポジション用)と緑色のエグジット矢印(ショートポジション用)をプロットします。
EXIT モードの仕組み:
-
価格が「EXITモード」に設定されたいずれかのレベルにタッチする。
-
即座にエグジットシグナルの矢印を生成。
-
RSIフィルターを無視(利益確定は常に許可されます)。
-
エントリーフィルターをリセットし、新しいトレードを許可。
EXIT モードが動作する場所:
-
任意のレジスタンスレベル(R1, R2, R3, R4)= ロングのエグジット(Exit Long)
-
任意のサポートレベル(S1, S2, S3, S4, Monthly)= ショートのエグジット(Exit Short)
ユースケース — 複数の利益ターゲット設定(購入後にリクエストに応じて利用可能)。
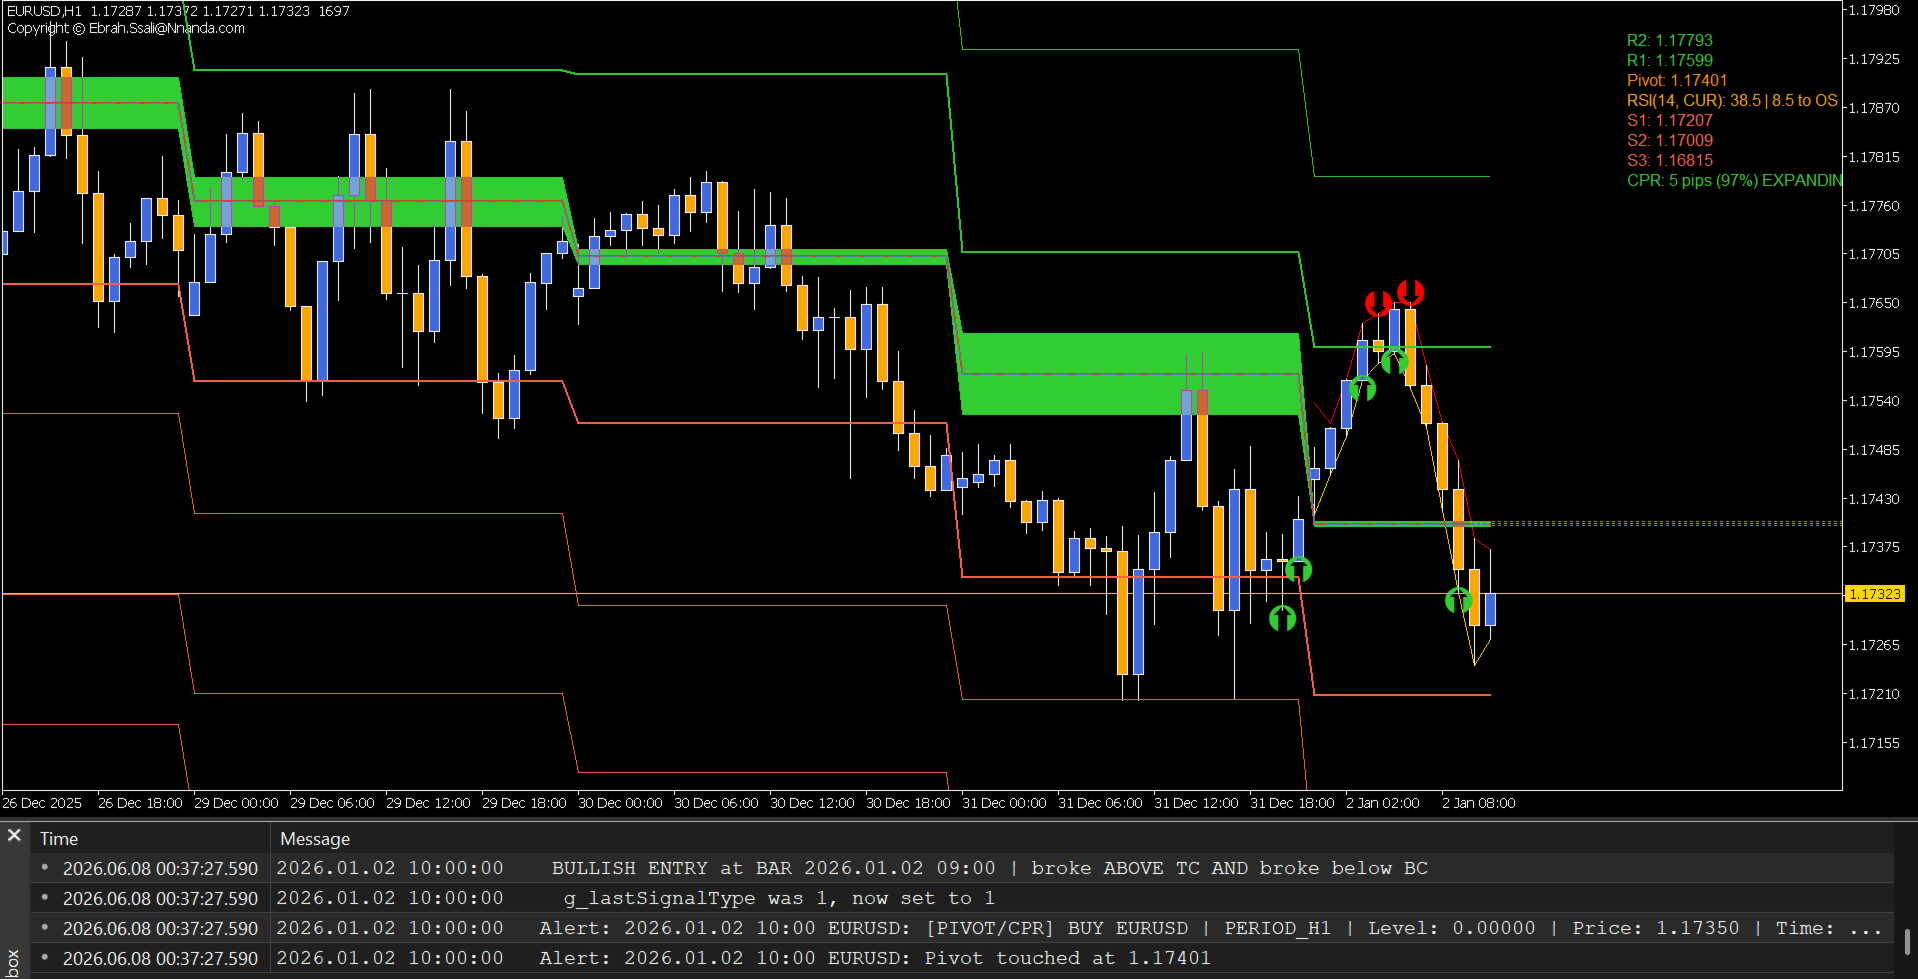
優先順位システム(PIVOT/CPRが最優先)
本フレームワークは、明確なシグナル階層(イアラルキー)を使用しています:
| 優先順位 | シグナルタイプ | 説明 |
| 最優先(HIGHEST) | PIVOT/CPR | TC/BC(機関投資家レベル)へのタッチベースのブレイク |
| 通常(NORMAL) | AUTO モード | 設定されたレベルでの「終値確定」によるエントリー |
| エグジット(EXIT) | EXIT モード | 設定されたレベルでの「タッチベース」の利益確定 |
同一のローソク足内では、PIVOT/CPRシグナルがAUTOシグナルを上書き(割込表示)するため、最も重要な市場イベントが常に最前面に表示されます。
重複シグナルの抑制(自動売買で使用する場合の過剰取引を制限)
| 設定 | 効果 | 最適なスタイル |
| ON(デフォルト) | 同一方向への連続するシグナルをブロック | トレンドフォロー、スイングトレード |
| OFF | 生成されたすべてのシグナルをプロット | スキャルピング、相場分析 |
-
抑制機能が「ON」の場合の例:
-
S1で BUY → 矢印表示
-
S1で BUY → ブロック(重複のため)
-
R1で SELL → 矢印表示(逆方向へのシグナルでフィルターがリセット)
-
S1で BUY → 矢印表示(再度許可される)
-
RSIフィルターによるスマートブロック機能
RSIフィルターは、市場が行き過ぎている(買われすぎ・売られすぎ)状態でのトレードエントリーを防ぎます:
| 条件 | アクション |
| RSI ≥ 80(買われすぎ) | BUY 矢印をブロック(天井での買いを防止) |
| RSI ≤ 30(売られすぎ) | SELL 矢印をブロック(底での売りを防止) |
| RSIが 30〜80 の間 | すべての矢印の表示を許可 |
信号機風(Traffic Light)RSIラベル表示
-
緑(GREEN): 安全ゾーン(閾値まで残り50%以上)
-
オレンジ(ORANGE): 注意ゾーン(閾値まで残り50〜90%)
-
赤(RED): 危険ゾーン(閾値まで残り90%以上)
主要機能サマリー
| 機能 | 説明 |
| BUY 矢印(バッファ 25) | AUTOモードが強気のエントリーをトリガーした際、緑色の上向き矢印を表示 |
| SELL 矢印(バッファ 26) | AUTOモードが弱気のエントリーをトリガーした際、赤色の下向き矢印を表示 |
| Exit Long(バッファ 27) | EXITモードのレジスタンスレベルにタッチした際、**赤色のドット(点)**を表示 |
| Exit Short(バッファ 28) | EXITモードのサポートレベルにタッチした際、**緑色のドット(点)**を表示 |
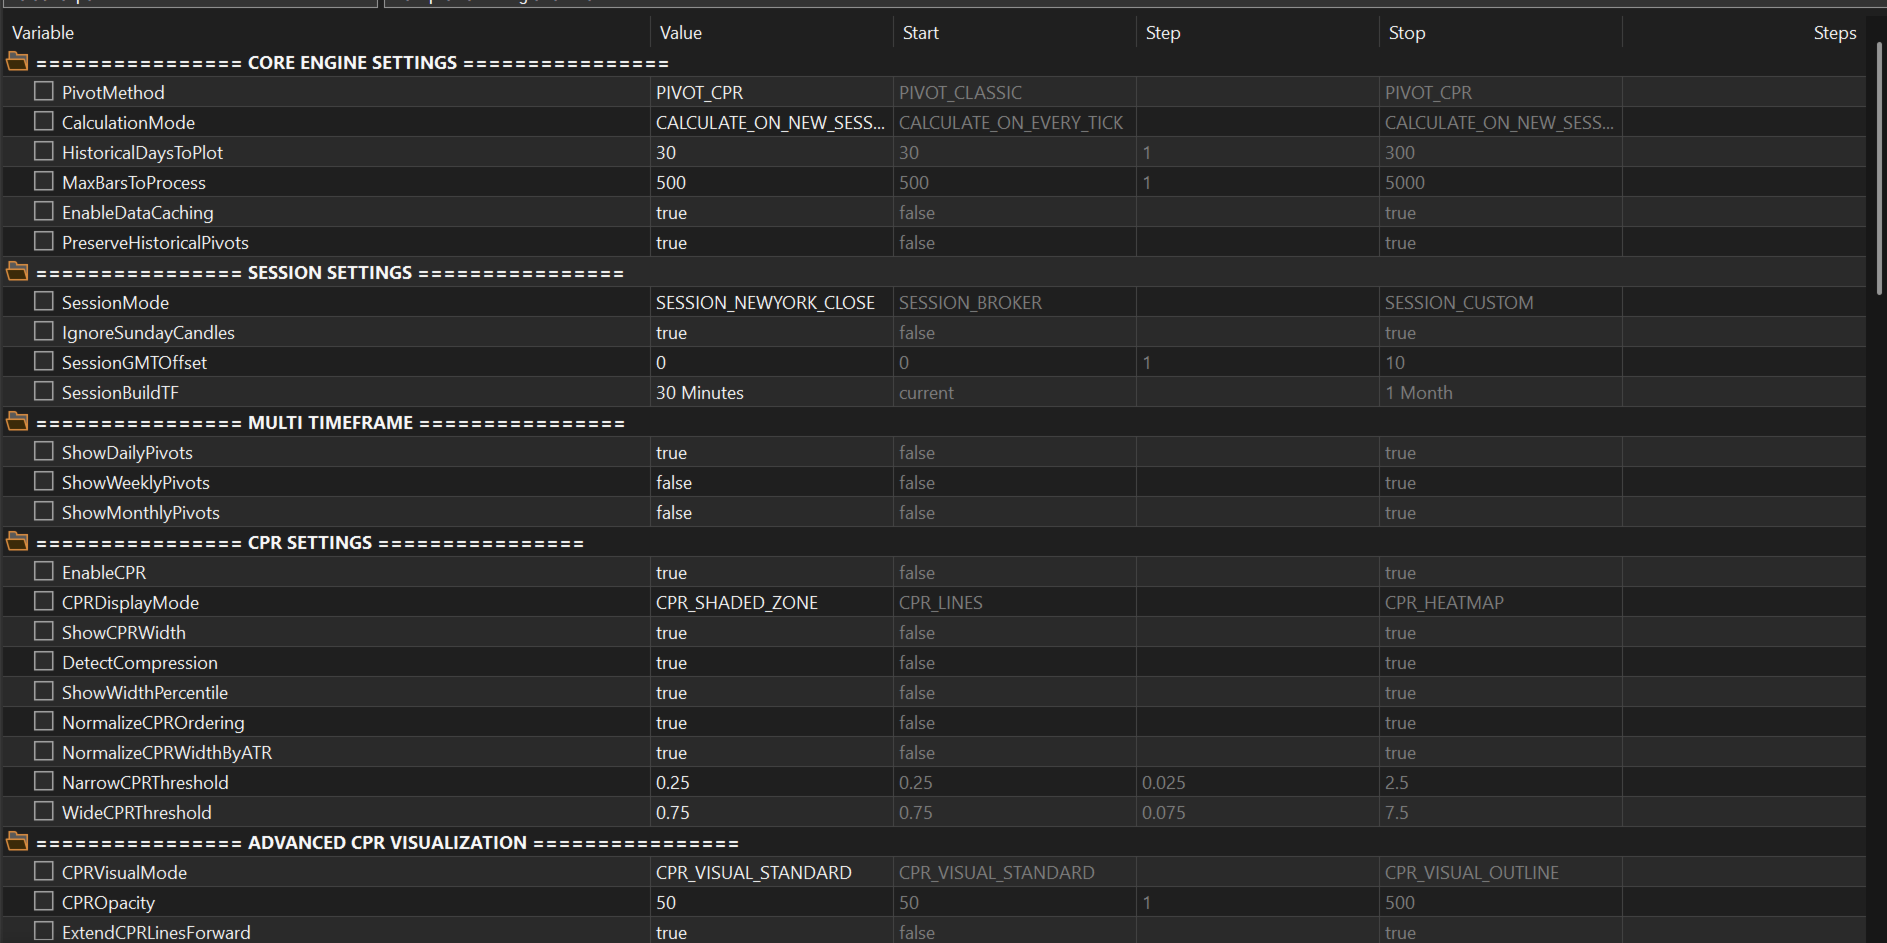
| 6つのピボット計算式 | Classic、Woodie、Fibonacci、Camarilla、DeMark、および CPR |
| セッション認識計算 | NY Close(ニューヨーククローズ)、ロンドン、東京、ブローカー時間、またはカスタムセッション |
| 過去ピボットのキャッシュ | 過去のすべてのローソク足が、それぞれのピボット値を保持 |
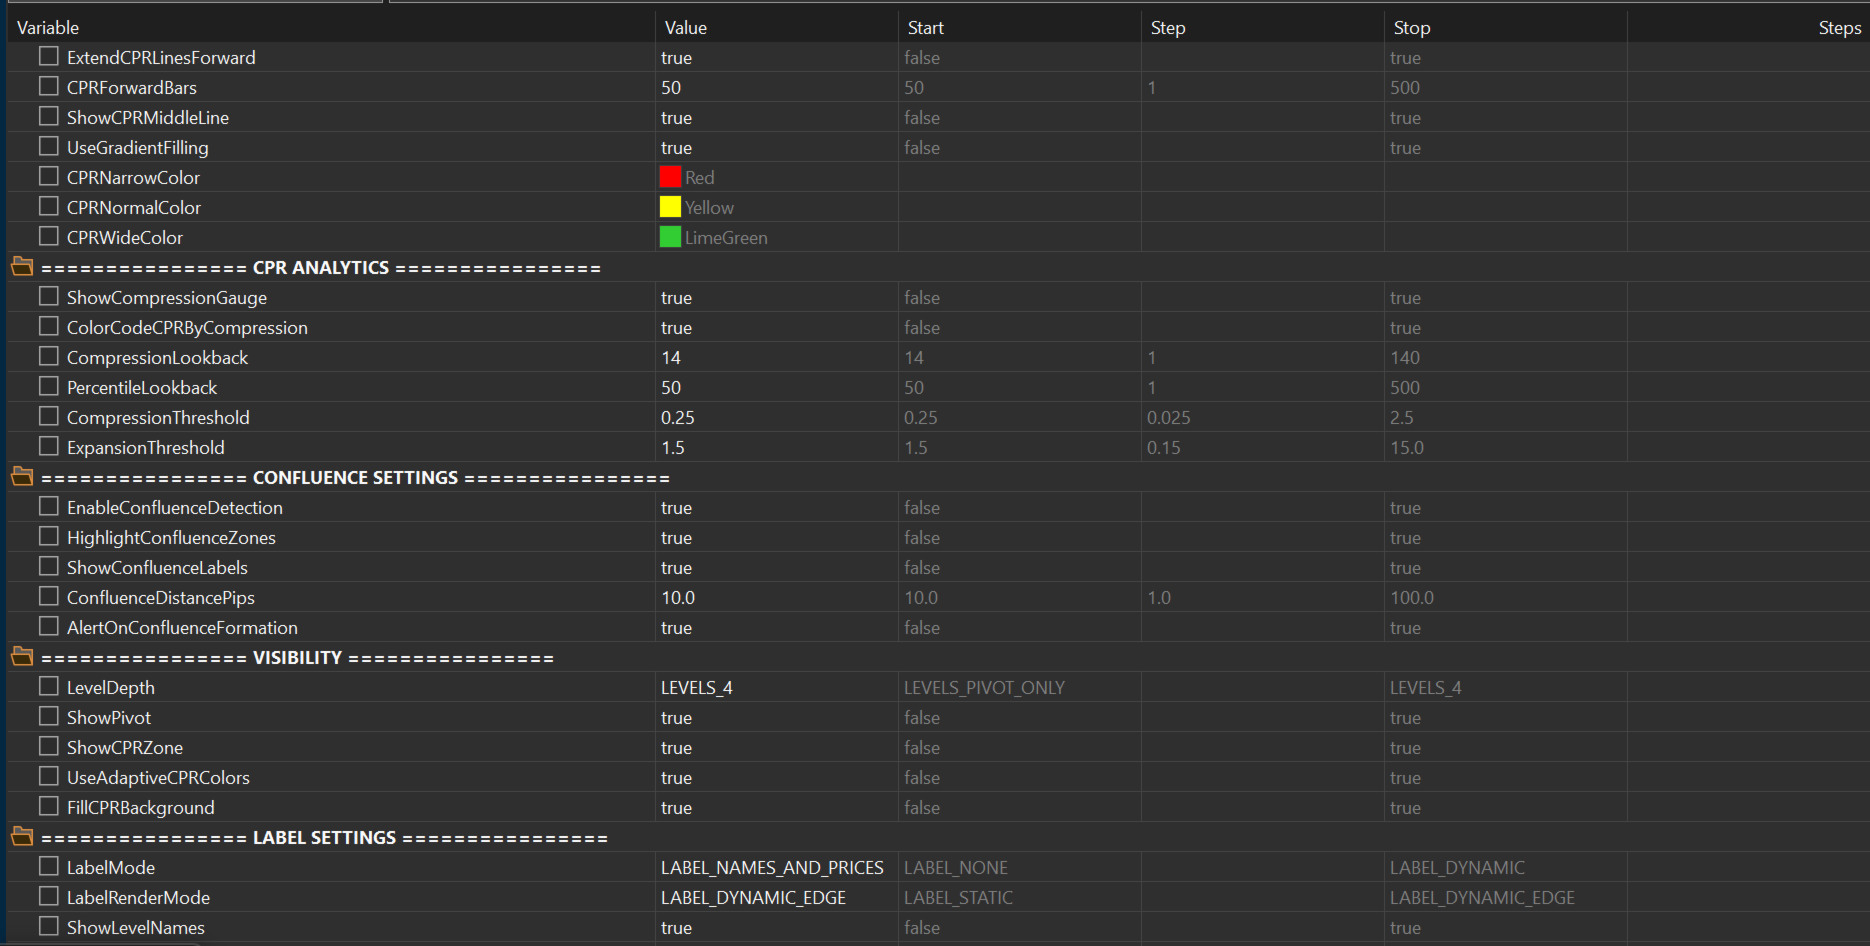
| CPRスクイーズ(圧縮)分析 | 幅比率、パーセンタイル順位、アライメントに応じた自适应カラーリング |
| マルチタイムフレーム合流 | 日足 + 週足 + 月足のレベルの一致を自動検知 |
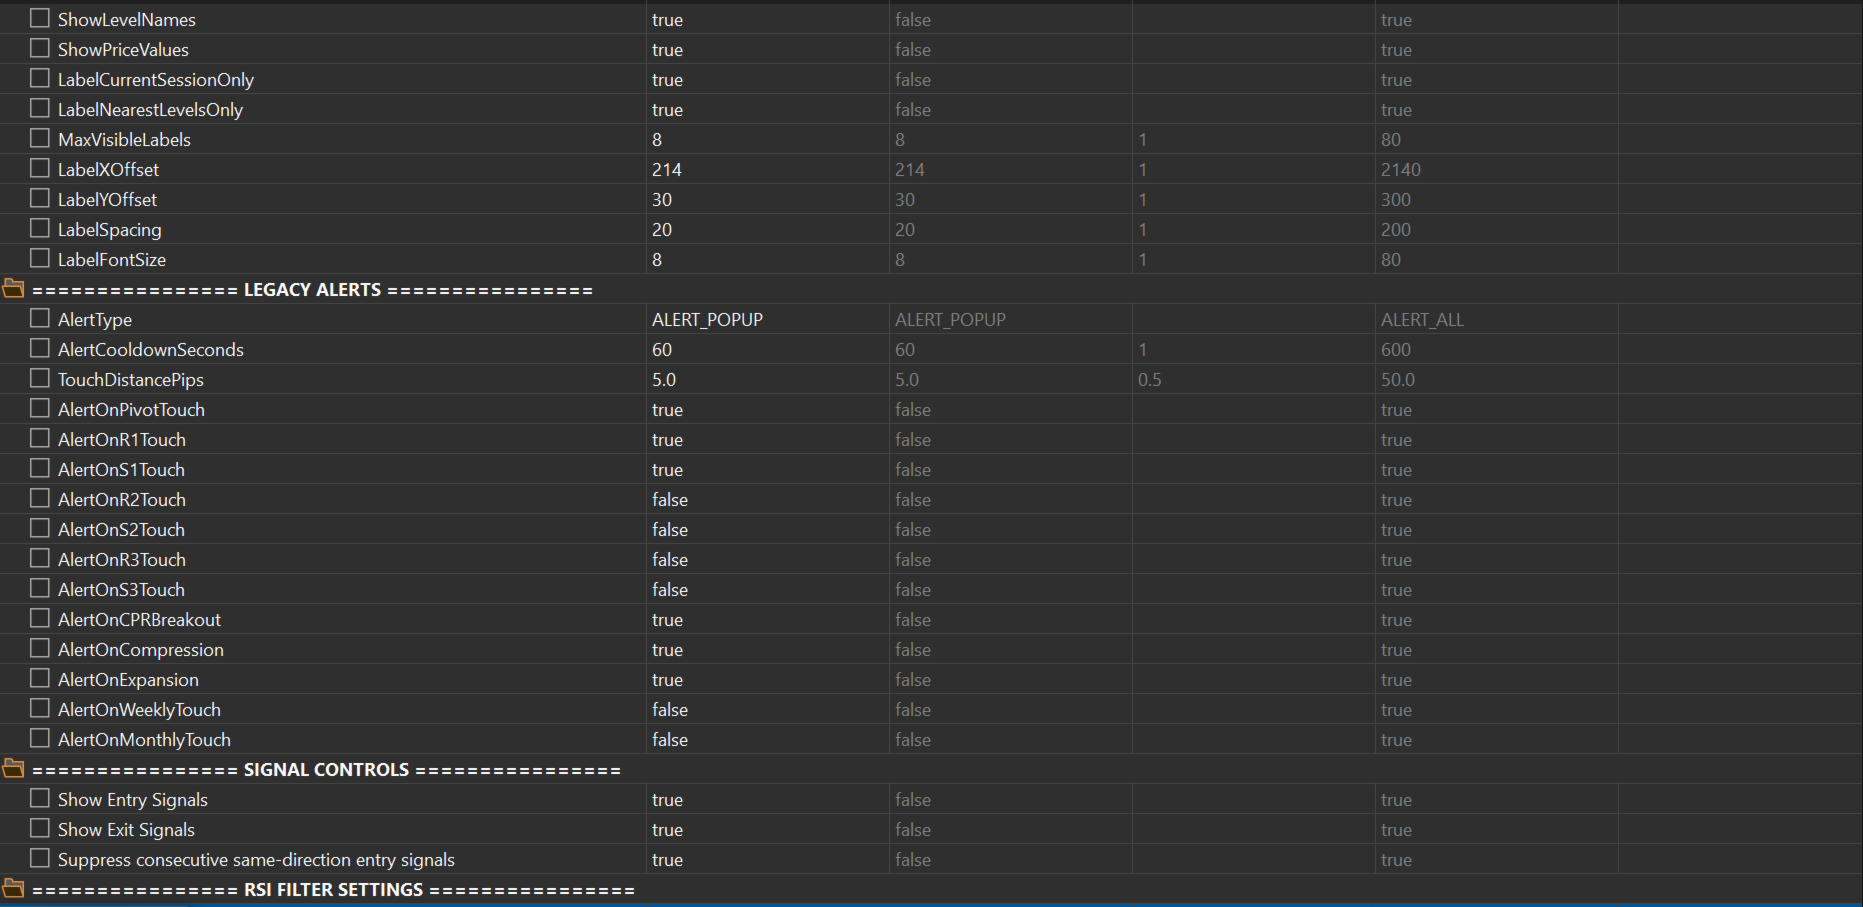
| リアルタイムアラート | タッチ、ブレイクアウト、スクイーズ(圧縮)、エクスパンション(拡張)のアラート |
| ダイナミックラベル | チャート右端に自動で重なりを防ぎ配置される、位置調整可能なラベル |
| CPRビジュアライズモード | スタンダード、ヒートマップ、グラデーション、アウトライン |
| 先行投影(フォワードプロジェクション) | 将来のローソク足に向けてCPRゾーンを予測表示 |
| EA対応アーキテクチャ | 自動売買やエキスパートアドバイザー向けに専用バッファを割り当て |
| RSIフィルター | 高値圏でのBUYシグナル、安値圏でのSELLシグナルを自動ブロック |
| シグナル重複抑制 | 同一方向への連続シグナルによる「シグナルスパム」を防止 |
このインジケーターが解決するトレードの疑問
| トレードの疑問 | インジケーターによる回答方法 |
| 市場構造(環境認識) | 日足、週足、月足のピボットがトレンドの背景を定義 |
| どこでエントリーするか? | 設定されたAUTOレベルにBUY/SELLの矢印を表示 ← 新機能 |
| どこでエグジットするか? | 設定されたEXITレベルにエグジット用のドットを表示 ← 新機能 |
| シグナルの強度 | コンフルエンス(合流)スコアによりセットアップの質を判定 |
| リスクパラメータ | CPRのスクイーズ(幅の縮小)がボラティリティの急拡大を警告 |
| 即座のアクション | リアルタイムの矢印が、即座の注文執行のトリガーを提供 |
| 損切り(ストップロス)の配置 | 次のサポート/レジスタンスレベルが自然な防壁として機能 |
| 利益ターゲット | 対向するピボットレベル、またはEXITモードのレベルが目標値を定義 |
-
EA自動売買用のシグナルバッファ設定 (購入後にリクエストに応じて提供)
-
AUTO/EXIT 矢印を使用した3つのトレード戦略 (購入後にリクエストに応じて提供)
-
テクニカル仕様・スペック (購入後にリクエストに応じて提供)
プロフェッショナルなトレードへの応用
本フレームワークは、以下を必要とするトレーダー向けに設計されています:
-
主要なサポート/レジスタンスレベルでの視覚的なエントリーシグナル
-
利確(プロフィットターゲット)ゾーンでの視覚的なエグジットシグナル
-
機関投資家スタイルの市場構造分析
-
複数タイムフレームにおけるピボットの合流(重なり)
-
ボラティリティの収縮(スクイーズ)検知
-
精密なサポート/レジスタンスのマッピング
-
EA(自動売買)に即時組み込み可能なシグナル自動化
-
信頼性の高い過去データでのバックテスト
矢印があなたに「何をすべきか」を正確に伝えます:
-
▲ 緑色の上向き矢印 = このレベルで 買い(BUY)
-
▼ 赤色の下向き矢印 = このレベルで 売り(SELL)
-
● 赤色のドット = 買い(LONG) ポジションのエグジット
-
● 緑色のドット = 売り(SHORT) ポジションのエグジット
簡単な使用方法と設定
クイックスタート(5分で完了)
-
インジケーターを H1(1時間足) チャートに適用します。
-
PivotMethod = PIVOT_CPR を選択します。
-
LevelDepth = LEVELS_2 に設定します。
-
戦略を選択します:
-
積極型(アグレッシブ): R1/R2/S1/S2 = AUTO に設定
-
保守型(コンサバティブ): R1/S1 = EXIT に設定
-
-
必要に応じてRSIフィルターを有効(Enable)にします。
-
緑色/赤色の矢印の発生を待ちます(色は好みに合わせて変更可能です)。
ほとんどのトレーダーは、以下のパラメータを調整するだけで十分です:
| 入力パラメータ(Input) | 推奨設定 |
| PivotMethod | PIVOT_CPR |
| SessionMode | SESSION_NEWYORK_CLOSE |
| LevelDepth | LEVELS_2 |
| SigModeR1 | AUTO または EXIT(お好みで選択) |
| SigModeS1 | AUTO または EXIT(お好みで選択) |
| AlertType | ALERT_POPUP または ALERT_ALL |
キーワード(KEYWORDS)
pivot points, CPR, central pivot range, support resistance, market structure, multi-timeframe, confluence detection, compression analysis, volatility indicator, entry signals, exit signals, buy arrows, sell arrows, profit taking, MT5 indicator, trading system, trade entries, trade exits, stop loss placement, take profit levels, automated trading, EA friendly, forex indicator, institutional trading, professional trader tool, daily pivots, weekly pivots, monthly pivots, classical pivots, woodie pivots, fibonacci pivots, camarilla pivots, demark pivots, visual trading signals, arrow signals, entry confirmation, exit confirmation, ピボットポイント, サポートレジスタンス, 構造分析, エントリーシグナル, エグジットシグナル, 自動売買.
サポート
連絡先: ebrah.ssali@Nnanda.com
Central Pivot Range Plusは、優れた分析ツールであったCPR Pivot Frameworkを、「いつエントリーし、いつエグジットすべきか」を正確に指示するアクティブなトレーディングシステムへと進化させます。