Central Pivot Range Plus
- 지표
- 버전: 2.0
- 활성화: 5

CPR Pivot Range Plus Framework v2.0 - 프로페셔널 멀티 타임프레임 피봇 포인트 및 CPR 인지케이터
개요
CPR Pivot Framework v2.0은 6가지 피봇 계산 메서드와 중앙 피봇 범위(CPR) 분석, 멀티 타임프레임 중첩(Confluence) 감지 기능, 그리고 새롭게 탑재된 지능형 진입 및 청산 화살표 시그널을 결합한 프로페셔널 등급의 기관 투자자용 트레이딩 툴입니다.
단순히 평평하고 정적인 선만 그리는 일반적인 피봇 지표와 달리, 본 프레임워크는 시장 세션을 완벽히 인식하여 과거의 시장 구조를 정확하게 반영하는 역사적 피봇(Historical Pivots)을 생성합니다. Central Pivot Range Plus에 도입된 시각적 화살표 시그널은 정확한 진입 및 청산 시점을 차트 위에 직관적으로 표시해주므로, 재량 매매(Discretionary Trading)뿐만 아니라 자동 매매 프로그램(EA: Expert Advisors)에도 매우 적합합니다.
본 프레임워크는 실시간으로 트레이딩의 6가지 핵심 질문에 답할 수 있도록 설계되었습니다:
-
현재의 시장 구조(환경 분석)는 어떠한가?
-
가장 좋은 진입 구역(Zone)은 어디인가?
-
정확히 어디에서 진입해야 하는가? ← 신기능
-
정확히 어디에서 청산해야 하는가? ← 신기능
-
이 시그널의 강도는 어느 정도인가?
-
리스크 관리(손절 등)는 어디서 해야 하는가?
각 시그널에는 여러 타임프레임의 정렬 상태를 기반으로 도출된 중첩 점수(Confluence Score)가 포함되어 있어, 트레이더에게 모든 셋업에 대한 정량화된 신뢰도를 제공합니다. 화살표 시그널은 즉각적이고 실행 가능한 매매 판단을 내려줍니다.
CPR Pivot Range Plus 버전의 새로운 기능
진입 시그널 (AUTO 모드)
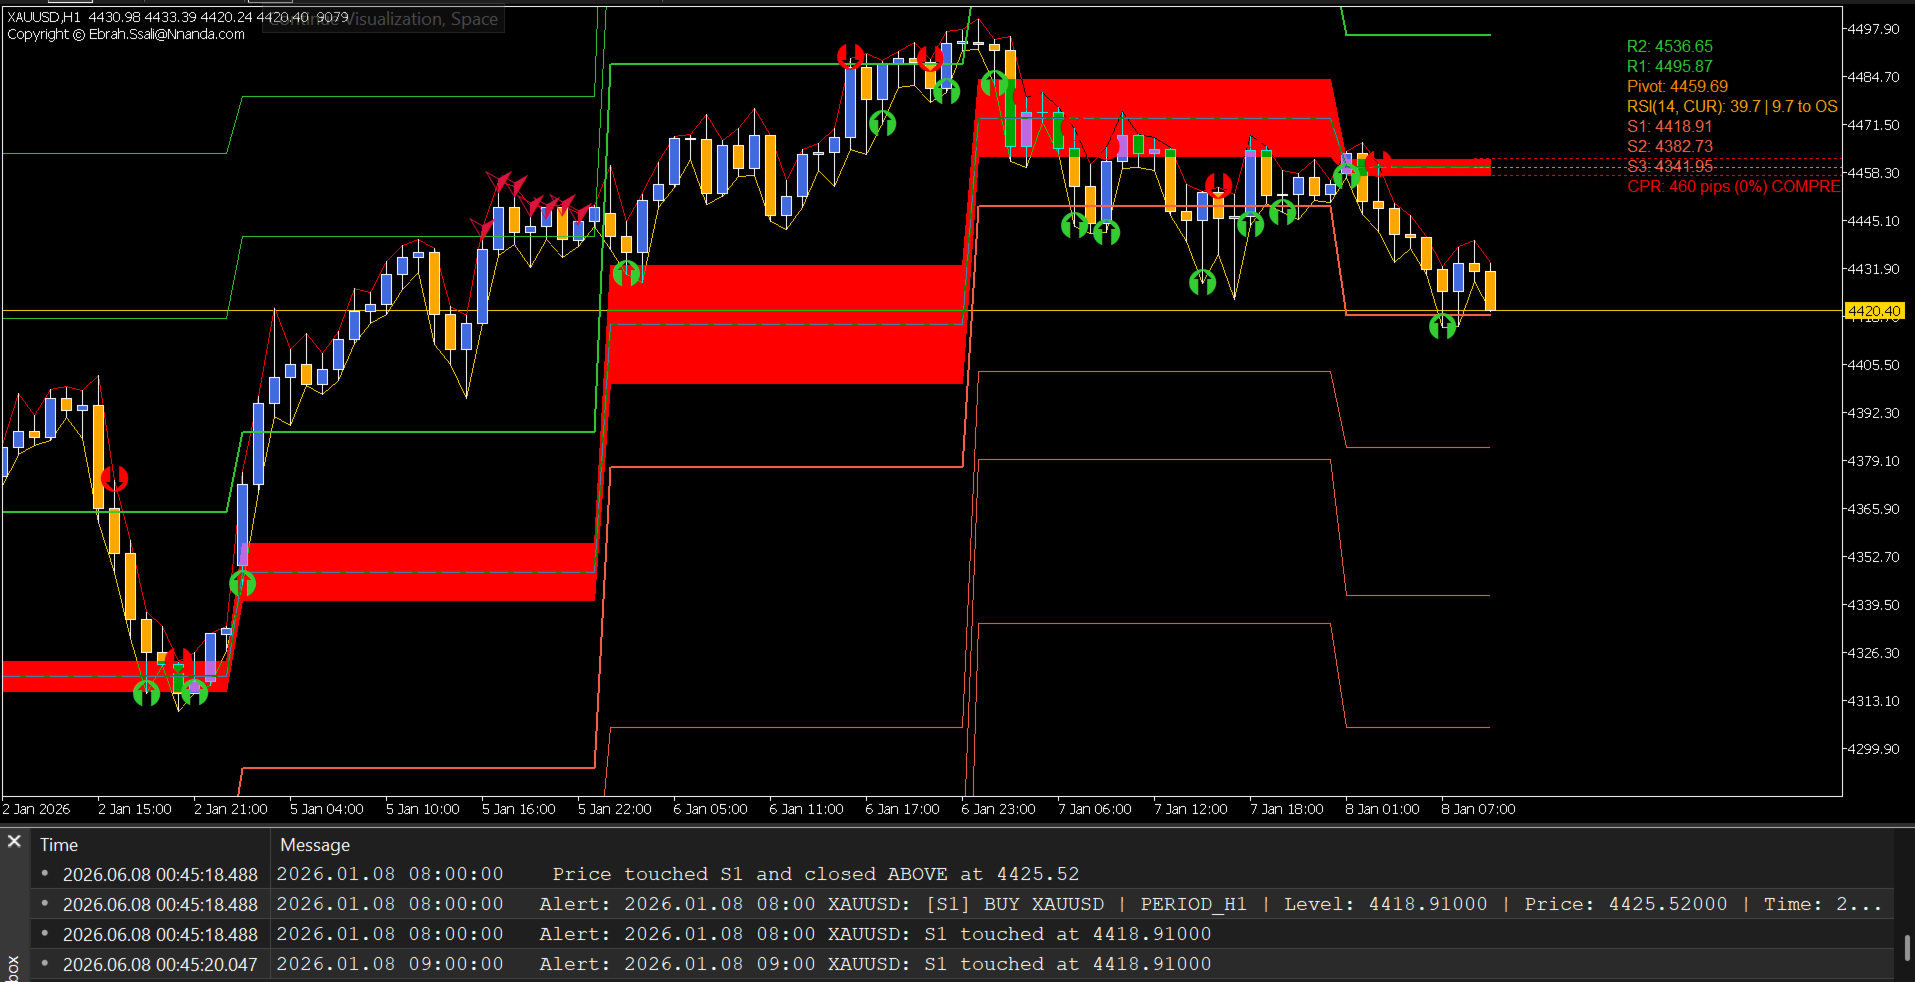
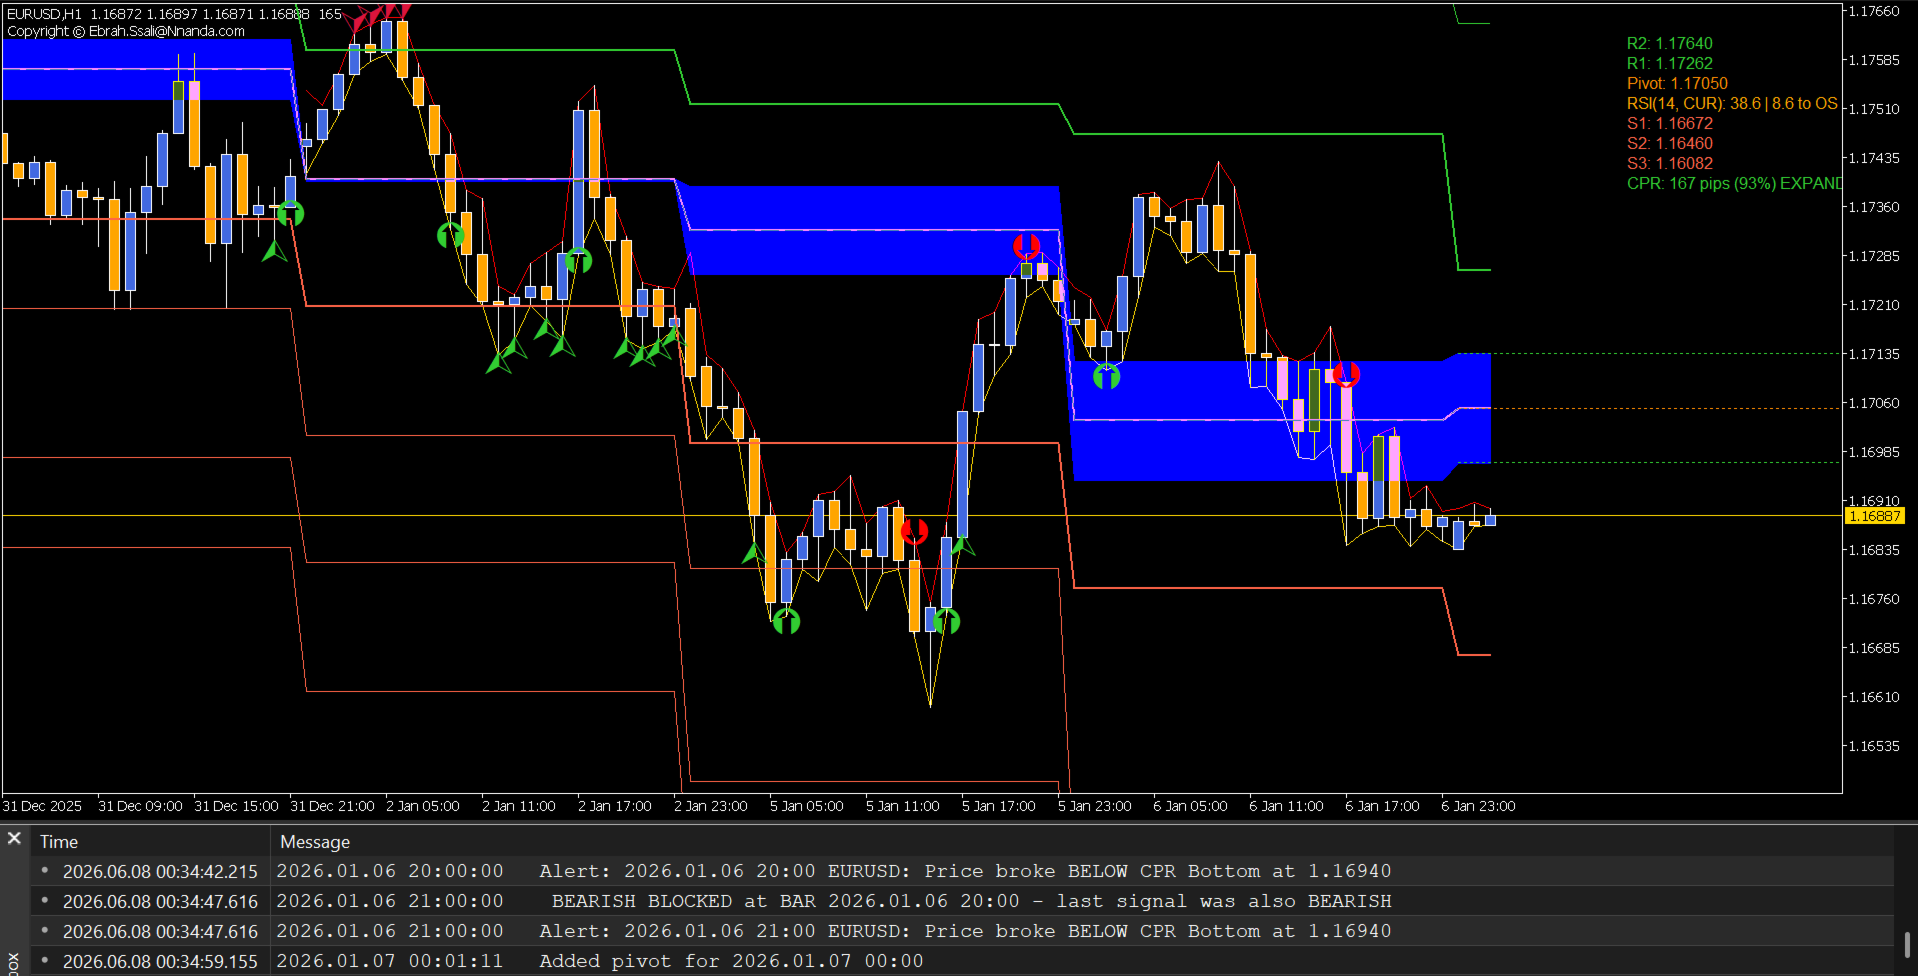
가격이 주요 레벨에서 돌파(Breakout) 또는 반전(Reversal)을 확정 지으면, 인지케이터가 차트 위에 녹색 매수 화살표(BUY ARROWS)와 적색 매도 화살표(SELL ARROWS)를 직접 표시합니다.
AUTO 모드 작동 원리:
-
가격이 해당 캔들 내에서 반드시 레벨을 터치(TOUCH)해야 함.
-
가격이 레벨 위에서 종가 마감(CLOSE ABOVE) = BUY 화살표 생성.
-
가격이 레벨 아래에서 종가 마감(CLOSE BELOW) = SELL 화살표 생성.
-
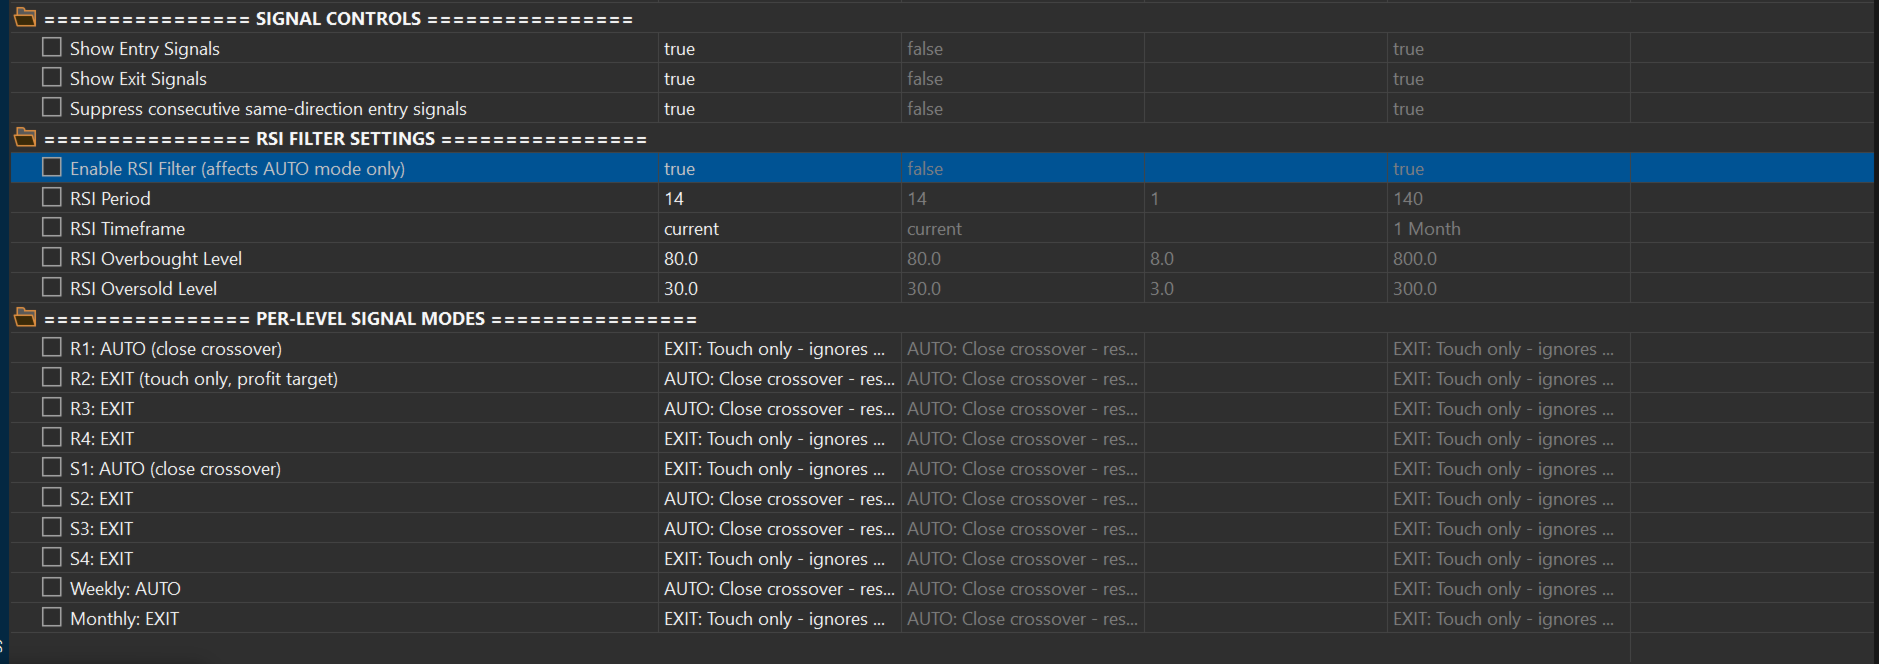
RSI 필터가 과매수/과매도 구간에서의 무리한 진입을 자동으로 차단.
AUTO 모드는 모든 레벨에서 작동합니다 (완전한 사용자 맞춤 설정 가능)
-
예시 - 공격적인(Aggressive) 트레이딩 셋업:
-
R1 = AUTO (저항 1레벨에서 숏/매도 진입)
-
R2 = AUTO (더 높은 저항 2레벨에서 숏 물량 추가 불타기/불타기)
-
S1 = AUTO (지지 1레벨에서 롱/매수 진입)
-
S2 = AUTO (더 낮은 지지 2레벨에서 롱 물량 추가 불타기/불타기)
-
더 높은 레벨 = EXIT (수익 청산)
-
-
예시 - 보수적인(Conservative) 트레이딩 셋업:
-
R1 = EXIT (첫 번째 저항에서 1차 익절)
-
S1 = EXIT (첫 번째 지지에서 1차 익절)
-
R2 = EXIT (추가 목표가 익절)
-
S2 = EXIT (추가 목표가 익절)
-
트레이더 본인의 리스크 성향과 매매 스타일에 따라 모든 레벨을 독립적으로 설정할 수 있습니다.
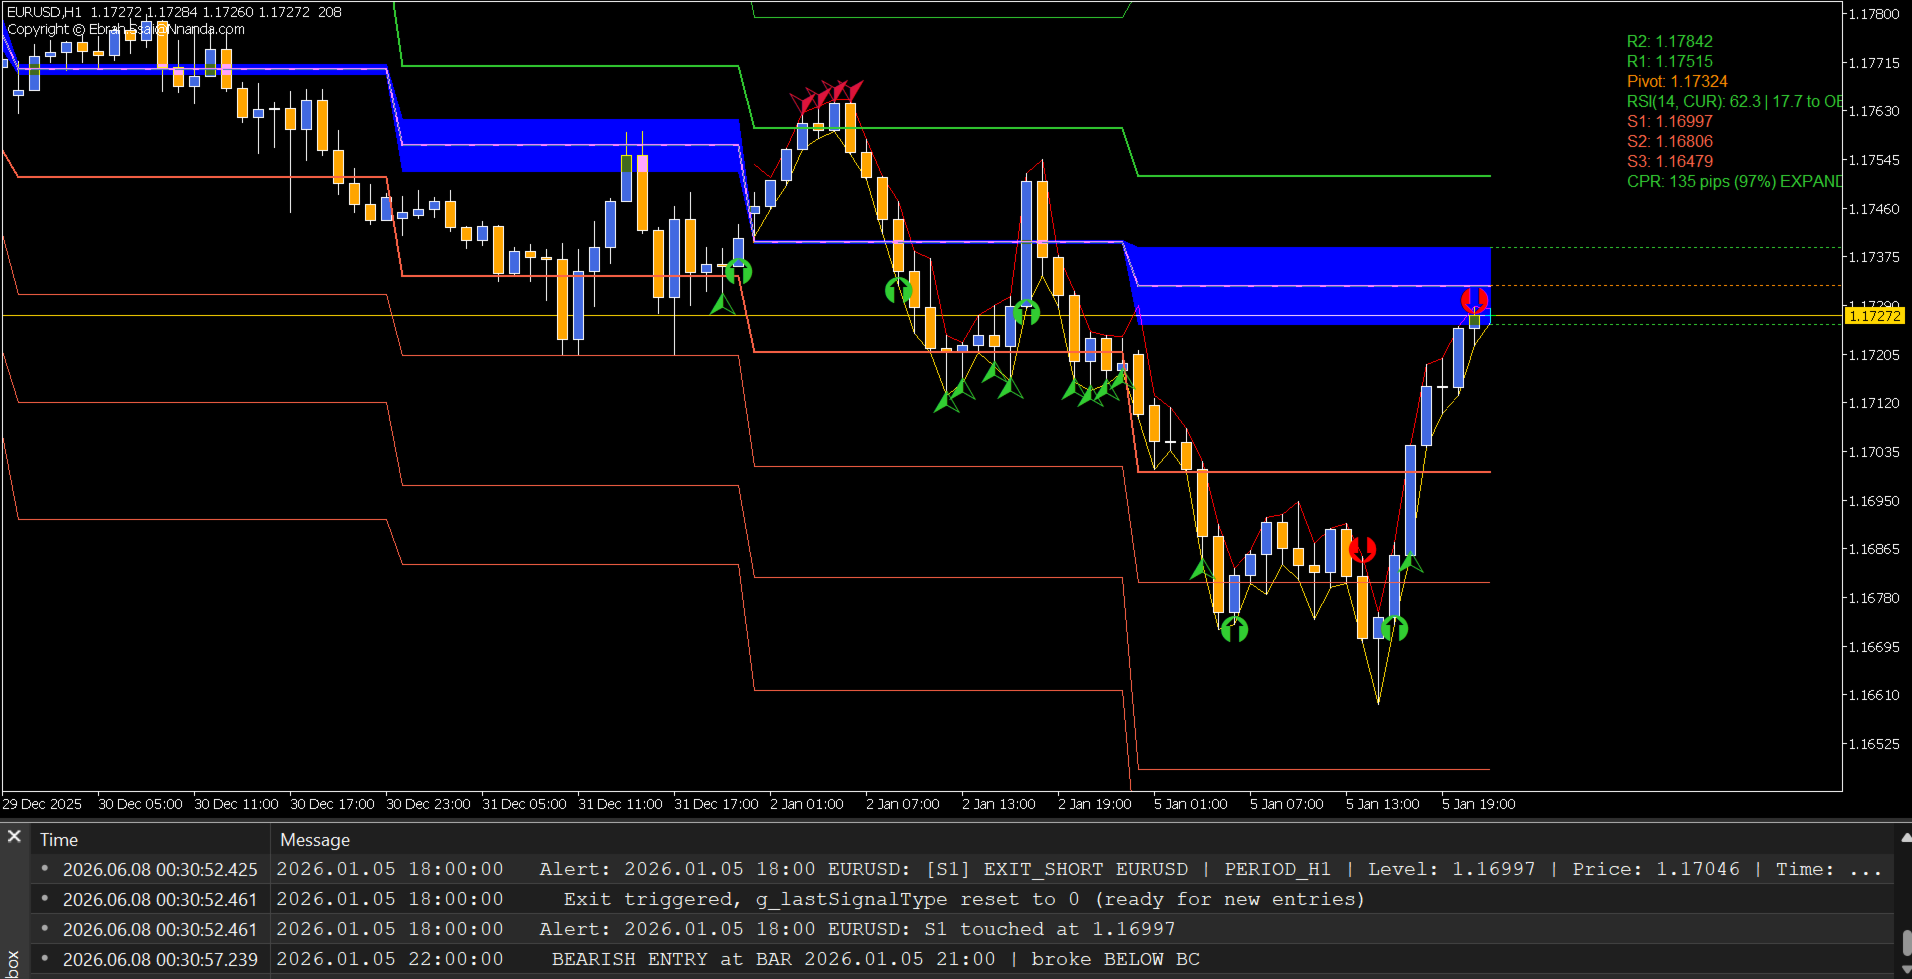
청산 시그널 (EXIT 모드)
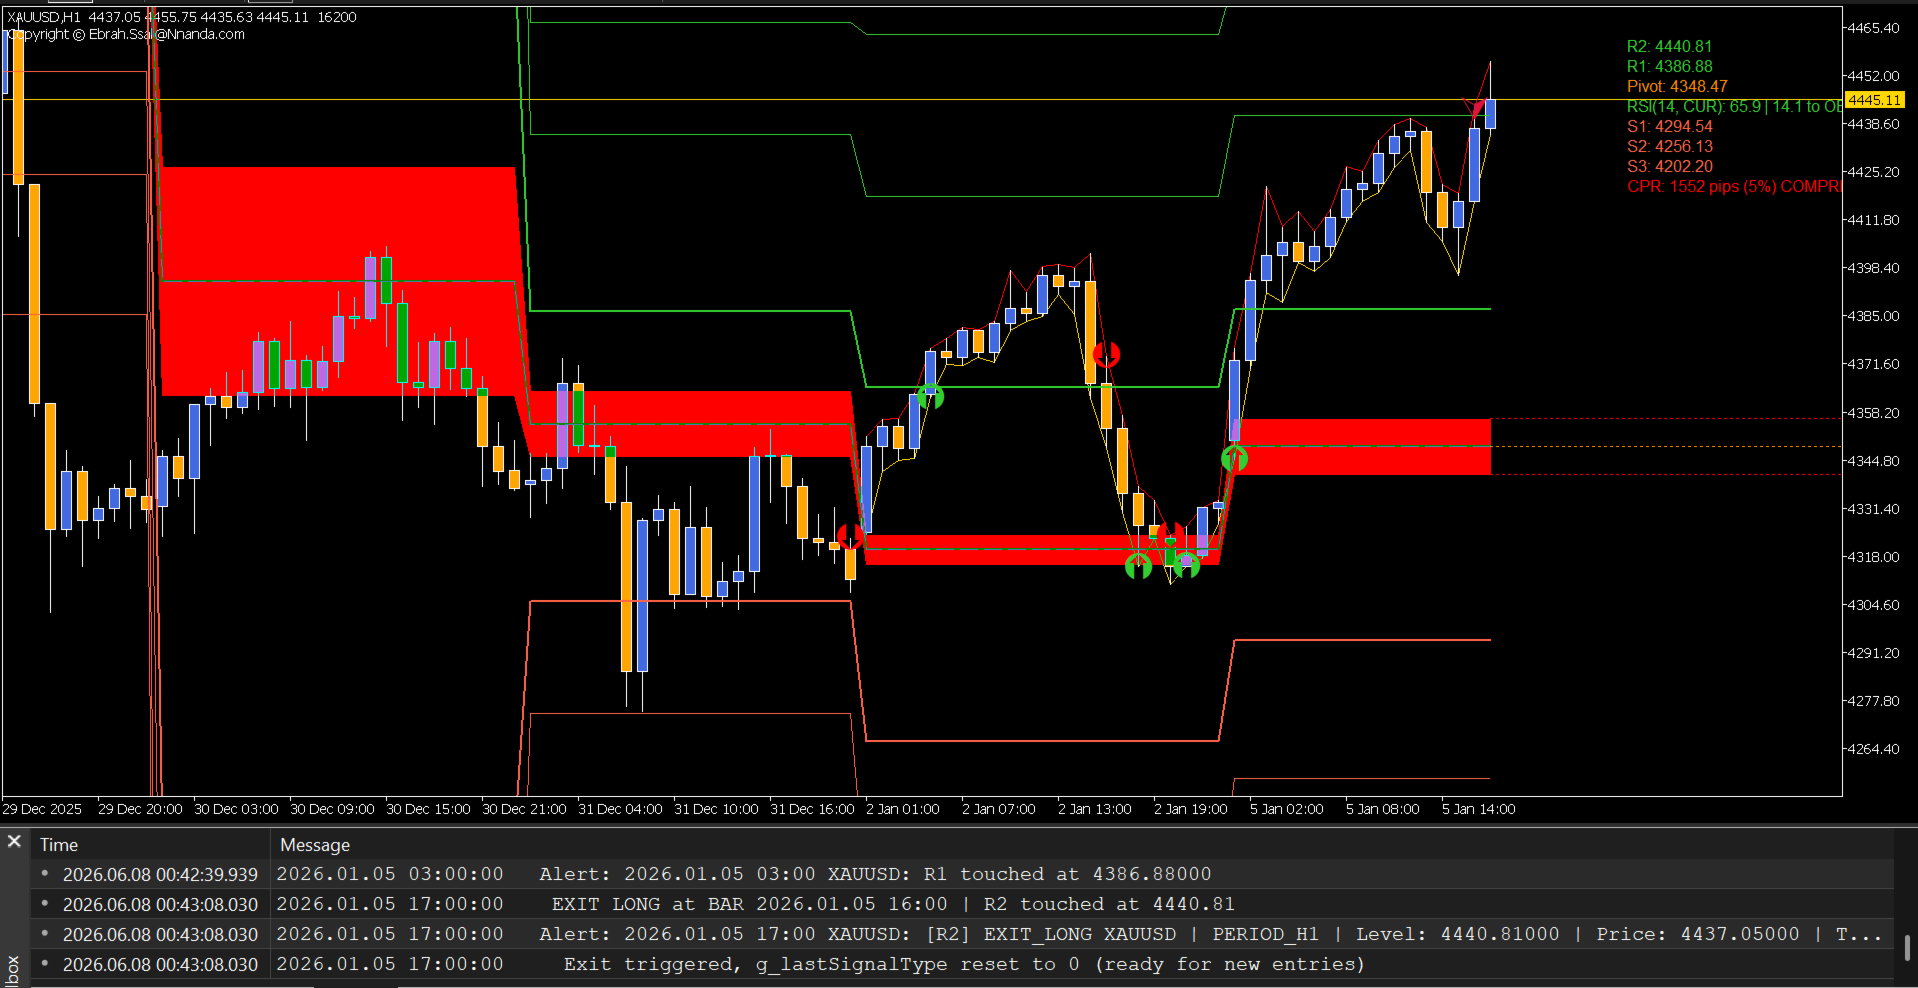
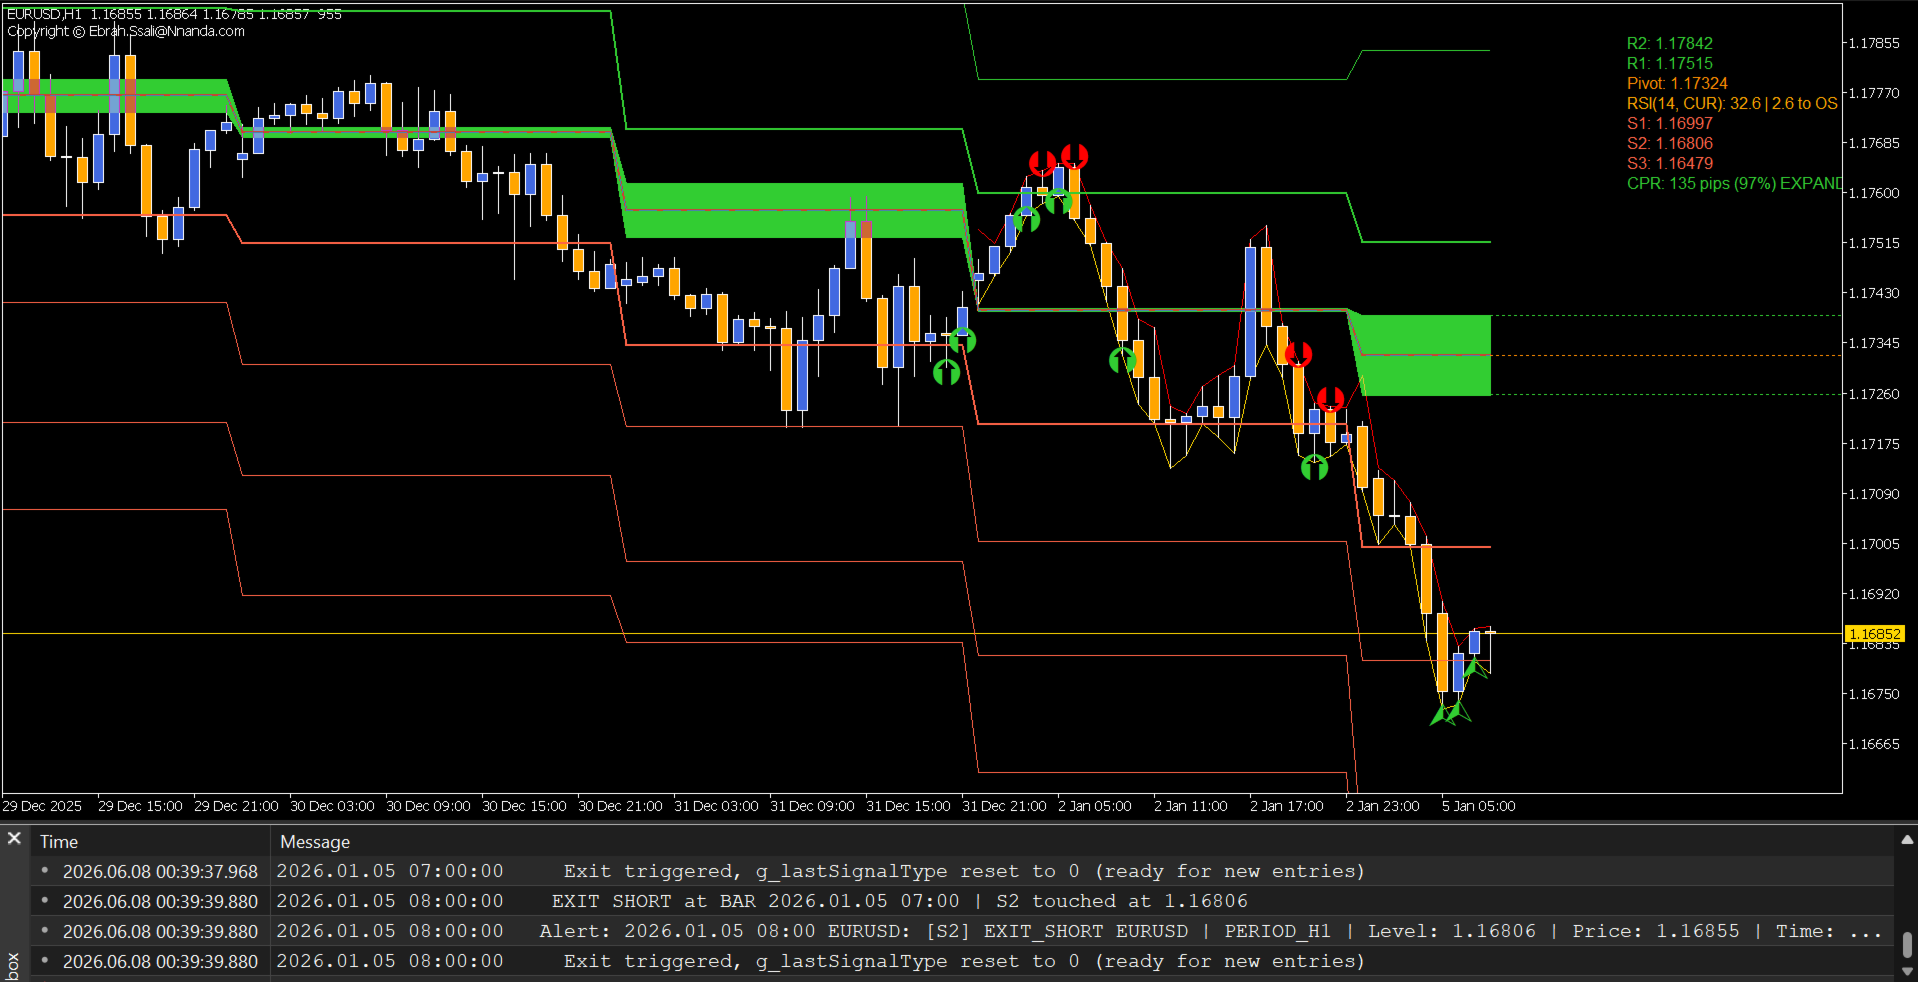
가격이 익절(Take-Profit) 구역에 도달하면, 인지케이터가 적색 EXIT 화살표(롱 포지션 청산용)와 녹색 EXIT 화살표(숏 포지션 청산용)를 차트 위에 표시합니다.
EXIT 모드 작동 원리:
-
가격이 EXIT 모드로 설정된 레벨을 터치하는 순간,
-
즉각적으로 청산 시그널 화살표를 생성함.
-
RSI 필터를 무시함 (익절은 언제나 허용되므로).
-
진입 필터를 리셋하여 새로운 매매가 가능하도록 준비함.
EXIT 모드가 작동하는 위치:
-
모든 저항 레벨 (R1, R2, R3, R4) = 롱 청산 (Exit Long)
-
모든 지지 레벨 (S1, S2, S3, S4, Monthly) = 숏 청산 (Exit Short)
활용 사례 — 다중 목표가 분할 익절 (구매 후 요청 시 이용 가능).
우선순위 시스템 (PIVOT/CPR 가장 높은 우선순위)
본 프레임워크는 명확한 시그널 계층 구조를 사용합니다:
| 우선순위 | 시그널 유형 | 설명 |
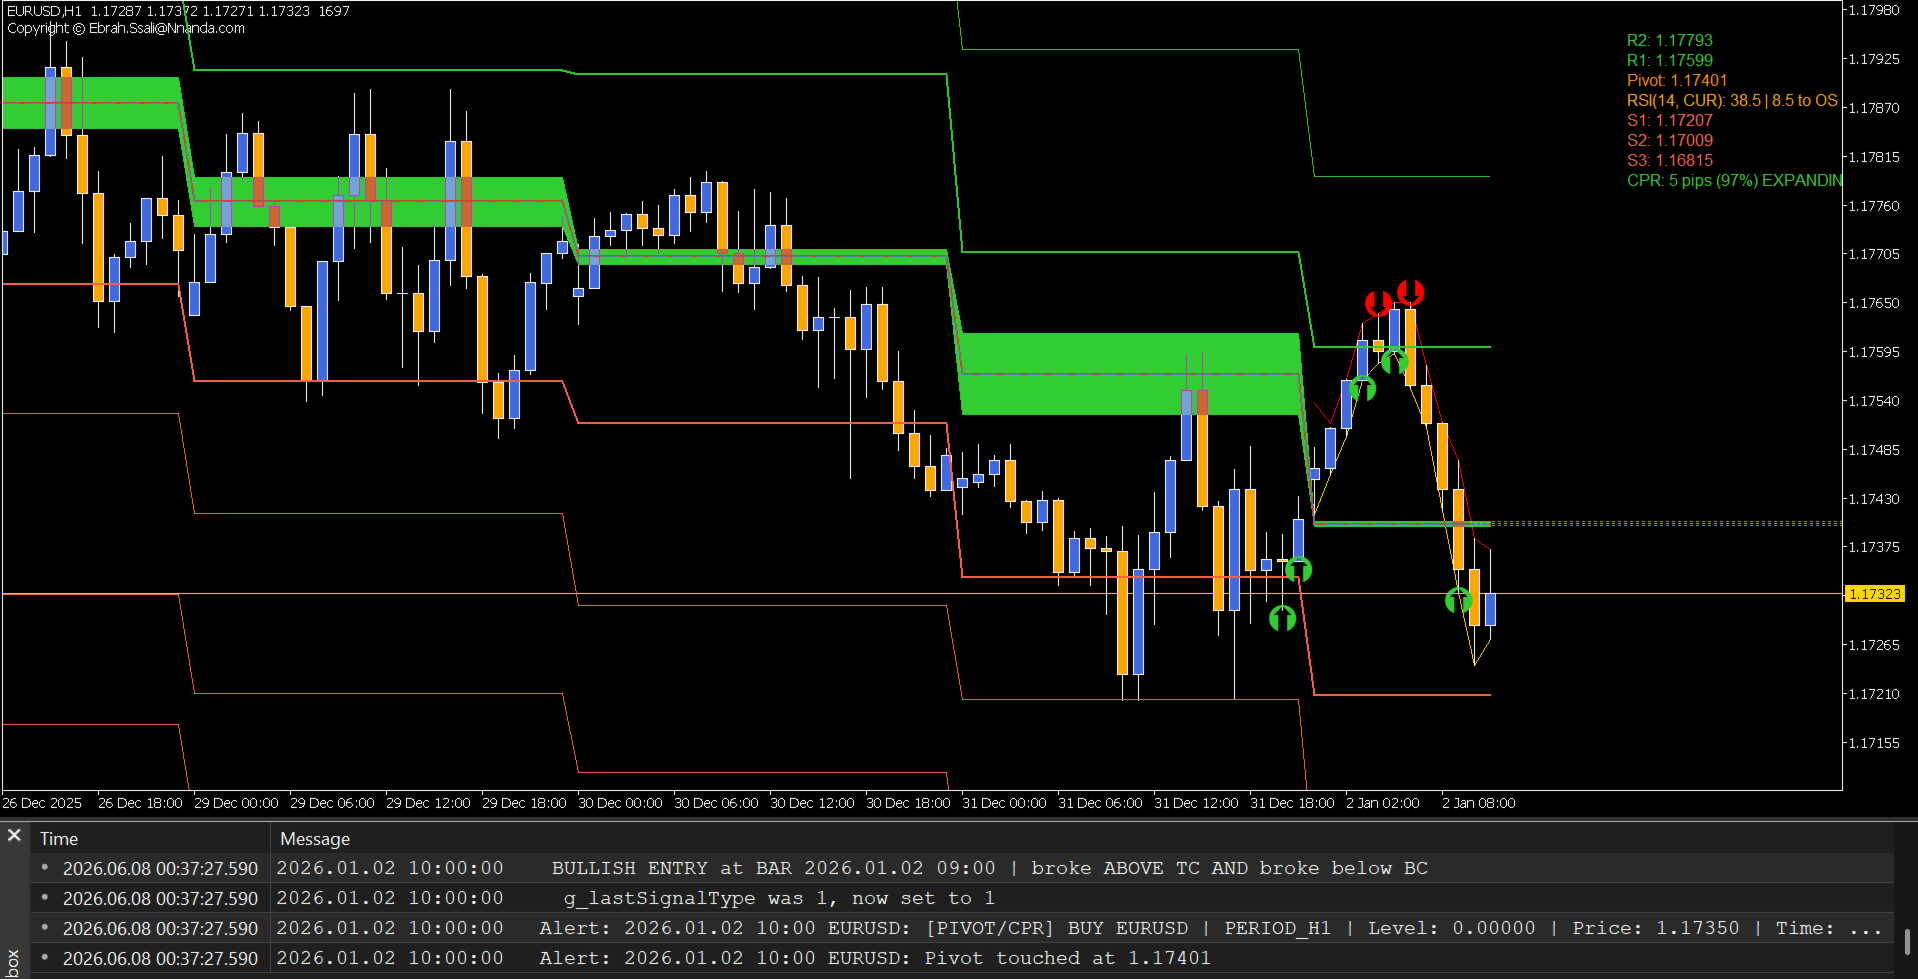
| 최고 (HIGHEST) | PIVOT/CPR | TC/BC(기관 레벨) 터치 기반의 돌파 |
| 보통 (NORMAL) | AUTO 모드 | 설정된 레벨에서 캔들 종가 확정 기반의 진입 |
| 청산 (EXIT) | EXIT 모드 | 설정된 레벨에서 터치 기반의 익절 청산 |
동일한 캔들 안에서는 PIVOT/CPR 시그널이 AUTO 시그널을 덮어쓰기(Overwrite)하므로, 가장 중요한 시장 이벤트가 언제나 전면에 표시됩니다.
중복 시그널 억제 (자동 매매 시 과도한 오버트레이딩 방지)
| 설정 | 효과 | 가장 적합한 매매 스타일 |
| ON (기본값) | 동일한 방향으로 연속해서 나오는 시그널을 차단 | 추세 추종, 스윙 트레이딩 |
| OFF | 생성되는 모든 시그널을 차트에 표시 | 스캘핑, 시장 분석 |
-
억제 기능이 켜진(ON) 경우의 예시:
-
S1에서 BUY → 화살표 생성
-
S1에서 BUY → 차단됨 (중복 시그널)
-
R1에서 SELL → 화살표 생성 (반대 방향 시그널로 필터가 리셋됨)
-
S1에서 BUY → 화살표 생성 (다시 허용됨)
-
RSI 필터 스마트 차단 기능
RSI 필터는 시장이 한쪽으로 과도하게 쏠려 있을 때(심한 추세 확장 시) 무리한 진입을 방지합니다:
| 조건 | 액션 |
| RSI ≥ 80 (과매수) | BUY 화살표 차단 (꼭대기에서 추격 매수 방지) |
| RSI ≤ 30 (과매도) | SELL 화살표 차단 (바닥에서 추격 매도 방지) |
| RSI 30-80 사이 | 모든 화살표 정상 허용 |
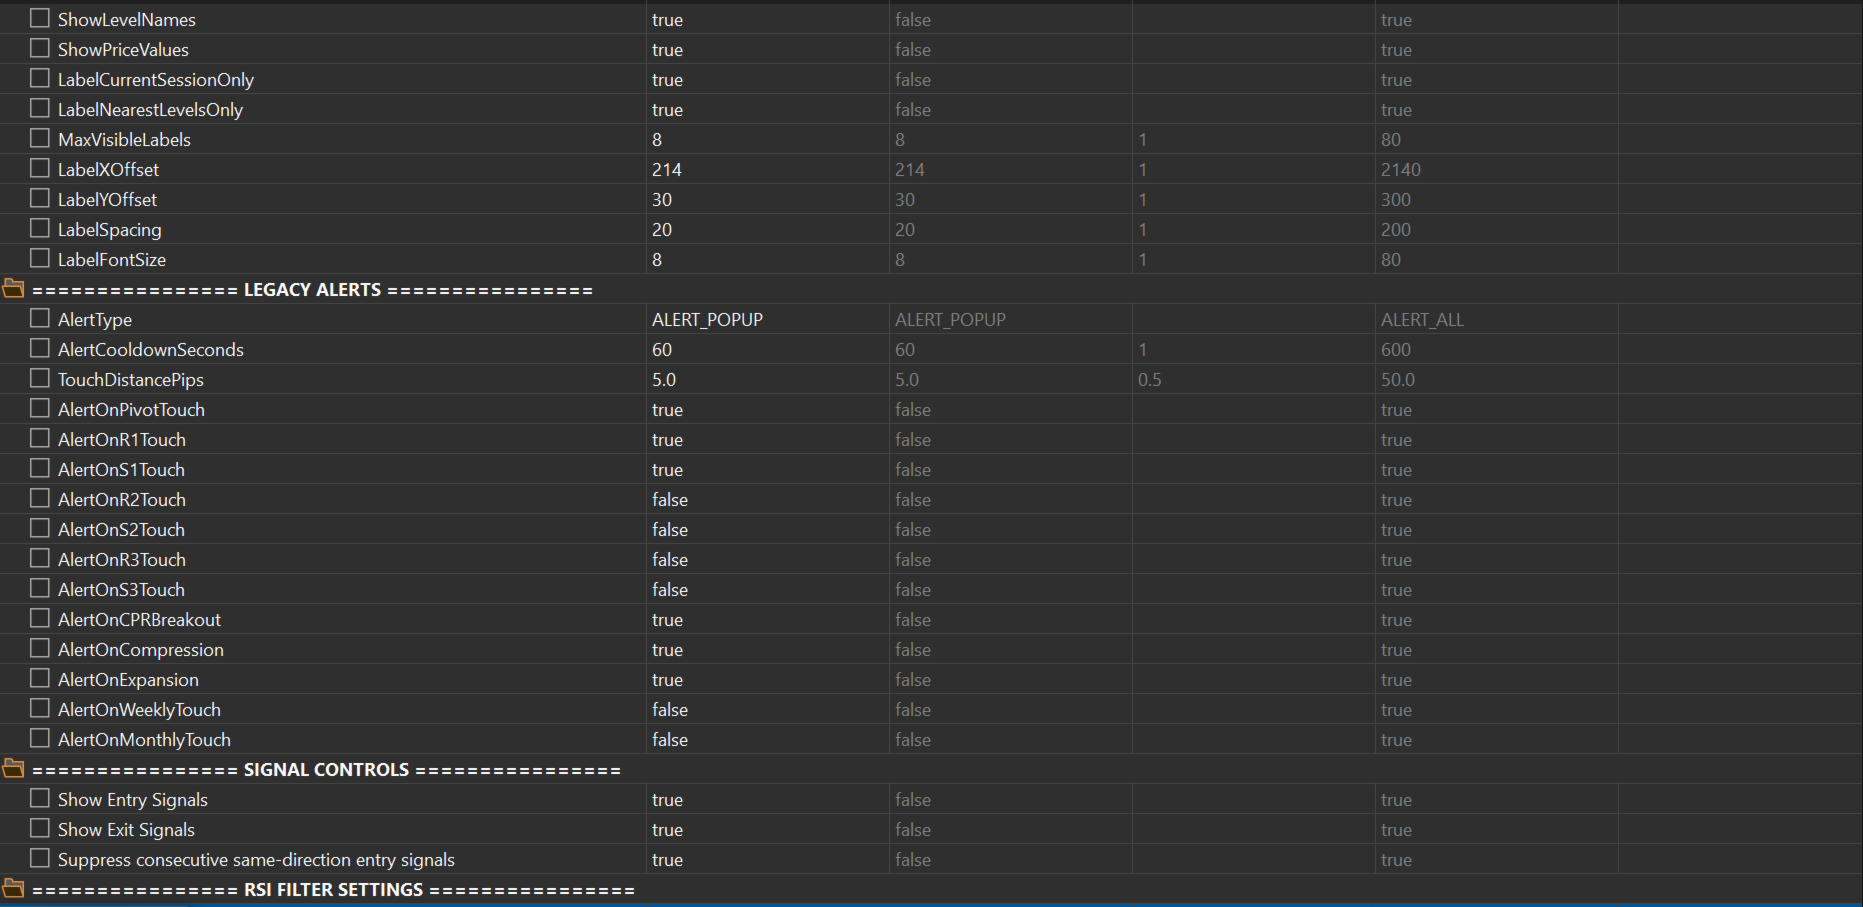
신호등 형태의 RSI 라벨 레이아웃
-
녹색 (GREEN): 안전 구간 (임계값까지 ≤50% 남음)
-
오렌지색 (ORANGE): 주의 구간 (임계값까지 50-90% 남음)
-
적색 (RED): 극단 구간 (임계값까지 ≥90% 남음)
핵심 기능 요약
| 기능 | 설명 |
| BUY 화살표 (버퍼 25) | AUTO 모드가 불리시(상승) 진입을 트리거할 때 녹색 상향 화살표 표시 |
| SELL 화살표 (버퍼 26) | AUTO 모드가 베어리시(하락) 진입을 트리거할 때 적색 하향 화살표 표시 |
| Exit Long (버퍼 27) | EXIT 모드로 설정된 저항 레벨 터치 시 적색 도트(점) 표시 |
| Exit Short (버퍼 28) | EXIT 모드로 설정된 지지 레벨 터치 시 녹색 도트(점) 표시 |
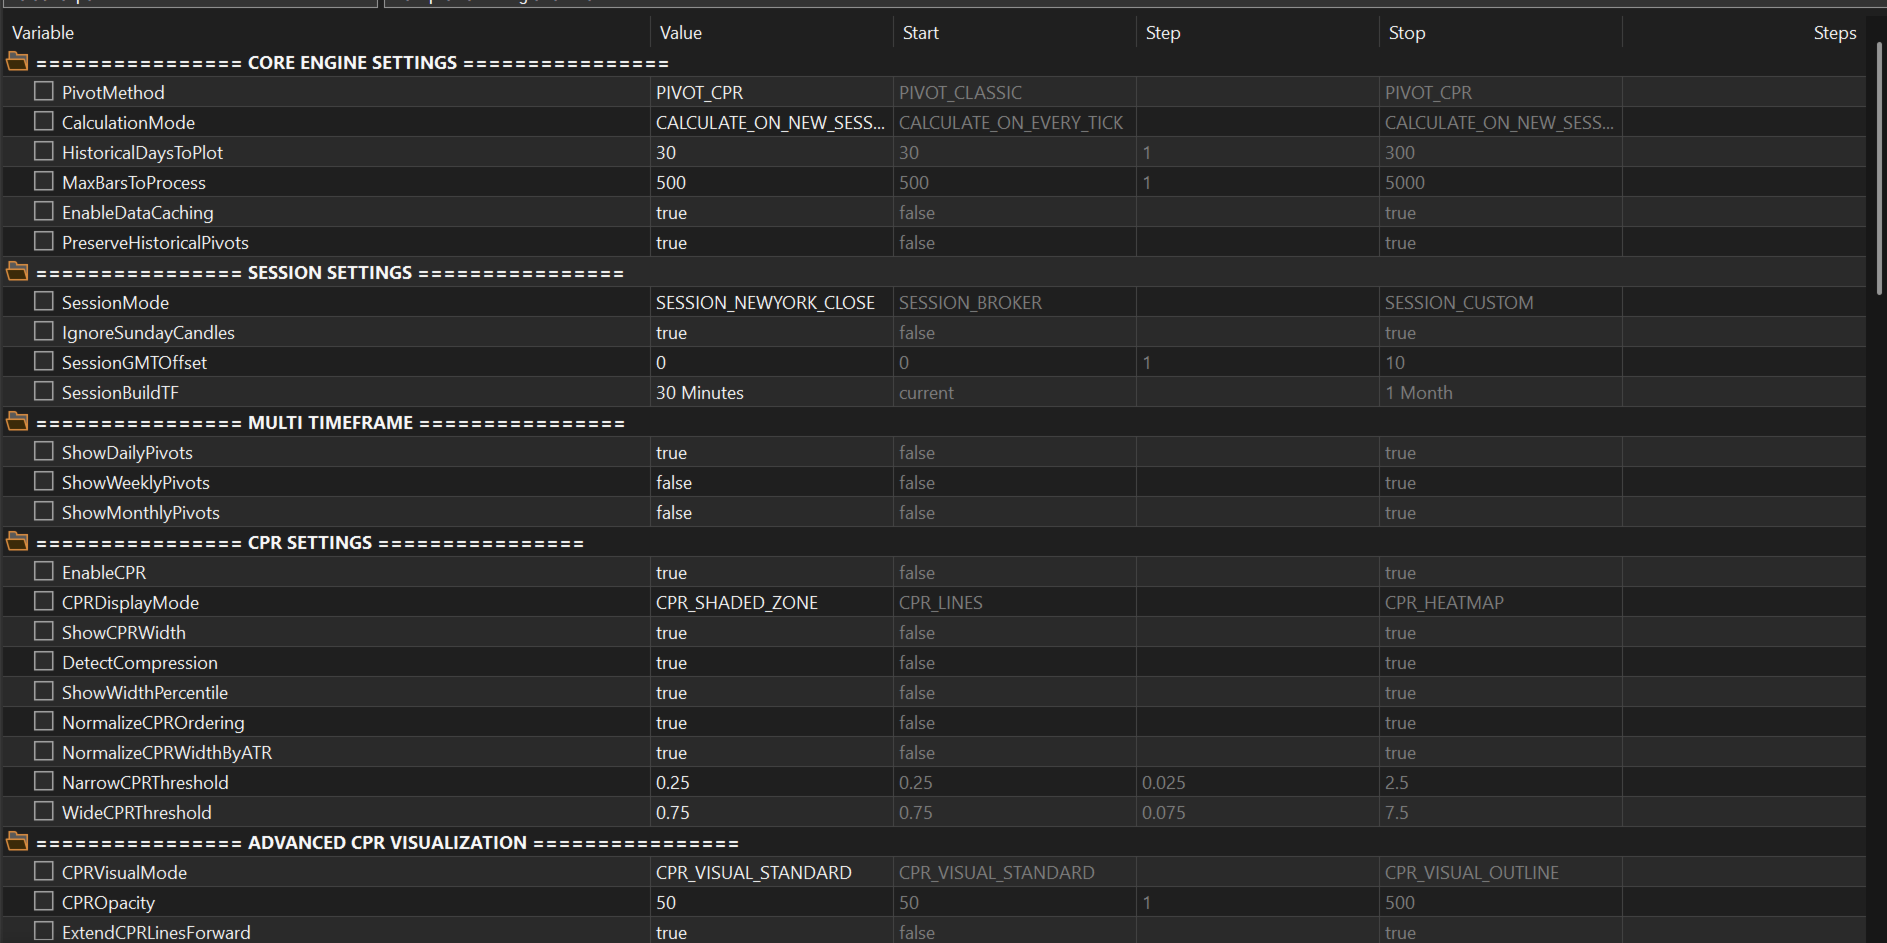
| 6가지 피봇 메서드 | Classic, Woodie, Fibonacci, Camarilla, DeMark, 및 CPR |
| 세션 인식 계산 | NY Close(뉴욕 종가), 런던, 도쿄, 브로커 시간 또는 사용자 정의 세션 기준 |
| 과거 피봇 캐시 | 과거의 모든 캔들이 각각의 고유 피봇 값을 그대로 유지 |
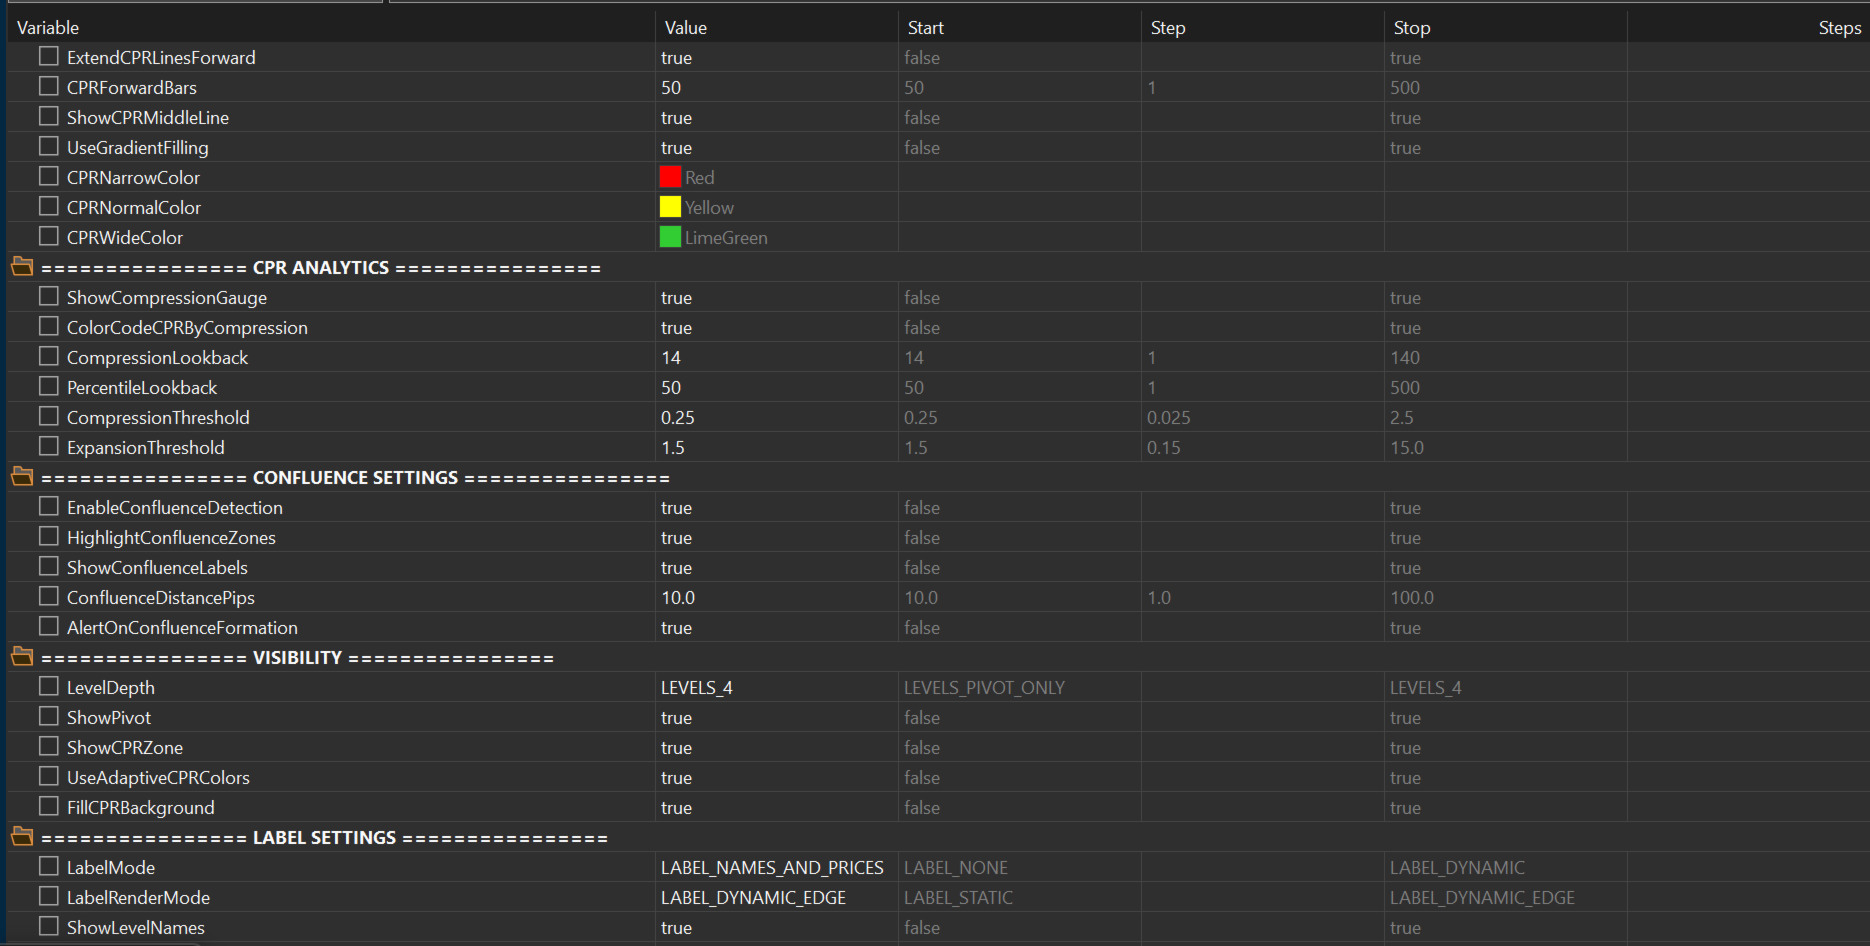
| CPR 압축 분석 | 폭 비율, 백분위수 순위, 배열에 따른 자전적 컬러 변경 |
| 멀티 타임프레임 중첩 | 일봉 + 주봉 + 월봉 레벨이 일치하는 구간을 자동 감지 |
| 실시간 알림 | 터치, 돌파, 압축(스크이즈) 및 확장(에스팬션) 실시간 얼럿 제공 |
| 다이나믹 라벨 | 차트 우측 가장자리에 겹치지 않고 자동 정렬되는 위치 설정 가능 라벨 |
| CPR 시각화 모드 | 스탠다드, 히트맵, 그라데이션, 아웃라인(외곽선) 방식 지원 |
| 전방 투영 기능 | 미래의 캔들 영역으로 CPR 존을 미리 투영하여 표시 |
| EA 지원 아키텍처 | 자동 매매 및 Expert Advisors를 위한 전용 데이터 버퍼 제공 |
| RSI 필터 | 과매수권 BUY 시그널 및 과매도권 SELL 시그널 자동 차단 |
| 중복 억제 기능 | 동일 방향의 연속적인 시그널 스팸으로 인한 오버트레이딩 방지 |
본 인지케이터가 해결해 주는 트레이딩의 의문들
| 트레이딩 의문점 | 인지케이터가 답변하는 방식 |
| 시장 구조 | 일간, 주간, 월간 피봇이 현재 트렌드의 전체적인 맥락을 정의함 |
| 어디서 진입할 것인가? | 설정된 AUTO 레벨에 BUY/SELL 화살표를 표시함 ← 신기능 |
| 어디서 청산할 것인가? | 설정된 EXIT 레벨에 청산용 도트를 표시함 ← 신기능 |
| 시그널의 강도 | 중첩 스코어(Confluence scoring)를 통해 셋업의 퀄리티를 판단함 |
| 리스크 매개변수 | CPR의 압축(폭의 축소) 상태가 다가올 변동성 확대를 경고함 |
| 즉각적인 실행 | 실시간 화살표가 지체 없는 주문 실행의 트리거 가이드를 제공함 |
| 손절가(Stop Loss) 설정 | 다음 지지/저항 레벨이 자연스러운 보호벽 역할을 해줌 |
| 목표가(Take Profit) | 반대편 피봇 레벨이나 EXIT 모드 레벨이 정확한 목표가를 정의함 |
-
EA 자동 매매용 시그널 데이터 버퍼 사양 (구매 후 요청 시 이용 가능)
-
AUTO/EXIT 화살표를 활용한 3가지 트레이딩 전략 (구매 후 요청 시 이용 가능)
-
상세 기술 스펙 (구매 후 요청 시 이용 가능)
프로페셔널 트레이딩 적용
본 프레임워크는 다음과 같은 기능을 필수적으로 요구하는 트레이더를 위해 설계되었습니다:
-
주요 지지/저항 레벨에서의 시각적인 진입 시그널
-
목표가 구역에서의 시각적인 청산 시그널
-
기관 투자자 스타일의 시장 구조 분석
-
멀티 타임프레임 피봇 중첩(Confluence) 감지
-
변동성 압축(스크이즈) 감지
-
정밀한 지지/저항 매핑
-
EA 자동 매매에 즉시 적용 가능한 시그널 자동화
-
신뢰할 수 있는 과거 데이터 백테스팅
화살표는 당신이 무엇을 해야 할지 정확하게 알려줍니다:
-
▲ 녹색 상향 화살표 = 이 레벨에서 매수 (BUY)
-
▼ 적색 하향 화살표 = 이 레벨에서 매도 (SELL)
-
● 적색 도트 = 롱 (LONG) 포지션 청산
-
● 녹색 도트 = 숏 (SHORT) 포지션 청산
간편한 사용법 및 설정
5분 퀵 스타트
-
인지케이터를 H1(1시간봉) 차트에 추가합니다.
-
PivotMethod = PIVOT_CPR 로 선택합니다.
-
LevelDepth = LEVELS_2 로 설정합니다.
-
매매 전략을 선택합니다:
-
공격형: R1/R2/S1/S2 = AUTO 로 설정
-
보수형: R1/S1 = EXIT 로 설정
-
-
원할 경우 RSI 필터를 활성화(Enable)합니다.
-
녹색/적색 화살표가 나타나는지 주시합니다 (색상은 원하는 대로 변경 가능).
대부분의 트레이더는 아래 파라미터만 조정하면 바로 사용할 수 있습니다:
| 입력 파라미터 (Input) | 추천 설정값 |
| PivotMethod | PIVOT_CPR |
| SessionMode | SESSION_NEWYORK_CLOSE |
| LevelDepth | LEVELS_2 |
| SigModeR1 | AUTO 또는 EXIT (사용자 선택) |
| SigModeS1 | AUTO 또는 EXIT (사용자 선택) |
| AlertType | ALERT_POPUP 또는 ALERT_ALL |
키워드 (KEYWORDS)
pivot points, CPR, central pivot range, support resistance, market structure, multi-timeframe, confluence detection, compression analysis, volatility indicator, entry signals, exit signals, buy arrows, sell arrows, profit taking, MT5 indicator, trading system, trade entries, trade exits, stop loss placement, take profit levels, automated trading, EA friendly, forex indicator, institutional trading, professional trader tool, daily pivots, weekly pivots, monthly pivots, classical pivots, woodie pivots, fibonacci pivots, camarilla pivots, demark pivots, visual trading signals, arrow signals, entry confirmation, exit confirmation, 피봇 포인트, 지지 저항, 시장 구조, 진입 시그널, 청산 시그널, 자동 매매.
고객 지원 (SUPPORT)
이메일 문의: ebrah.ssali@Nnanda.com
Central Pivot Range Plus는 단순히 훌륭한 분석 도구였던 CPR Pivot Framework를, 언제 진입하고 언제 청산해야 하는지 정확하게 짚어주는 액티브한 트레이딩 시스템으로 진화시킵니다.