MACD intel MTF

MACD Multi-Dimensional  (MACD intel MTF)

Professional MACD Oscillator with Adaptive Noise Filtering, Divergence Detection & Multi-Timeframe Confirmation

The Problem MACD intel MTF Solves

Trader Question How MACD intel MTF Answers
"Is this crossover real or just market noise?" Adaptive Dead Zone filters out false signals. Grey histogram = noise zone. Only decisive moves generate arrows.
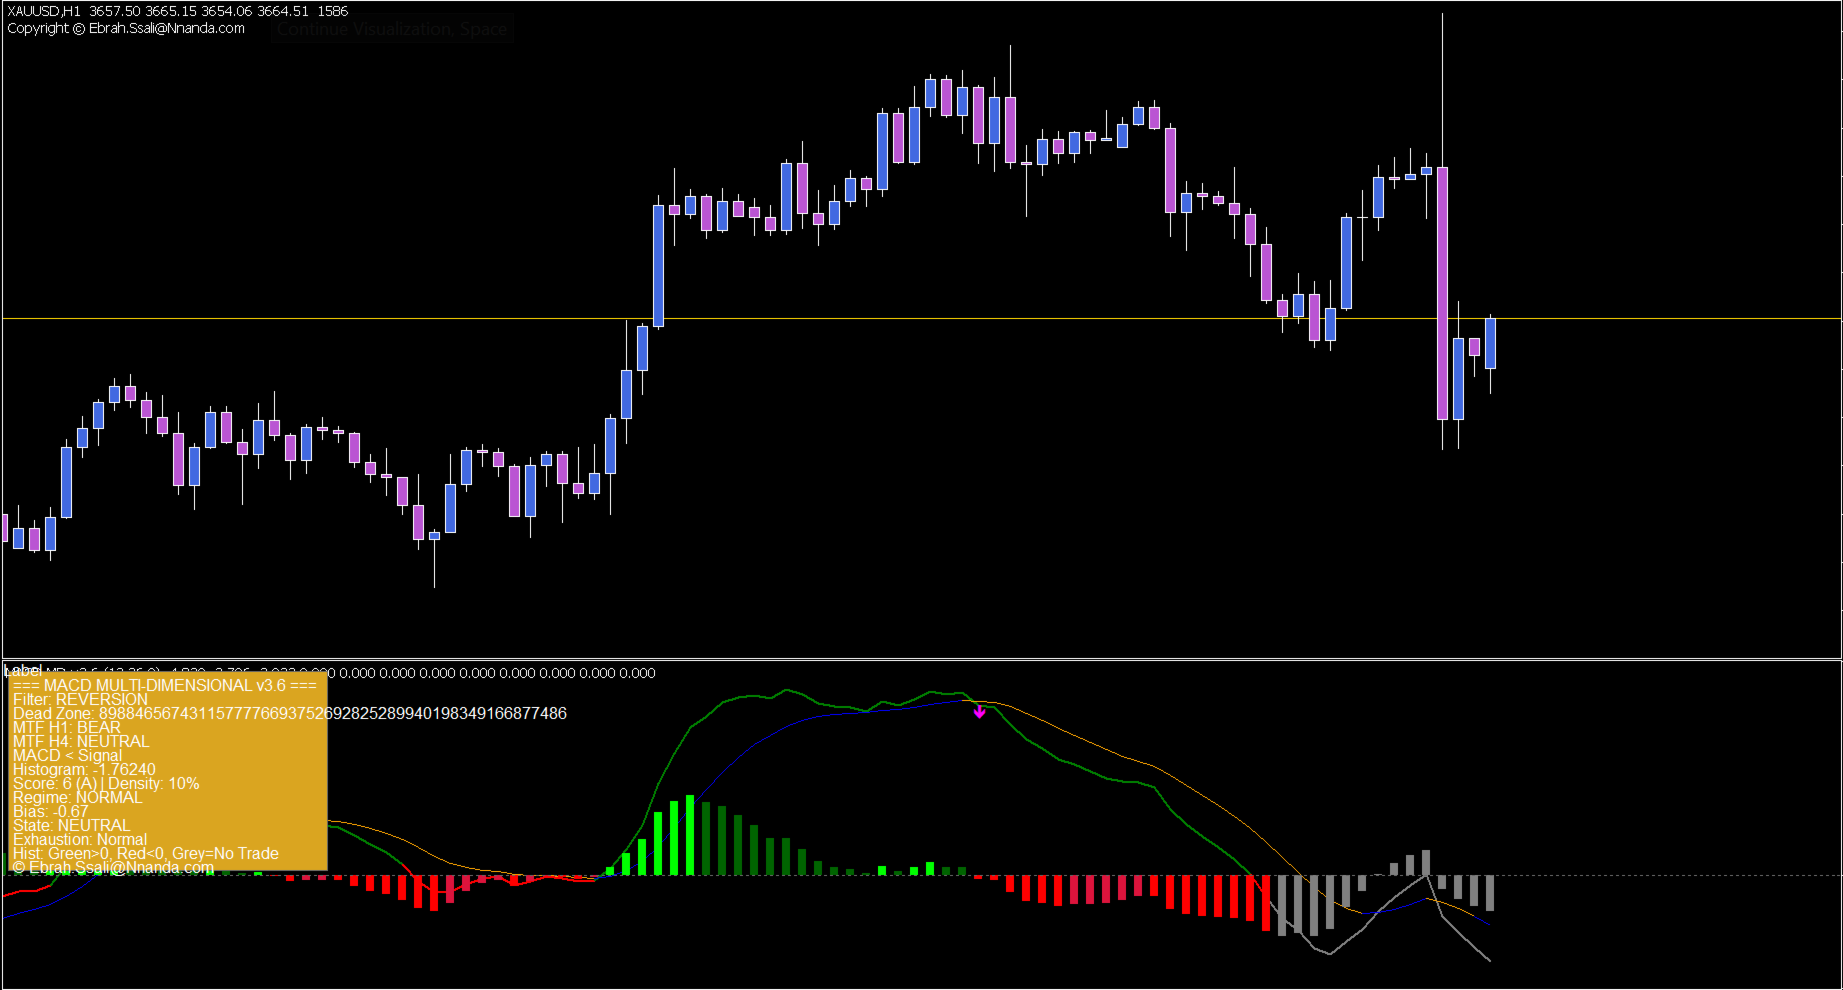
"Should I follow the trend or fade the move?" 3-Mode Zero-Line Filter lets you switch between TREND (follow momentum) and REVERSION (fade extremes).
"Does my higher timeframe agree with this trade?" Multi-Timeframe Confirmation shows H1/H4 direction on dashboard. Penalises misalignment or blocks entirely.
"Why did MACD give a signal but price reversed?" Divergence Detection catches reversals early. Solid lines = classical reversal, dotted = trend continuation.
"How reliable is this signal?" Signal Scoring (A+ to C) grades every setup mathematically. Trade only when dashboard turns GOLDENROD.
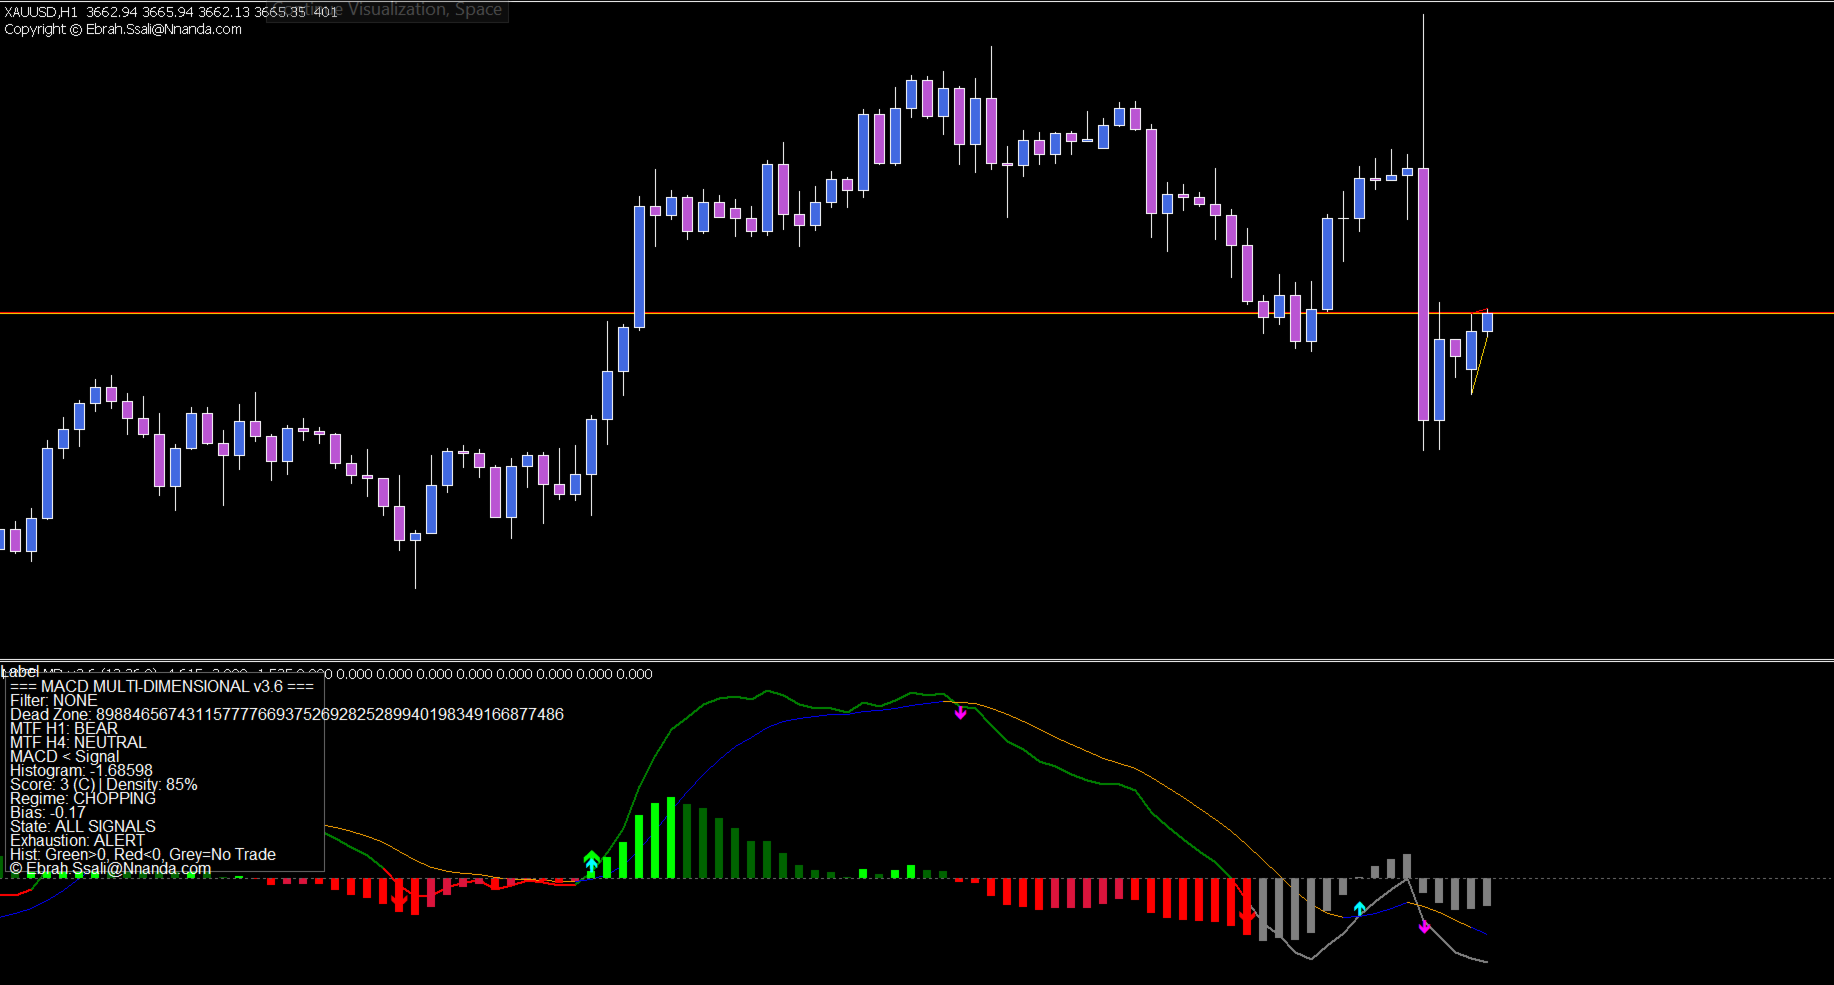
"Is the market trending or chopping?" Exhaustion Alert shows signal density. >20% = choppy market. Reduce size or switch to REVERSION mode.
"Where is momentum accelerating vs dying?" 5-State Histogram shows acceleration (bright colours) vs deceleration (dark colours).
"When does momentum actually confirm?" Acceleration Arrows fire when MACD breaks decisively out of the dead zone, validating the move.
"Can my EA trade these signals?" 8 EA-Ready Buffers expose every arrow type for automated trading.
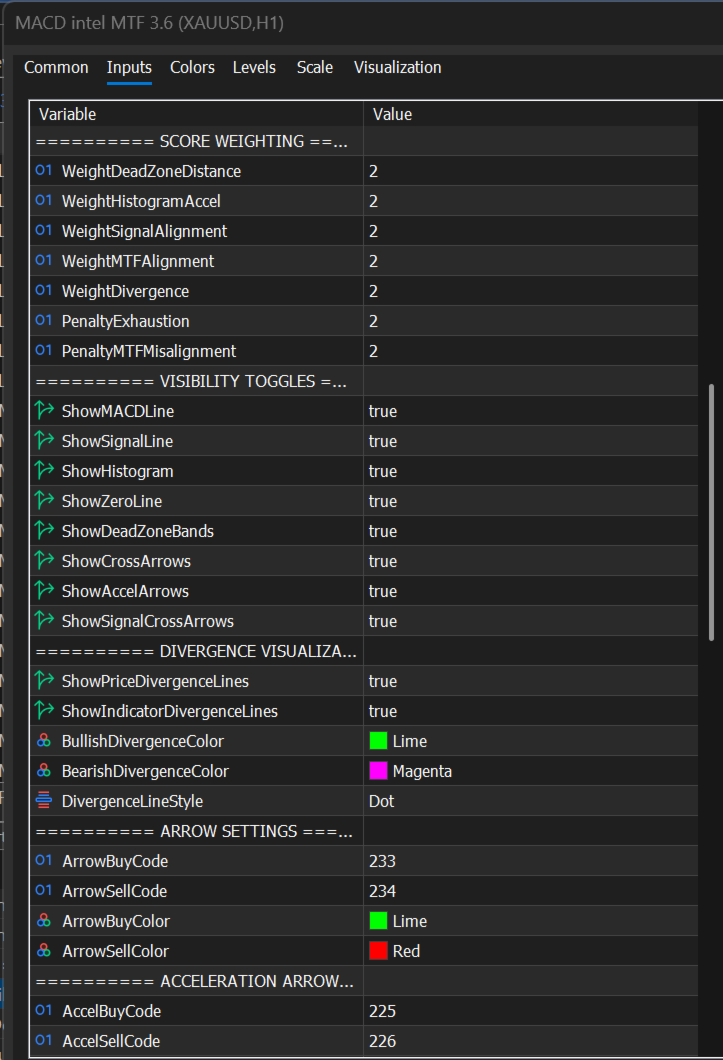
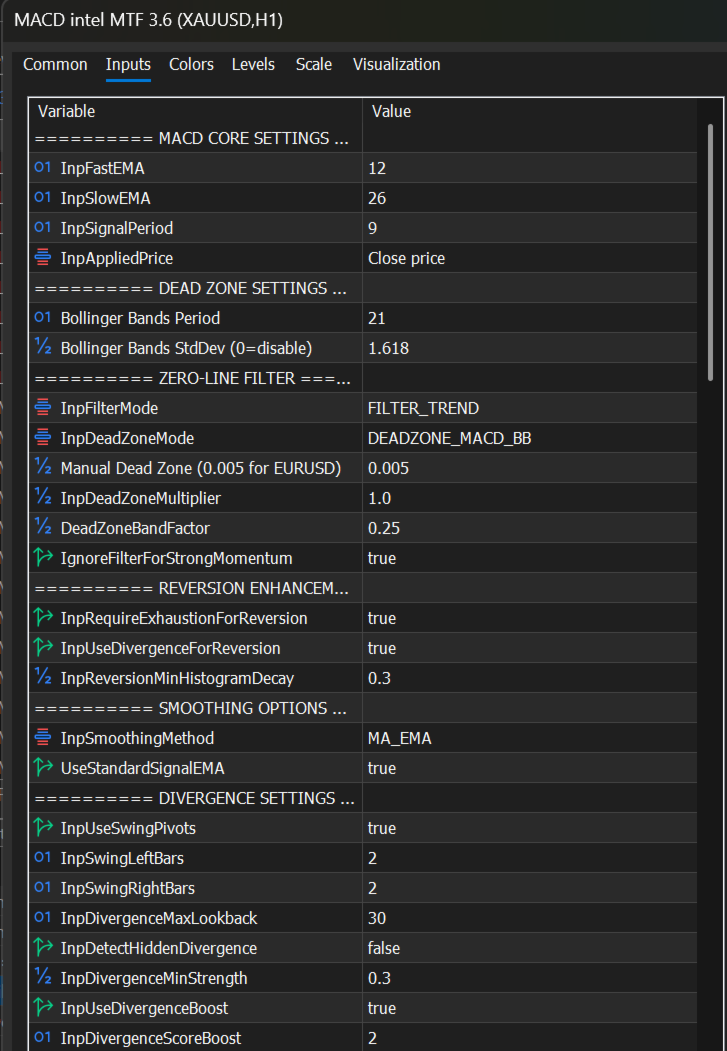

Key Features

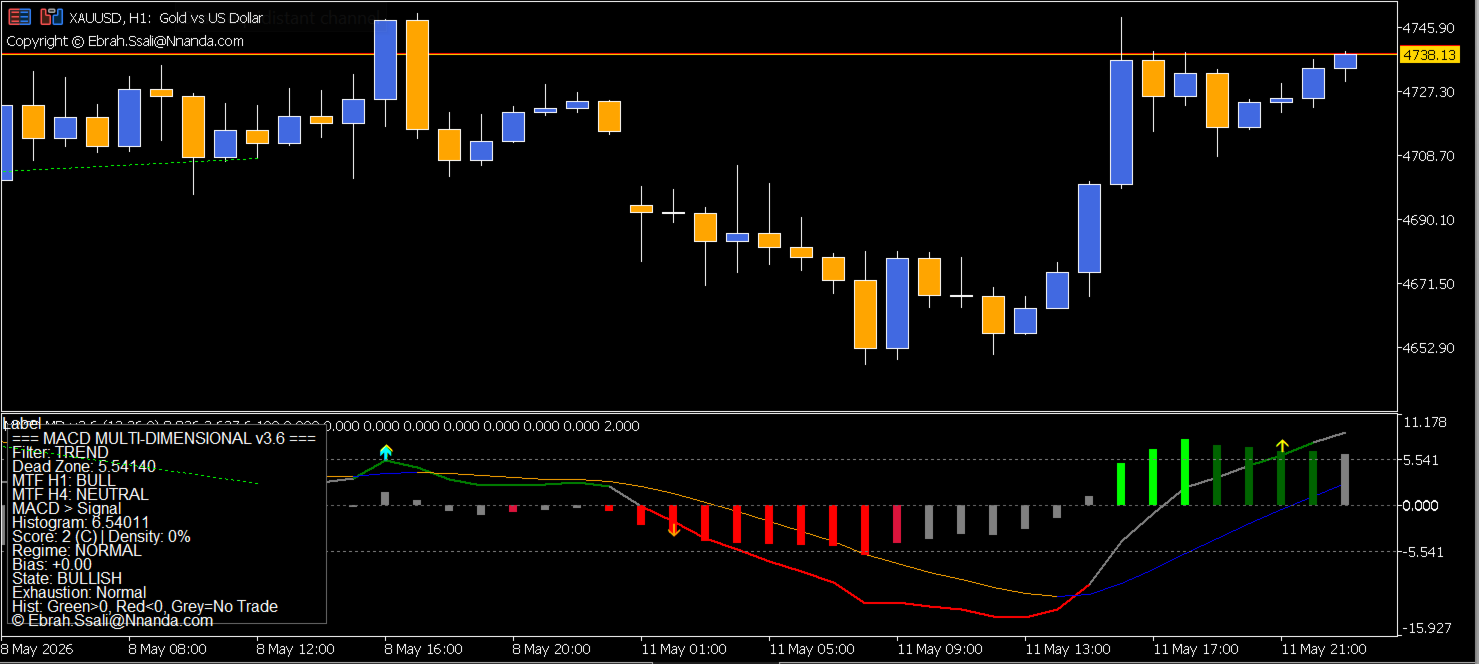
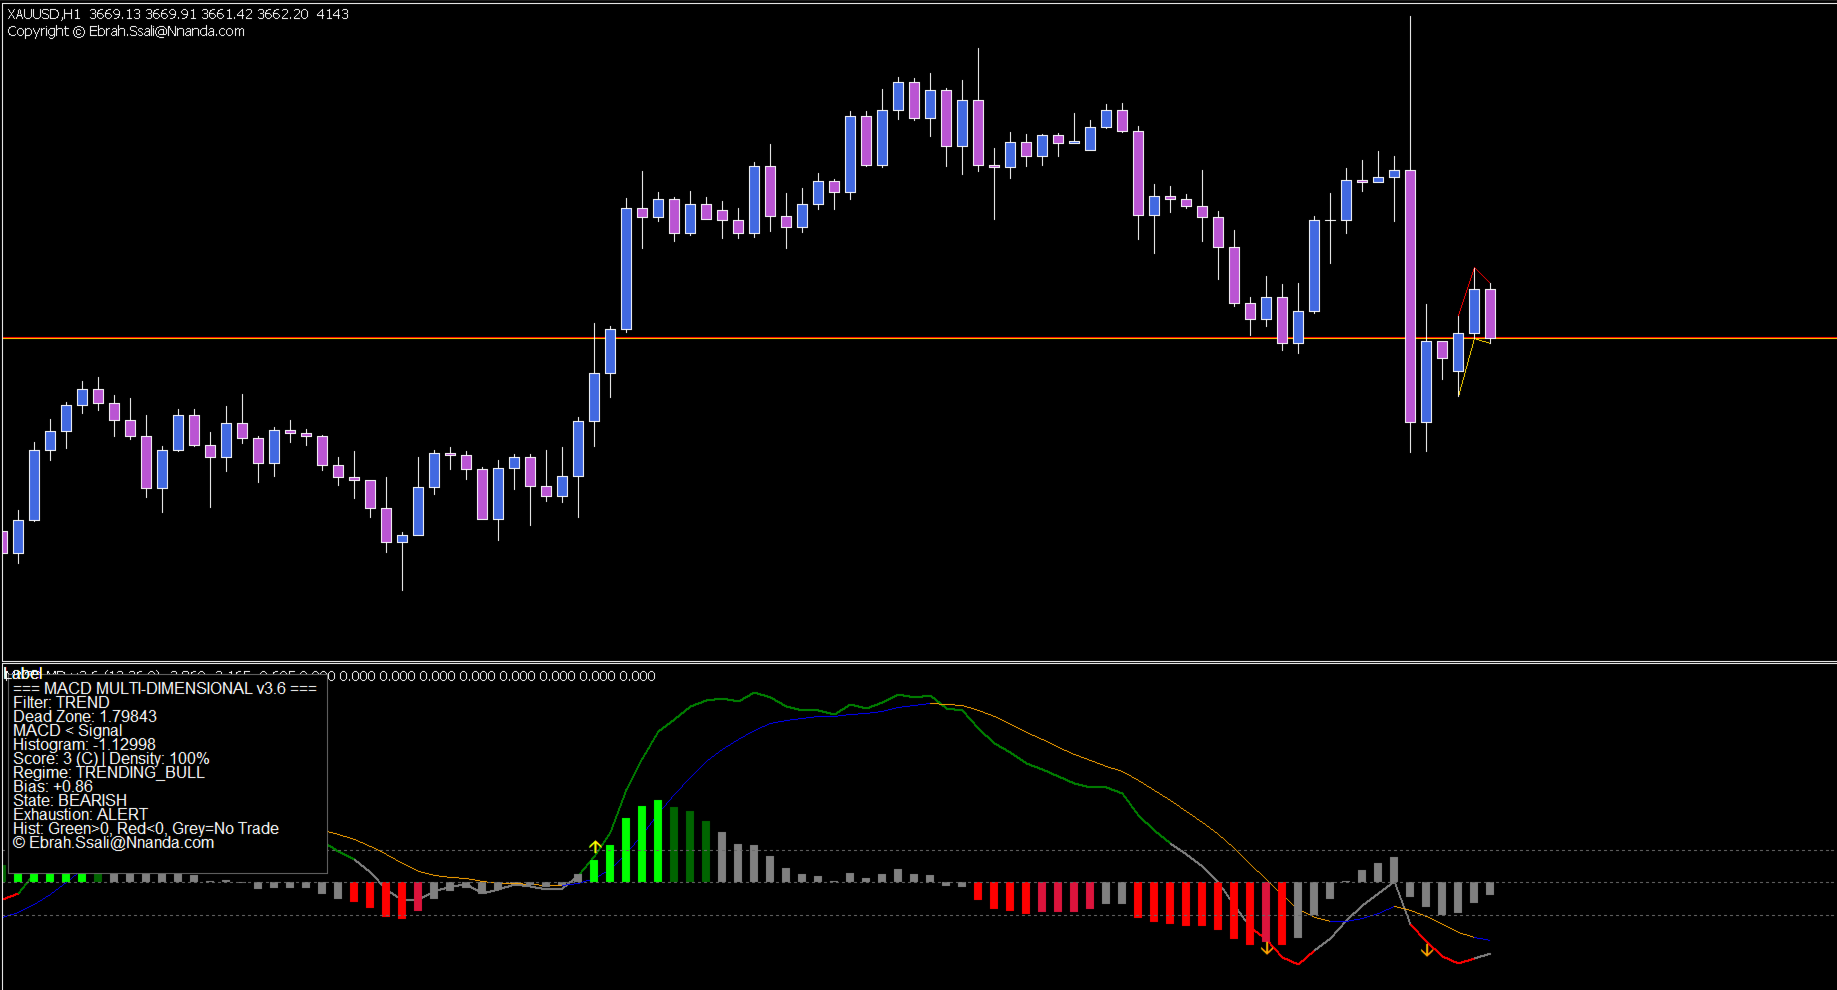
1. Zero-Line Filter (3 Modes)

Mode Logic Best For
NONE Classic mode; all crossovers generate signals Scalping
TREND Buy only above zero, sell only below zero Trending markets
REVERSION Buy below zero, sell above zero (fade extremes) Ranging markets


2. Adaptive Dead Zone

Filters market noise around the zero line. Grey histogram = "No Trade Zone."

  • MACD_BB Mode (Recommended): Uses Bollinger Bands on MACD itself to auto-adjust to volatility

  • MANUAL Mode: Fixed value (e.g., 0.005 for EURUSD, 0.05 for Gold)

  • Set StdDev = 0 to disable dead zone


3. 5-State Histogram Colouring

Colour Meaning
Bright Green Above zero + accelerating (strong bullish)
Dark Green Above zero + decelerating (weak bullish)
Bright Red Below zero + accelerating (strong bearish)
Dark Red Below zero + decelerating (weak bearish)
Grey Inside dead zone or current forming candle (wait)


4. Signal Line Colour (Continuous)

  • Blue = Signal below MACD (bullish bias)

  • Orange = Signal above MACD (bearish bias)


5. Divergence Detection

Finds Classical and Reverse divergences between price and MACD.

Type Line Style Meaning
Classical Solid Potential reversal
Reverse Dotted Trend continuation

Visual Feedback: Lime arrows + green lines = bullish divergence. Magenta arrows + magenta lines = bearish divergence. Lines on BOTH price chart and indicator window.


6. Signal Scoring (A+ to C)

Graded on dead zone distance, histogram acceleration, signal alignment, and MTF confirmation.

Grade Score Interpretation
A+ 8-10 High-conviction setup
A 6-7 Actionable trade
B 4-5 Weak signal - consider context
C 0-3 Avoid


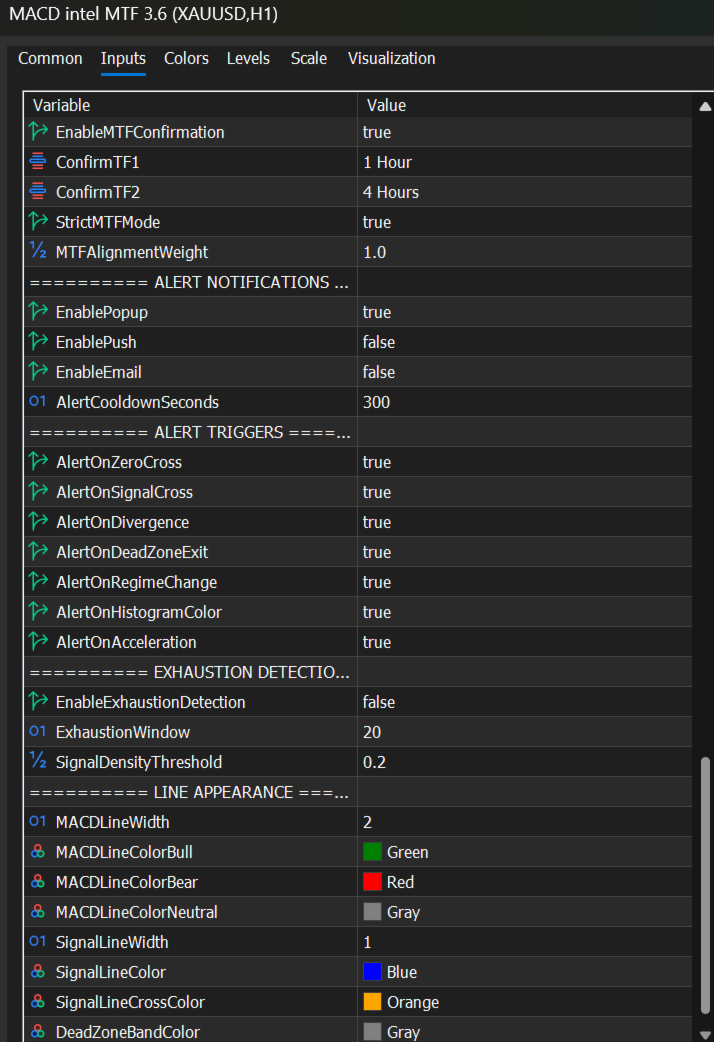
7. Multi-Timeframe Confirmation

Feature Description
Dual Timeframes User-selectable (e.g., H1/H4 or M15/H1)
Hybrid Architecture Manual MACD for primary (reliable) + iMACD for MTF (fast)
Scoring Non-strict: misalignment penalised (-2 points)
Strict Mode Blocks misaligned signals completely
Display Shows "MTF H1: BULL" and "MTF H4: BEAR"


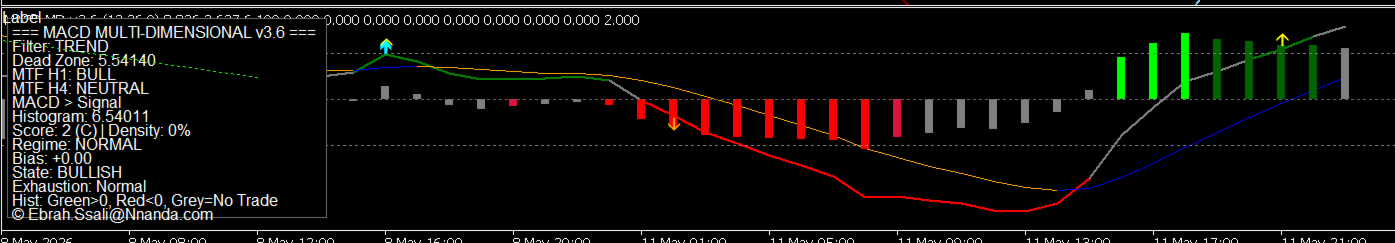
8. Dashboard (Left Corner)

Shows: Filter mode, Dead zone, MTF directions, MACD vs Signal, Histogram, Score & Grade (Goldenrod for A/A+), State, Exhaustion Alert, Regime, Directional Bias.

9. Signal Arrows (EA Ready)

Arrow Buffer Signal Type
Lime 6 Zero Cross BUY
Red 7 Zero Cross SELL
Cyan 8 Signal Cross BUY
Magenta 9 Signal Cross SELL
Yellow 10 Bullish Acceleration
Orange 11 Bearish Acceleration
Lime 12 Bullish Divergence
Magenta 13 Bearish Divergence


How to Trade

Step 1: Match Market Regime

Condition Filter Mode
Trending TREND - follow momentum
Ranging REVERSION - fade extremes
Scalping NONE - all crossovers


Step 2: Set Dead Zone

Recommended: MACD_BB (auto-adapts). Alternative: MANUAL (0.005 for EURUSD). Set StdDev = 0 to disable.

Step 3: Enable MTF Confirmation (Optional)

Choose timeframes (e.g., H1 and H4). Non-strict = penalty only. Strict = block misaligned signals.

Step 4: Read Dashboard

Look for MTF alignment (e.g., "MTF H1: BULL"). Trade only when dashboard turns Goldenrod (A/A+ grade).

Step 5: Watch Exhaustion Alert

20% signal density = choppy market. Reduce size or switch to REVERSION mode.

Step 6: Look for Confluence

Highest probability: Divergence arrow + Zero cross arrow + Grade A/A+ + MTF alignment.

Step 7: Use Acceleration Arrows for Confirmation

Yellow/Orange arrows confirm genuine dead zone breakout, fewer false signals.


Pro Tips

  1. Respect the grey area - no trades when histogram is grey.

  2. Use MTF confirmation for higher probability entries.

  3. Divergence + Grade A = high probability reversal setup.

  4. Multiple arrows aligned = stronger signal.

  5. Current candle always grey - wait for close (no repainting).

  6. Signal line colour gives quick bias: blue = bullish, orange = bearish.

  7. Manual dead zone: 0.001-0.005 for quiet instruments, increase BB StdDev for volatile ones.


Technical Specifications

Specification Details
Asset Classes Forex, Stocks, Crypto, Indices
Timeframes All (optimised for M15, H1, H4)
EA Ready 8 signal buffers
Non-Repainting Signals on closed bars only
Divergence Lines Price chart + indicator window
MTF Confirmation Dual timeframe, hybrid architecture
CPU Efficient Smart calculation on new bars only


© Copyright 2026, Ebrah 


おすすめのプロダクト
RBreaker Gold Indicatorsは、金先物の短期日内取引戦略であり、トレンドフォローと日内反転の2つの取引手法を組み合わせたものです。トレンド相場での利益を捉えるだけでなく、相場が反転した際には迅速に利確し、その流れに沿ってポジションを反転させることができます。 この戦略は、アメリカの雑誌『Futures Truth』において、15年連続で最も収益性の高い取引戦略トップ10に選ばれた実績を持ち、非常に長いライフサイクルを誇り、現在も国内外で広く使用・研究されています。 本インディケーターは、2026年の金先物の値動きに対応し、14日間のATR指標に基づいて、ブレイクアウト係数A、観察係数B、リバーサル係数Rをより合理的な値で定義しています。非常に優れたインディケーターであり、安定的な年間収益を実現しています。ぜひおすすめします〜
Crypto_Forex MT5用インジケーター「 WPR with 2 Moving Averages 」(リペイント機能なし) - WPR自体はスキャルピングに最適なオシレーターの1つです。 - 「WPR and 2 Moving Averages」インジケーターを使用すると、WPRオシレーターの高速移動平均線と低速移動平均線を確認できます。 - このインジケーターを使用すると、価格調整を早期に把握できます。 - このインジケーターはパラメータで簡単に設定でき、どの時間枠でも使用できます。 - 買いと売りのエントリー条件は画像で確認できます。 - WPR MA クロスの PC およびモバイル アラート付き。 買いシグナルの条件例: (1) - 高速MAが低速MAを下向きにクロスし、WPR値が-50を下回っている場合:買いトレードを開きます。 (2) - WPR値が-20を超える買われすぎゾーンに入ったら:買いトレードを終了します。 売りシグナルの条件例: (1) - 高速MAが低速MAを下向きにクロスし、WPR値が-50を超えている場合:売りトレードを開きます。 (2) WP
STRICTLY FOR BOOM INDEX ONLY!!!!! Here I bring the Maximum Trend Arrows OT1.0 MT5 indicator. This indicator is made up of a combination of different trend indicators for entries and exits, for entries an orange arrow will paint on the chart below the current market and a red flag for closing of trades and it produces buy arrows only. When the orange arrow appears, it will appear along with it's sound to notify you. The 1H timeframe is recommended, don't use it anywhere else than on the 1H timefr
# DRAWDOWN INDICATOR V4.0 - The Essential Tool to Master Your Trading ## Transform Your Trading with a Complete Real-Time Performance Overview In the demanding world of Forex and CFD trading, **knowing your real-time performance** isn't a luxury—it's an **absolute necessity**. The **Drawdown Indicator V4.0** is much more than a simple indicator: it's your **professional dashboard** that gives you a clear, precise, and instant view of your trading account status. --- ## Why This Indicator
Noize Absorption Index - is the manual trading system that measures the difference of pressure between bears forces and bulls forces. Green line - is a noize free index that showing curent situation. Zero value of index shows totally choppy/flat market.Values above zero level shows how powerfull bullish wave is and values below zero measures bearish forces.Up arrow appears on bearish market when it's ready to reverse, dn arrow appears on weak bullish market, as a result of reverse expectation.
HAS RSI Signal — SL/TP自動計算機能付き プロフェッショナル・トレンドインジケーター HAS RSI Signal は、信頼性の高いクラシックな手法と最新のノイズ除去アルゴリズムを融合させた強力なトレーディングツールです。 平均足スムーズド(Heiken Ashi Smoothed) と RSI を組み合わせることで、トレンドの転換点や買われすぎ・売られすぎ圏からの脱出タイミングを正確に捉え、明確なエントリーシグナルを提示します。 主な特徴: 二重のフィルタリング: 平均足スムーズドで市場の「ノイズ」を除去し、RSIで勢い(モメンタム)の強さを確認します。 損切り・利確ラインの自動計算: 単にシグナルを出すだけでなく、ボラティリティ( ATR )に基づいた最適なストップロス(SL) と テイクプロフィット(TP)を自動で算出します。 視覚的な分かりやすさ: シグナルはチャート上にカラーキャンドルとして表示されるため、一目でトレンドを把握でき、取引画面をスッキリと保てます。 充実の通知機能: アラート、音声、スマートフォンへのプッシュ通知機能を搭載。チャンスを逃すこと
Title: Institutional Bias Automator PRO Automate Your Top-Down Analysis. Align Your Trades with Institutional Order Flow by Dawe Trading! The biggest mistake retail traders make is executing setups against the Higher Timeframe (HTF) market bias.   Institutional Bias Automator PRO , engineered by   Dawe Trading , is a sophisticated, fully automated trading system designed to completely eliminate this error. It ensures your execution is always mathematically aligned with high-probability institut
##   ONLY GOLD ##   Тiльки Золото ## **Mercaria Professional Trading Zones - Complete Guide** ## **Mercaria Professional Trading Zones - Повний посібник** ### **How Mercaria Zones Work / Як працюють зони Mercaria** **English:** Mercaria Zones is an advanced trading indicator that identifies high-probability support and resistance areas using ZigZag extremes combined with mathematical zone calculations. The indicator works on multiple timeframes simultaneously, providing a comprehensive view
"Impulses and Corrections 5" is created to help traders navigate the market situation. The indicator shows multi-time frame upward and downward "Impulses" of price movements. These impulses are the basis for determining the "Base" , which is composed of zones of corrections of price movements, as well as "Potential" zones for possible scenarios of price movement. Up and down impulses are determined based on a modified formula of Bill Williams' "Fractals" indicator. The last impulse is always "U
Axiom Point — Precision Structural Breakout Indicator Axiom Point is a high-performance analytical indicator designed to identify high-probability reversal zones using price-action behaviour and adaptive balance filtering. The indicator applies a multi-layer analytical model to detect moments when price transitions beyond its normal equilibrium area, indicating a potential shift in market momentum. Unlike conventional trend-following tools, Axiom Point focuses on so-called points of no return —
Description : Rainbow EA MT5 is a simple Expert advisor based on   Rainbow MT5 indicator witch is based on Moving average with period 34. The indicator is incorporated in the EA, therefore, it is not required for the EA to operate, but if you wish, you can download it from   my product page . The Expert Advisor settings are as follows : Suitable for Timeframes up to H1 The parameters below can be set according to your trading rules. StopLoss ( Stop Loss in pips) TakeProfit ( Take Profit in pips
PipFinite Trend PRO MT5
Karlo Wilson Vendiola
4.84 (557)
Breakthrough Solution For Trend Trading And Filtering With All Important Features Built Inside One Tool! Trend PRO's smart algorithm detects the trend, filters out market noise and gives entry signals with exit levels. The new features with enhanced rules for statistical calculation improved the overall performance of this indicator. Important Information Revealed Maximize the potential of Trend Pro, please visit www.mql5.com/en/blogs/post/713938 The Powerful Expert Advisor Version Automatin
CosmiCLab SMC FIBO CosmiCLab SMC FIBO is a professional trading indicator designed for traders who use Smart Money Concepts (SMC), market structure analysis and Fibonacci retracement levels. The indicator automatically detects market swings and builds Fibonacci levels based on the latest impulse movement. It also identifies market structure changes such as BOS (Break of Structure) and CHOCH (Change of Character), helping traders understand the current market direction. CosmiCLab SMC FIBO also pr
Universal Soul Reaper is an atmospheric market-flow oscillator designed to interpret price behavior as a cycle of spiritual energy. Instead of reacting to raw price alone, it visualizes the state of the market’s soul —revealing when momentum is awakening, stabilizing, or fading. The indicator operates in a separate window and presents three interwoven entities: the Ectoplasmic Veil , the Spirit Boundary , and the Soul Core . Together, they form a living framework that helps traders sense pressu
Naturu
Ivan Stefanov
5 (1)
「Naturu(ナチュル)」は自然の対称性をアルゴリズムとして用いる手動インジケーターです。 シンプルな戦略と隠された知恵でマーケットを制覇しましょう! インジケーターを読み込むと、上側(Top)と下側(Bottom)の2本のラインが表示されます。 ラインを一度クリックするとアクティブ化され、移動させたいローソク足をクリックするだけでその位置に移動できます。 高値ポイントと安値ポイントを設定すると、インジケーターが自動的に以下を計算します: マゼンタのゾーン:ブル(買い勢)とベア(売り勢)の関心が最も接近する、サポート/レジスタンスになりやすいエリア グレーのゾーン:次に注目されるエリア アクア色のライン:ブルの価格目標 ゴールド色のライン:ベアの価格目標 手動インジケーターは完全なコントロールと柔軟性を提供し、リアルタイムの相場状況や個人の直感に応じてラインを調整できます。 価格の動きを自ら深く分析することで、サポートやレジスタンス、チャートパターンの形成を本質的に理解できます。 人間の判断を活かすことで、自動システムが誤認しがちなノイズを除去し、誤シグナルを減らします。 また、自分
The   Trendlines Oscillator   helps traders identify trends and momentum based on the normalized distances between the current price and the most recently detected bullish and bearish trend lines. The indicator features bullish and bearish momentum, a signal line with crossings, and multiple smoothing options. USAGE The   Trendlines Oscillator   works by systematically: Identifying pivot highs and lows. Connecting pivots to form bullish (support) and bearish (resistance) trendlines. Measuring
Inverted_Chart_EA Utility Expert Advisor Inverted_Chart_EA creates and maintains a mirror-inverted chart of any symbol and timeframe. It automatically generates a custom instrument (e.g. US30_INV ) and keeps its price history updated in real time, with bars mirrored around a chosen pivot. This utility gives traders a new way to analyze the market from a different perspective by flipping the chart upside down. Why use an inverted chart? Highlight hidden patterns – price formations that look ordin
Harvester Pro Universal Master The Ultimate Volatility Breakout & Trend-Following Solution for XAUUSD and Major Pairs. Harvester Pro Universal Master is a professional-grade Expert Advisor (EA) engineered for high-performance trading on the MetaTrader 5 (MT5) platform. Optimized specifically for XAUUSD (Gold) and major currency pairs like EURUSD , this EA combines a sophisticated Volatility Breakout engine with a robust EMA/TEMA Trend-Following filter to capture explosive market moves with surg
Divergent Stochastic Filter II Catch Reversals Early, Filter Noise, Trade with Confidence The Edge: Why This Stochastic is Different  Every trader knows the Stochastic oscillator. But knowing when to trust its signals, that's the real challenge. The Divergent Stochastic Filter II transforms this classic indicator into a precision reversal detection system by adding critical elements: divergence intelligence, signal filtering and exhaustion detection.  While standard Stochastic oscillators fire s
DAILY OH/OL SDEV QUANT MODEL - STATISTICAL TRADING WITH PRECISION RISK MANAGEMENT TRADE WITH MATHEMATICAL CERTAINTY - KNOW YOUR EXACT STOP-LOSS AND TAKE-PROFIT BEFORE YOU ENTER This indicator analyzes 5,000+ days of price history to give you: Exact entry levels (sigma bands locked at daily open) Exact stop-loss distance (from M
Chỉ báo này sẽ thông báo cho bạn nếu cấu hình xu hướng thành công. Tín hiệu theo xu hướng không nên được tăng theo, nhưng tín hiệu mua ở mức giá thấp theo mô hình giao dịch thông thường của bạn, hoặc tín hiệu bán ở mức giá tốt, là một lựa chọn rất tốt. Hãy thiết lập nó trên khung thời gian lớn hơn và theo dõi các khung thời gian nhỏ hơn, bám sát các xu hướng chính. Tôi thường thiết lập ba khung thời gian gần nhau nhất và không bao giờ đi ngược tín hiệu của INdicator này. INdicator   này không có
Short Description Swing Timing Breakout EA is a smart Expert Advisor for MetaTrader 5 that combines trend filtering, momentum timing, and dynamic risk management to capture high-probability swing and breakout opportunities. Full Description Swing Timing Breakout EA is a professional trading robot designed for MetaTrader 5, suitable for traders who want a balance between automation, control, and disciplined risk management. This EA uses a trend-following and momentum confirmation approach ,
This indicator is used to compare the relative strength of the trade on the chart against the other several selected symbols. By comparing the price movement of each traded variety based on the same base day, several trend lines of different directions can be seen, reflecting the strong and weak relationship between the several different traded varieties, so that we can have a clearer understanding of the market trend. For example, you can apply this indicator on a EurUSD chart and compare it w
Classic SNR MetaTrader 5 Expert Advisor | Multi-Symbol Support & Resistance Trading with Trend-Based Logic Overview Classic SNR Breakout EA is a professional trading robot that identifies structural Support & Resistance levels using daily swing points and executes trades based on H1 price action relative to these levels. The EA applies   dual logic : in an uptrend, it sells on H1 rejection below an SNR level; in a downtrend, it buys on H1 rejection above an SNR level. Breakout confirmations are
プレミアムレベルは、正しい予測の精度が80%を超える独自の指標です。 この指標は、最高のトレーディングスペシャリストによって2か月以上テストされています。 あなたが他のどこにも見つけられない作者の指標! スクリーンショットから、このツールの正確さを自分で確認できます。 1は、1キャンドルの有効期限を持つバイナリーオプションの取引に最適です。 2はすべての通貨ペア、株式、商品、暗号通貨で機能します 手順: 赤い矢印が表示されたらすぐにダウントレードを開き、青い矢印が表示されたら閉じます。青い矢印の後に開くこともできます。 試してテストしてください!推奨設定はデフォルトです! 日足チャートで最高の精度を示します! インディケータは、2600 Pipsの収益性に対して、約10Pipsという非常に小さなマージンを使用します。
The  SuperTrend Advance Trading  is a widely-used technical indicator based on  SuperTrend Strategy + Price Action + EMA . How it works: -  Buy/Sell Signals  can be generated when the trend reverses, the conditions of Price action, TrendLine and EMA are met. - After the  Signal  appears, be patient and wait until the candle closes, at that time place the order as soon as possible. You may have time to review your entry, consider whether it is a good entry or not. - Carefully review the entry, up
Improved version of the free HMA Trend indicator (for MetaTrader 4) with statistical analysis. HMA Trend is a trend indicator based on the Hull Moving Average (HMA) with two periods. HMA with a slow period identifies the trend, while HMA with a fast period determines the short-term movements and signals in the trend direction. The main differences from the free version: Ability to predict the probability of a trend reversal using analysis of history data. Plotting statistical charts for analyzi
インジケーターについて このインジケーターは、金融商品の終値に対するモンテカルロシミュレーションに基づいています。モンテカルロ法とは、以前の観測結果に基づくランダムな数値を使用して、さまざまな結果の確率をモデル化するための統計的手法です。 どのように機能しますか? このインジケーターは、歴史的データに基づき、時間の経過とともにランダムに価格が変動する複数の価格シナリオを生成します。各シミュレーション試行は、 終値 の変動を考慮するためのランダム変数を使用し、与えられた期間における将来の市場変動を効果的に模倣します。 モンテカルロシミュレーションの利点 - モンテカルロシミュレーションは、複数の将来のシナリオに対して戦略をテストすることで、さまざまなトレード戦略のリスクを分析するのに役立ちます。 - 稀な極端なイベント(テールリスク)を含むさまざまな市場状況で戦略のパフォーマンスを把握することができます。 - 単一の予測に依存するのではなく、モンテカルロ法は関連する確率を伴う潜在的な結果の範囲を提供します。これにより、利益や損失の可能性を理解するのに役立ちます。 モンテカルロ法は、
Mine Farm is one of the most classic and time-tested scalping strategies based on the breakdown of strong price levels. Mine Farm is the author's modification of the system for determining entry and exit points into the market... Mine Farm - is the combination of great potential with reliability and safety. Why Mine Farm?! - each order has a short dynamic Stop Loss - the advisor does not use any risky methods (averaging, martingale, grid, locking, etc.) - the advisor tries to get the most
SMT DIVERGENCE - GOLD vs SILVER (XAUUSD / XAGUSD) All Timeframe MQL5 Market Product Description ==================================================================== PRODUCT NAME: SMT Divergence Gold vs Silver | Smart Money Scalping Tool SHORT DESCRIPTION (max 63 chars): Catch Gold reversals before they happen using SMT Divergence ---------------------------------------------------------------------- FULL DESCRIPTION ---------------------------------------------------------------------- W
FREE
このプロダクトを購入した人は以下も購入しています
ARIPoint is a powerful trading companion designed to generate high-probability entry signals with dynamic TP/SL/DP levels based on volatility. Built-in performance tracking shows win/loss stats, PP1/PP2 hits, and success rates all updated live. Key Features: Buy/Sell signals with adaptive volatility bands Real-time TP/SL/DP levels based on ATR Built-in MA Filter with optional ATR/StdDev volatility Performance stats panel (Success, Profit/Loss, PP1/PP2) Alerts via popup, sound, push, or email Cu
SuperScalp Pro
Van Minh Nguyen
4.63 (24)
SuperScalp Pro – 高度なマルチフィルタースキャルピングインジケーターシステム SuperScalp Pro は、クラシックな Supertrend と複数のインテリジェント確認フィルターを組み合わせた高度なスキャルピングインジケーターです。M1 から H4 まで複数の時間足で効率的に動作し、XAUUSD、BTCUSD、主要 Forex 通貨ペア向けに最適化されています。 このインジケーターは明確な Buy / Sell シグナルを提供し、ATR に基づいてエントリー価格、Stop Loss、Take Profit を自動計算します。Fibonacci Take Profit 機能により、重要な価格帯で早期決済し、到達時に通知を送信します。 初期設定では Fibonacci Take Profit が有効化されており、より安定した取引体験を重視しています。チャートに適用するだけですぐ利用可能です。上級者向けに、すべてのパラメータは自由にカスタマイズできます。 EMA、RSI、ADX、Volume、VWAP、Bollinger Bands、MACD Divergence な
Entry In The Zone and SMC Multi Timeframe is a real-time 2-in-1 market analysis tool that combines market structure analysis and a No Repaint BUY / SELL signal system into a single indicator, built on Smart Money Concepts (SMC) — a widely adopted framework used by professional traders to understand market structure. This indicator helps you see the market more clearly, make decisions based on structure rather than guesswork, and focus on high-probability zones where price is more likely to react
このインジケーターを購入された方には、以下の特典を 無料 で提供しています: 各トレードを自動で管理し、ストップロスとテイクプロフィットを設定し、戦略ルールに基づいてポジションを決済する補助ツール 「Bomber Utility」 様々な銘柄に合わせたインジケーターの設定ファイル(セットファイル) 「最小リスク」、「バランスリスク」、「待機戦略」 の3つのモードで使用できる Bomber Utility 用の設定ファイル このトレーディング戦略をすぐに導入・設定・開始できる ステップバイステップのビデオマニュアル ご注意: 上記の特典を受け取るには、MQL5のプライベートメッセージシステムを通じて販売者にご連絡ください。 オリジナルのカスタムインジケーター 「Divergence Bomber(ダイバージェンス・ボンバー)」 をご紹介します。これは、MACDのダイバージェンス(乖離)戦略に基づいた 「オールインワン」型のトレーディングシステム です。 このテクニカルインジケーターの主な目的は、価格とMACDインジケーターの間に発生するダイバージェンスを検出 し、将来の価格の動きを示す
Power Candles V3 - 自己最適化型強弱インジケーター Power Candles V3は 、通貨や銘柄の強さを、適用されたすべてのチャート上で実行可能なトレードプランに変換します。単にローソク足を色分けするだけでなく、バックグラウンドでリアルタイムの自動最適化を実行し、目の前の銘柄に対して最適なストップロス、テイクプロフィット、およびシグナルの閾値を提示します。ワンクリックで実取引に適用でき、エントリーポイント、ストップロス、テイクプロフィットのラインが正確な価格位置にチャート上に表示され、方向性を示すアラートがリアルタイムで発動します。 このツールは、Stein Investmentsのエコシステムの一部です。  18種類以上のツールをすべて閲覧し、AIを活用したセットアップの推奨事項を入手し、  https://stein.investments でコミュニティに参加しましょう クローズしたバーごとに3,000回以上のトレードシミュレーション。9つの強さの状態。2つの戦略を並行してテスト。勝率の高い設定をワンクリックで適用。 なぜこれが必要なのか ほとんどの強
SignalTech MT5 is a fully rule based trading system for EURUSD, USDCHF, USDJPY, AUDUSD, NZDUSD, EURJPY, AUDJPY, NZDJPY, CADJPY.  All the winning trades with chart setups are published on the comments page. 2025-12 1174 Pips 2026-01 2624 Pips 2026-02 2937 Pips 2026-03 2165 Pips 2026-04 2243 Pips It can generate signals with Buy/Sell Arrows and Pop-Up/Sound Alerts. Each signal has clear Entry and Stop Loss levels, which should be automatically flagged on the chart, as well as potential Targets 1,
ご紹介     Quantum Breakout PRO は 、ブレイクアウト ゾーンの取引方法を変革する画期的な MQL5 インジケーターです。 13年以上の取引経験を持つ経験豊富なトレーダーのチームによって開発されました。     クォンタム ブレイクアウト プロ   は、革新的でダイナミックなブレイクアウト ゾーン戦略により、あなたのトレーディングの旅を新たな高みに押し上げるように設計されています。 クォンタム ブレイクアウト インジケーターは、5 つの利益ターゲット ゾーンを備えたブレイクアウト ゾーン上のシグナル矢印と、ブレイクアウト ボックスに基づいたストップロスの提案を提供します。 初心者トレーダーにもプロのトレーダーにも適しています。 量子EAチャネル:       ここをクリック 重要!購入後、インストールマニュアルを受け取るためにプライベートメッセージを送ってください。 推奨事項: 時間枠: M15 通貨ペア: GBPJPY、EURJPY、USDJPY、NZDUSD、XAUUSD アカウントの種類: ECN、Raw、またはスプレッドが非常に低い R
Azimuth Pro
Ottaviano De Cicco
5 (7)
Azimuth Pro V2:MT5向けシンセティック・フラクタル構造分析と確認済みエントリー 概要 Azimuth Pro は Merkava Labs によるマルチレベルスイング構造インジケーターです。4つのネストされたスイングレイヤー、スイングアンカーVWAP、ABCパターン検出、3タイムフレーム構造フィルタリング、そして確定バーでの確認済みエントリー — 1つのチャートで、ミクロスイングからマクロサイクルまでを網羅するワークフロー。 これはブラインドシグナル製品ではありません。ロケーション、コンテキスト、タイミングを重視するトレーダーのための構造ファーストワークフローです。 V2発売記念オファー — Azimuth Pro V2をUSD 399で(次の100本)。最終価格:USD 499。 1. V2での変更点 シンセティック・マルチタイムフレームエンジン 上位タイムフレーム分析をMeridian Proと同じ独自のシンセティックアーキテクチャで一から再構築。よりクリーンなHTFコンテキスト、安定したライブ動作、従来のMTF同期問題なし。シンセティックエンジンは 固定比率タ
RelicusRoad Pro: 定量的市場オペレーティングシステム 【期間限定】無制限アクセス 70% OFF - 2,000人超のトレーダーと共に なぜ多くのトレーダーは「完璧な」インジケーターを使っても失敗するのでしょうか? それは、文脈を無視して 単一の概念 だけでトレードしているからです。文脈のないシグナルは単なるギャンブルです。勝ち続けるには、 根拠の重なり(コンフルエンス) が必要です。 RelicusRoad Proは単なる矢印インジケーターではありません。完全な 定量的市場エコシステム です。独自のボラティリティモデリングを用いて、価格が推移する「適正価値の道(Fair Value Road)」をマッピングし、ノイズと真の構造的ブレイクを判別します。 推測はやめましょう。機関投資家レベルの「ロード・ロジック」でトレードを。 コアエンジン:「Road」アルゴリズム システムの中心となる Road Algo は、市場環境にリアルタイムで適応するダイナミックなボラティリティチャネルです。 安全ライン(平衡点) と、価格が数学的に反転しやすい 拡張レベル を投影します。 Si
MetaTrader 5 向けスマート多層ブレイクアウト&プルバック検出器 「スマート・シンプル・ファスト!」 高確率のブレイクアウトエントリーを見逃すことにうんざりしていませんか? 複数のチャートを何時間もスキャンし、ブレイクアウトをトレンド方向と通貨のモメンタムに合わせようとして、それでも動きを逃してしまうことはありませんか? Break Pullback は、1つのインジケーターでそのすべてを解決します。 Break Pullback とは何ですか? Break Pullback は、マーケットストラクチャー、ブレイクアウト、トレンド継続のセットアップを取引するトレーダー向けに特別に設計されたプロフェッショナルグレードの MetaTrader 5 インジケーターです。 リアルタイムで複数の通貨ペアにわたるブレイクとプルバックの形成を自動的に検出し、3層の確認を通じてすべてのシグナルをフィルタリングします: ストラクチャラルブレイクアウト検出 — チャート上の主要なブレイクレベルを特定 HTF 日足バイアス — エントリーを支配的な日足トレンド方向に合わせる 通貨強弱指数 —
このインジケーターを購入すると、プロ仕様のトレードマネージャーを無料で差し上げます。 まず第一に、このトレーディングシステムがノンリペイント、ノンリドロー、ノンラグのインジケーターであることを強調する価値がある。これにより、手動取引とロボット取引の両方に理想的なものになっています。 オンラインコース、マニュアル、プリセットのダウンロード。 「スマートトレンドトレーディングシステム MT5」は、新規および経験豊富なトレーダー向けにカスタマイズされた包括的なトレーディングソリューションです。10以上のプレミアムインジケーターを組み合わせ、7つ以上の堅実なトレーディング戦略を備えており、多様な市場状況に対応する多目的な選択肢となっています。 トレンドフォロー戦略:トレンドを効果的に乗り越えるための正確なエントリーとストップロス管理を提供します。 リバーサル戦略:潜在的なトレンドの反転を特定し、トレーダーがレンジ相場を活用できるようにします。 スキャルピング戦略:高速で正確なデイトレードおよび短期取引のために設計されています。 安定性:すべてのインジケーターはノンリペイント、ノンリドロー、ノ
まず第一に、この取引インジケーターは再描画されず、再描画されず、遅延しないことを強調する価値があります。これにより、手動取引とロボット取引の両方に理想的なものになります。 ユーザーマニュアル:設定、入力、戦略。 アトミックアナリストは、価格の強さとモメンタムを利用して市場でより良いエッジを見つけるためのPA価格アクションインジケーターです。ノイズや誤ったシグナルを除去し、取引ポテンシャルを高めるための高度なフィルターを備えています。複雑なインジケーターの複数のレイヤーを使用して、アトミックアナリストはチャートをスキャンし、複雑な数学的計算をシンプルなシグナルと色に変換します。これにより、どのような初心者トレーダーでも理解して使用し、一貫した取引の決定を行うことができます。 「アトミックアナリスト」は、新規および経験豊富なトレーダー向けにカスタマイズされた包括的な取引ソリューションです。プレミアムインジケーターとトップノッチの機能を1つの取引戦略に組み合わせ、すべてのタイプのトレーダーにとって汎用性のある選択肢にします。 デイリートレーディングとスキャルピング戦略:高速で正確なデイ
Quantum TrendPulse を ご紹介します。これは、   SuperTrend   、   RSI   、および Stochastic のパワーを 1 つの包括的なインジケーターに組み合わせて、取引の可能性を最大限に引き出す究極の取引ツールです。精度と効率を求めるトレーダー向けに設計されたこのインジケーターは、市場のトレンド、勢いの変化、最適なエントリー ポイントとエグジット ポイントを自信を持って特定するのに役立ちます。 主な特徴: SuperTrend 統合: 現在の市場動向に簡単に追従し、収益性の波に乗ることができます。 RSI精度: 買われすぎと売られすぎのレベルを検出し、市場の反転のタイミングに最適で、SuperTrendのフィルターとして使用されます。 確率的精度: 確率的振動を活用して、変動の激しい市場で隠れたチャンスを見つけます。SuperTrend のフィルターとして使用されます。 マルチタイムフレーム分析:   M5 から H1 または H4 まで、さまざまなタイムフレームで市場を常に把握します。 カスタマイズ可能なアラート: カスタム取引条件が満たされ
FX Trend NG:次世代マルチマーケット・トレンドインテリジェンス 概要 FX Trend NG は、複数の時間足に対応したプロフェッショナル向けトレンド分析およびマーケット監視ツールです。 市場全体の構造を数秒で把握することができます。 複数のチャートを切り替える必要はありません。どの銘柄がトレンド中なのか、どこでモメンタムが弱まっているのか、そしてどの時間足で強い整合性があるのかを瞬時に確認できます。 ローンチ特別オファー – FX Trend NG を $30(6ヶ月) または $80 永久ライセンス でご利用いただけます。 すでに Stein Investments のユーザーですか? -> メッセージを送信 して、プライベートグループへアクセスしてください。 セットアップや詳細情報が必要ですか? -> Stein Investments 公式ページ をご覧ください。 1. FX Trend NG が他と異なる理由 3ステート・トレンドロジック ― Buy と Sell だけではない • 多くのインジケーターは Buy または Sell の2状態のみを表示します。
BTMM State Engine Pro is a MetaTrader 5 indicator for traders who use the Beat The Market Maker approach: Asian session context, kill zone timing, level progression, peak formation detection, and a multi-pair scanner from a single chart. It combines cycle state logic with a built-in scanner dashboard so you do not need the same tool on many charts at once. What it does Draws the Asian session range; session times can follow broker server offset or be set in inputs. Tracks level progression (L
まず第一に、この取引ツールはノンリペイント、ノンリドロー、ノンラグの指標であり、プロの取引に理想的ですことを強調する価値があります。 オンラインコース、ユーザーマニュアル、デモ。 スマートプライスアクションコンセプトインジケーターは、新米から経験豊富なトレーダーまで、非常 に強力なツールです。Inner Circle Trader AnalysisやSmart Money Concepts Trading Strategiesなど、20以上の有用な指標を1つに組み合わせています。このインジケーターはスマートマネーコンセプトに焦点を当て、大手機関の取引方法を提供し、彼らの動きを予測するのに役立ちます。 特に、流動性分析に優れており、機関がどのように取引しているかを理解しやすくしています。市場のトレンドを予測し、価格の動きを慎重に分析するのに優れています。機関の戦略とトレードを合わせることで、市場の動向についてより正確な予測ができます。このインジケーターは多目的であり、市場構造を分析し、重要な注文ブロックを特定し、さまざまなパターンを認識するのに優れています。 このインジケーター
OrderFlux | MetaTrader 5 用フットプリント・オーダーフロー バージョン 2.0 – アクティブトレーダー向けのリアルタイム Bid/Ask 可視化 OrderFlux は MT5 用のフットプリントおよびオーダーフローインジケーターです。価格がどこに動いたかだけでなく、その動きの中で何が起きているか(各価格レベルの Bid/Ask ボリューム、デルタ、インバランス、ボリューム分布)を表示します。 多くのチャートはローソク足の最終結果しか表示しません。OrderFlux はそこに至るまでの過程を表示します。ローソク足の形状だけでなく、市場参加者の動向を読み取りたい場合にまさに役立ちます。 ライブチャートにおいて、OrderFlux は主に次の3つの質問に答えます: 現在、どこで積極的な買いまたは売りの圧力が市場に参入しているか? どの価格レベルでボリュームが吸収、または拒否されているか? 現在の動きはセッションのコンテキスト(背景)にどう適合しているか? インターフェースで得られるもの メインチャートは、Canvas ベースでフットプリントを直接レンダリングします
優れたテクニカルインジケーター「Grabber」をご紹介します。これは、すぐに使える「オールインワン」トレーディング戦略として機能します。 ひとつのコードに、市場のテクニカル分析ツール、取引シグナル(矢印)、アラート機能、プッシュ通知が強力に統合されています。 このインジケーターを購入された方には、以下の特典を無料で提供します: Grabberユーティリティ:オープンポジションを自動で管理するツール ステップバイステップのビデオマニュアル:インジケーターのインストール、設定、取引方法を解説 カスタムセットファイル:インジケーターをすばやく自動設定し、最大限の成果を出すための設定ファイル 他の戦略はもう忘れてください!Grabberだけが、あなたを新たなトレードの高みへと導いてくれるのです。 Grabber戦略の主な特徴: 推奨タイムフレーム:M5〜H4 対応通貨ペア・資産:どれでも使用可能ですが、私が実際に検証した以下を推奨します(GBPUSD、GBPCAD、GBPCHF、AUDCAD、AUDUSD、AUDSGD、AUDCHF、NZDUSD、NZDCAD、EURCAD、EURUSD、E
「 Dynamic Scalper System MT5 」インジケーターは、トレンド波の中でスキャルピング取引を行う手法のために設計されています。 主要通貨ペアと金でテスト済みで、他の取引商品との互換性があります。 トレンドに沿った短期的なポジションオープンのシグナルを提供し、追加の価格変動サポートも提供します。 インジケーターの原理 大きな矢印はトレンドの方向を決定します。 トレンド波の中では、小さな矢印の形でスキャルピングシグナルを生成するアルゴリズムが機能します。 赤い矢印は強気方向、青い矢印は弱気方向です。 トレンドの方向には敏感な価格変動ラインが描かれ、小さな矢印のシグナルと連動します。 シグナルは次のように機能します。適切なタイミングでラインが現れるとエントリーシグナルが形成され、ラインが開いている間はポジションが保持され、完了すると取引が終了します。 推奨される動作時間枠はM1~H4です。 矢印は現在のローソク足に形成され、次のローソク足が開いている場合は、前のローソク足の矢印は再描画されません。 入力パラメータ Trend Wave Period - トレ
このダッシュボードは、選択されたシンボルの最新の利用可能なハーモニックパターンを表示するので、時間を節約し、より効率的に /   MT4バージョン 。 無料インジケーター:   Basic Harmonic Pattern インジケーター列 Symbol : 選択したシンボルが表示されます。 Trend :   強気または弱気 Pattern : パターンの種類(ガートレー、バタフライ、バット、カニ、サメ、サイファー、ABCD) Entry : エントリー価格 SL: ストップロス価格 TP1: 1回目の利食い価格 TP2: 2回目の利食い価格 TP3:   3回目の利食い価格 Current price :   現在値 Age (in bars):    最後に描画されたパターンの年齢 主な入力項目 Symbols:   "28 Major Currency Pairs "または "Selected Symbols "から選択。 Selected Symbols:   カンマで区切られた監視したいシンボル("EURUSD,GBPUSD,XAUUSD")。ブローカーがペアに接
Meridian Pro
Ottaviano De Cicco
5 (2)
Meridian Pro 2.00:MT5向けプロ仕様マルチタイムフレーム・トレンドマトリクス Meridian Pro 2.00 は、MetaTrader 5 向けのプロ仕様の適応型トレンドマトリクスです。オリジナルの Meridian トレンドエンジン、クリーンなチャート ribbon、確定足ベースのシグナル矢印、8時間足 dashboard、Fuel momentum、weighted consensus、synthetic HTF processing、そしてチャート上に直接表示される上位足コンテキストラインを統合します。 目的はシンプルです。現在のトレンド、マルチタイムフレーム構造、強度、momentum、EA-ready 状態を、複数チャートに無関係なインジケータを重ねるのではなく、1つの整理された workflow で読むことです。 Meridian Pro の違い 1つの適応型エンジン - 同じ volatility-aware Meridian ロジックを M1 から W1 まで適用します。 Synthetic HTF architecture - 上位足行は下位足デ
OmniSync Projection
Antonio-alin Teculescu
5 (1)
Chronos Fractal Engine is an innovative price projection indicator for MetaTrader 5, designed to transform your technical analysis by intelligently identifying and projecting historical price patterns. Built upon an advanced correlation algorithm and the fractal principles of the market, this powerful tool visualizes potential future price movements, giving you a unique edge in your trading decisions. What is Chronos Fractal Engine? At its core, the Chronos Fractal Engine employs a sophisticat
FX Power: 通貨の強弱を分析して、より賢い取引を実現 概要 FX Power は主要通貨と金の実際の強弱をあらゆる市場状況で理解するための必須ツールです。強い通貨を買い、弱い通貨を売ることで、 FX Power は取引の意思決定を簡素化し、高い確率の取引機会を見出します。トレンドを追従する場合でも、極端なデルタ値を使用して反転を予測する場合でも、このツールはあなたの取引スタイルに完全に適応します。ただ取引するだけではなく、 FX Power で賢く取引をしましょう。 1. なぜ FX Power がトレーダーにとって非常に有益なのか 通貨と金のリアルタイム強弱分析 • FX Power は主要通貨と金の相対的な強弱を計算し、マーケットダイナミクスに関する明確な洞察を提供します。 • どの資産がリードしているか、または後れを取っているかを監視して、取引するペアを賢く選びましょう。 マルチタイムフレームの包括的なビュー • 短期、中期、長期のタイムフレームで通貨と金の強弱を追跡し、マーケットトレンドに基づいて取引戦略を調整できます。 • スキャルピングからスイングトレード
Market Structure Patterns
Samuel Manoel De Souza
4.47 (19)
Market Structure Patterns   is an indicator based on   smart money concepts   that displays   SMC/ICT   elements that can take your trading decisions to the next level. Take advantage of the   alerts ,   push notifications   and   email messages   to keep informed from when an element is formed on the chart, the price crosses a level and/or enters in a box/zone. Developers can access the values of the elements of the indicator using the   global variables  what allows the automation of trading
トレンドラインプロ   市場の真の方向転換点を理解するのに役立ちます。この指標は、真のトレンド反転と主要プレーヤーが再び参入するポイントを示します。 分かりますか     BOSライン   複雑な設定や不要なノイズなしに、より長い時間足でのトレンドの変化と重要なレベルを把握できます。シグナルは再描画されず、バーが閉じた後もチャート上に残ります。 MT4バージョン   -   RFI LEVELS PRO インジケーター と組み合わせることで、その最大限の能力を発揮します インジケーターが示す内容: 本当の変化   トレンド(BOSライン) 一度シグナルが現れたら、それは有効です!これは、リペイント機能を持つインジケーターとの重要な違いです。リペイント機能を持つインジケーターは、シグナルを発した後、それを変更し、資金の損失につながる可能性があります。これにより、より高い確率と精度で市場に参入できます。また、矢印が現れた後、目標値(利益確定)に達するか、反転シグナルが現れるまで、ローソク足の色を変更する機能もあります。 繰り返しエントリ   主要プレーヤーの補充 エントリーポイントを探す
The Zone Trading Indicator is a technical analysis tool for MetaTrader 5 that automatically identifies and displays tradable price zones across multiple timeframes to assist with structured market analysis. The indicator plots Monthly, Weekly, Daily, and H4 tradable zones , allowing traders to view higher- and lower-timeframe price areas simultaneously. These zones are designed to support one-candle–based entry approaches by highlighting predefined areas where price interaction may be monitored.
このインジケーターは、反転ポイントと価格戻りゾーンを正確に表示します。     主要プレーヤー 。新たなトレンドが形成される場所を把握し、最大限の精度で意思決定を行い、すべての取引をコントロールします。 TREND LINES PRO インジケーターと組み合わせることで、その潜在能力を最大限に発揮します。 VERSION MT4 インジケーターが示す内容: 新しいトレンドの始まりに活性化する反転構造と反転レベル。 リスクと報酬の比率を最小限に抑えた利益 確定 と 損失停止の レベルの表示     RR 1:2   。 インテリジェントな削減ロジックによるストップロス。 指定されたインジケーターから 2 つのトレンド タイプの反転パターンを表示します。 指標: トレンドを追う   TREND LINES PRO   (世界的なトレンドの変化) TREND PRO   (クイックトレンド変更) シンプルで効果的   スキャナー   リアルタイムトレンド(新機能)。 マルチタイムフレームのインストゥルメント フィルタリング。 画面   利益     LOGIC AI信号の後。 当日プラス方
このインディケータは、価格アクション分析とドンチャンチャネルのみを使用して、ジグザグ方式で価格の反転を検出します。再描画やバックペインティングを一切行わずに、短期取引向けに特別に設計されています。それは彼らの操作のタイミングを増やすことを目指している賢明なトレーダーにとって素晴らしいツールです。 [ インストールガイド | 更新ガイド | トラブルシューティング | よくある質問 | すべての製品 ] 驚くほど簡単に取引できます すべての時間枠で価値を提供します 自己分析統計を実装します 電子メール/音声/視覚アラートを実装します 可変長のブレイクアウトと混雑ゾーンに基づいて、インディケータは価格アクションのみを使用して取引を選択し、市場が非常に高速に行っていることに反応します。 過去のシグナルの潜在的な利益が表示されます この指標は、独自の品質とパフォーマンスを分析します 負けブレイクアウトは強調表示され、説明されます インジケータは、非バックペインティングおよび非再ペイントです この指標は、日中のトレーダーが単一の価格反転を見逃さないようにするのに役立ちます。ただし、すべての
Super Signal Market Slayer 非リペイント|高精度|マルチマーケット対応インテリジェントトレンド指標 トレードにおいて本当に難しいのは、 注文することではなく、相場のノイズの中で「トレンドが始まった瞬間」を見極めることです。 Market Slayer はそのために開発されました。 本インジケーターは、日中取引向けに設計された非リペイント型のインテリジェント指標です。 多層確認とトレンドフィルターにより、重要な局面でのみ明確かつ信頼性の高い Buy / Sell シグナルを表示します。 主な特長 非リペイントシグナル 一度表示されたシグナルは固定され、消えたり移動したりしません。 高精度なトレンド判定 複数銘柄で検証され、特にゴールド M5 / M15 で安定した結果を示します。 マルチマーケット対応 ゴールド、FX、指数、主要暗号資産に対応。 日中取引向け最適化 M5・M15 に特化し、ノイズを抑え実行性を向上。 直感的で分かりやすい 初心者でも理解しやすく、すぐに使用可能。 技術ロジック概要 Market Slayer は単一条件の矢印ではありません。 以
サポート線と抵抗線のプロットにうんざりしていませんか? サポートレジスタンス は、非常に興味深いひねりを加えてチャート内のサポートとレジスタンスラインを自動検出およびプロットするマルチタイムフレームインジケーターです。価格レベルは時間とともにテストされ、その重要性が高まるにつれて、ラインは太くなり、暗くなります。 [ インストールガイド | 更新ガイド | トラブルシューティング | よくある質問 | すべての製品 ] 一晩でテクニカル分析を強化 チャートを閲覧せずに重要な価格レベルを検出 一目ですべての価格レベルの相対的な強さを認識する すべての取引で最大30時間のプロットラインを節約 インジケーターは、すべての価格レベルの年齢を表示します インジケーターは再描画されていません 過去および現在の価格レベルは近接によって崩壊し、現在の市場行動に合わせて調整されます。動作は、必ずしもピークではない場所に線が引かれます。 価格レベルは、時間とともに拒否されるにつれて、より暗く、より広くなります ノイズを避けるために、重要でない価格レベルは定期的にクリアされます カスタマイズ可能な時間枠の
作者のその他のプロダクト
Cumulative Volume Delta (CVD) MA-X:インテリジェント・オーダーフロー・センチメントツール Cumulative Volume Delta (CVD) MA-X で、市場の隠れたメカニズムを解き明かしましょう。標準的な出来高指標は「どれだけ」取引されたかを示すだけですが、CVD MA-X は「 誰が 」買い手と売り手の攻防に勝っているのか、そして「 いつ 」それが起きているのかを明らかにします。ティックレベルの値動きと出来高分布を統合することで、市場の確信度と枯渇状態を極めて明確に描き出します。 トレーダーの優位性:なぜ CVD MA-X なのか? 多くのトレーダーが失敗するのは、価格の遅行性に反応してしまうからです。CVD MA-X は、ローソク足の内部圧力(ヒゲと実体の比率)を出来高で加重分析することで、 先行的な優位性 を提供します。リアルタイムで以下の3つの重要な問いに答えます: この動きは「本物の資金」に裏打ちされているか? (CVDとゼロラインの連動) トレンドの勢いが衰えていないか? (MaxBuy/MaxSell 枯渇ポイント) 大口投
The Ultimate Ichimoku MTF Dashboard: Your All-In-One Trading Edge Transform Your Trading with One Powerful Indicator Imagine having a professional trading assistant that monitors multiple timeframes simultaneously, identifies high-probability entries, warns you of potential reversals, and provides clear risk management guidance-all in one clean, intuitive display. That's exactly what the Ichimoku MTF Dashboard delivers.     Why This Isn't Just Another In
T3 MTF PureMath s:マルチタイムフレーム Tillson T3 インジケーター インタラクティブ・ダッシュボード搭載、ゼロラグ・コンフルエンス・トレードシステム マルチタイムフレームがもたらすトレードの優位性 T3 MTF Pure Maths  は、月足から5分足まで、計 8つのタイムフレーム の市場構造を同時に集約するプロ仕様のトレードダッシュボードです。チャートの切り替えや複雑な計算をすることなく、瞬時にアクションにつながる洞察を提供します。 純粋な数学的最適化(インジケーター・ハンドルの不使用、CopyBufferコールの排除)に基づいて構築されており、標準的なインジケーター実装よりも 5〜10倍高速なパフォーマンス を実現。リアルタイムトレードだけでなく、負荷の高いストラテジーテストにも最適です。 このインジケーターが解決する疑問 トレーダーの疑問 T3 MTF Pureによる回答 全体的なトレンド構造は? 色分けされたトレンドパネルで、MN1からH4までの整合性を一目で確認。 最高の注文タイミング(エントリー)は? エントリー用時間足(H1-M30-M15
MTF VWAP Indicator - Quick Overview   This indicator shows you where institutional money is flowing across multiple timeframes using Volume Weighted Average Price (VWAP) to identify high-probability trading zones.     What It Actually Does:     1. Tracks Smart Money Levels: - Shows Daily, Weekly, and Monthly VWAP lines where big players (banks, funds) are trading - Tells you if price is above or below these key institutional levels - Shows distance from VWAP as a percentage (tells you how extend
Cumulative Volume Delta MA-X MTF (Gradient Momentum 搭載) このインディケーターは、MetaTrader 5向けにマルチタイムフレーム(MTF)での累積ボリューム・デルタ(CVD)分析を行います。ティックデータまたはリアルボリュームデータを分析することで、買い圧力と売り圧力の純差を計算し、オーダーフローのセンチメントを視覚的に表現します。 ロジックと機能 このインディケーターは、数学的なアプローチを用いてボリューム分析を行います: データソース : 取引所銘柄のリアルボリューム(Real Volume) と、FX/CFD向けの OHLCウィック・プロキシ(OHLC Wick Proxy)計算の両方をサポートしています。 グラデーションシステム : 4色の移動平均線がトレンドの段階を識別します: ディープスカイブルー(DeepSkyBlue) : 数値が正で、上昇中。 オレンジ(Orange) : 数値が正で、下落中。 マゼンタ(Magenta) : 数値が負で、下落中。 パープル(Purple) : 数値が負で、上昇中。 5レイヤー
Critical Market Session Information with a Single Glance Stop juggling multiple tools and squinting at time zone converters. The SessionInfoDisplay Indicator is your new, indispensable trading co-pilot that puts real-time market intelligence directly on your chart.   What It Does: Your Essential Trading Dashboard   This intelligent indicator provides three critical pieces of information at a glance: 1. Real-Time Session Detection    - Automatically identifies which major financial session is act
FREE
Clr-Dynamic RSI v SMA Indicator: A Comprehensive Analysis of Features and Advantages The Clr-Dynamic RSI v SMA indicator represents a significant evolutionary leap in technical analysis tools, transforming the classic Relative Strength Index (RSI) from a potentially ambiguous oscillator into a sophisticated, multi-dimensional trading system. At its core, this indicator retains the mathematical foundation of the RSI, measuring the speed and change of price movements, but radically enhances its
MTF Candlestick Patterns Detector: 究極のプライスアクション・コマンドセンター 変化の激しいトレードの世界では、たった一つの反転パターンを見逃すことが、利益の出る週とチャンスを逃す週の分かれ目になります。 MTF Candlestick Patterns Detector は、すべての時間足で24種類以上の伝説的なローソク足パターンを同時にスキャン、検出、集計するために設計されたプロ仕様のMQL5インジケーターです。 チャートを闇雲に探し回ったり、推測したりするのはもう終わりにしましょう。アルゴリズムが、高確率なセットアップをあなたの元へ届けます。 トレーダーの優位性:なぜこのインジケーターなのか? 多くのローソク足インジケーターは、遅行データでチャートを埋め尽くしてしまいます。当検出器は、コクピットのような役割を果たす マルチタイムフレーム(MTF)パネル を提供し、最も重要なトレードの疑問に一目で答えます。 トレンド構造はどうなっているか? パネルは「トレンドパターン」(MN1からH4)と「エントリーパターン」(H1からM5)を分けて表示します。
Indicator Overview This is a sophisticated Multi-Timeframe (MTF) indicator that not only applies the classic Fisher Transform formula but integrates it into a comprehensive trading system featuring a real-time dashboard. The indicator excels at pinpointing reversals through advanced divergence detection and providing a clear, multi-timeframe view of market structure.     How It Works: Core Fisher Logic   1.   Normalization and Signal Generation         The indicator transforms price (using med
MTF WAD Simplified Indicator - Professional Trading Solution     Overview The MTF WAD Simplified is a sophisticated multi-timeframe volume-based indicator designed to track smart money flow across financial markets. By monitoring the Williams Accumulation/Distribution (WAD) across 8 different timeframes, this tool provides traders with unprecedented insight into institutional accumulation and distribution patterns.     Core Benefits for Traders     1. Smart Money Tracking - Detect Institutional
RSI v SMA MTF Indicator : Professional Trading Edge in One Tool   Summary The RSI v SMA MTF Indicator is a sophisticated, multi-timeframe momentum analysis tool that transforms the traditional RSI into a powerful, actionable trading system. By combining RSI slope analysis with SMA crossover signals, divergence detection, and real-time multi-timeframe confluence, this indicator provides traders with a more comprehensive view of market momentum across all relevant timeframes.     Core Utility an
MTF Connecting Fractals Multi-Timeframe Market Structure. One Glance. Real Decisions. MTF Connecting Fractals is not just another arrow-printing indicator. It’s a complete multi-timeframe market structure intelligence system designed to answer the most important trading questions in real time - clearly, visually, and without clutter. Built around fractals as objective structure anchors, this tool gives traders a decisive edge by combining price action, structural context, proximity risk, and
Multi-Timeframe Money Flow Index (MTF MFI) with Smart Divergence and Dashboard Unlock the flow of institutional money across every timeframe. Are you tired of guessing the trend only to be trapped by a sudden reversal? The Multi-Timeframe Money Flow Index (MTF MFI) is a professional-grade trading tool designed to provide a bird's-eye view of market liquidity and momentum. By aggregating volume-weighted data from W1 down to M1, this indicator eliminates noise and highlights high-probability tra
MTF Parabolic SAR Maximize your trading efficiency with the Multi-Timeframe Parabolic SAR Trend and Momentum Dashboard. Designed for serious traders who value clarity over clutter, this tool aggregates price action across six timeframes into a single, sleek visual interface.  By combining that reliable classic Parabolic SAR logic with advanced momentum scoring and risk assessment, this indicator transforms raw data into actionable trade signals.  The Strategic Edge: Why This Indicator? Most tra
Multi-Timeframes Heiken Ashi Dashboard : The Trend is your Friend Indeed Confluence Trading System     Transform Your Trading with Crystal-Clear Market Structure Visualization Tired of confusing charts and conflicting signals? The Multi-Timeframe Heiken Ashi Dashboard is your complete solution for professional-grade market analysis. This all-in-one indicator combines smoothed Heiken Ashi candles with an intelligent multi-timeframe panel to give you unprecedented clarity in any market condition
Hybrid BB-LRMA [Trend and Volatility Engine]   Master the markets with the Hybrid BB-LRMA, a professional-grade technical analysis tool that fuses the volatility-tracking power of Bollinger Bands (BB) with the hyper-responsive Linear Regression Moving Average (LRMA) to eliminate lag and pinpoint high-probability entries with arrow Signals   Why Hybrid BB-LRMA? Most moving averages are too slow, and Bollinger Bands alone can be noisy. The Hybrid BB-LRMA solves this by using a gradient-based LRMA
Hybrid FATL Fractal: Professional Digital-Signal Logic   Simplify the Complexity of Market Structure.   Unlock the power of digital signal processing combined with price action geometry. The Hybrid FATL Fractal is a professional-grade technical analysis tool designed to eliminate market noise and pinpoint high-probability institutional turning points. By merging the Fast Adaptive Trend Line (FATL) algorithm with Dynamic Fractal Breakout logic, this indicator provides a dual-layered filter that a
VOLUME PROFILE SAF-XII MT5専用プロフェッショナル・マーケットプロファイル分析ツール(グリッドトレードに最適な「ドリーム・インジケーター」) ボリュームプロファイル(価格帯別出来高)とは? ボリュームプロファイルは、従来の「時間軸」の出来高とは異なり、「特定の価格帯」での取引活動を表示するプロ仕様のツールです。選択した期間内の「どこで」取引が行われたかを可視化し、以下のポイントを特定します: バリューエリア (VAH/VAL) :全取引の大部分が行われた価格帯。 ポイント・オブ・コントロール (POC) :最も出来高が集中した単一の価格水準。 リクイディティ・イムバランス :各価格帯における強気(買い)と弱気(売り)の優劣。 サポレジ(支持・抵抗) :実際の取引活動に基づいた自然な価格水準。 3つの動作モード — 「設定したらあとはお任せ」 VP_MANUAL(スイングトレード・重要ライン分析) 垂直ラインをドラッグして分析範囲を手動で設定。 ラインを動かした時のみ再計算されるため軽量。 用途 :指標発表前分析、決算発表、特定の期間分析。 VP_AUTO(スキ
Fisher Transform MTF Pro v4.03 Professional Multi-Timeframe Trading Decision System Fisher Transform MTF Pro turns complex multi-timeframe data into clear, actionable trade decisions in seconds. It answers instantly:  What’s the trend?  Where’s the entry?  How strong is the setup?  What are the risks?  Should I buy, sell, or wait?  The Edge   Zero-Line Filter (Trend Protection) Prevents counter-trend trades by default:  No buys above zero  No sells below zero This forces alignment with th
Turtles Professional v2.0 The Legendary Turtle Strategy, Reimagined for the Modern Trader Turtles Pro transforms the iconic 1980s Turtle Trading System into a high-performance, multi-timeframe decision engine. It eliminates guesswork by providing institutional-grade analysis on trend structure, entry quality, and volatility all on a single chart. The Strategic Edge Turtles Professional uses a Smart Weighted Bias Engine to prioritize higher time frames, ensuring your trades align with the d
Hybrid Hull-LSMA : The Trend Meets Momentum Powerhouse Are you struggling with moving averages that are either too slow to react or too noisy to trust? The Hybrid Hull-LSMA is a solution, engineered to solve the "lag vs. noise" dilemma. By fusing the ultra-smooth Hull Moving Average (HMA) with the predictive Least Squares Moving Average (LSMA), this indicator delivers a high-definition view of market structure and entry timing. Why the Hybrid Hull-LSMA? Standard indicators follow the market; t
Divergent Fisher Transform MT5  Precision Momentum. Intelligent Filtering. EA-Ready Automation. The Divergent Fisher Transform for MT5 is a professional-grade momentum trading indicator designed to help traders answer the most important question in the market: “What should I do right now?” It transforms raw price into high-probability, structured trading decisions using a powerful combination of:  Fisher Transform momentum modeling  Zero-line structural filtering  Multi-level overbought/o
Divergent Stochastic Filter II Catch Reversals Early, Filter Noise, Trade with Confidence The Edge: Why This Stochastic is Different  Every trader knows the Stochastic oscillator. But knowing when to trust its signals, that's the real challenge. The Divergent Stochastic Filter II transforms this classic indicator into a precision reversal detection system by adding critical elements: divergence intelligence, signal filtering and exhaustion detection.  While standard Stochastic oscillators fire s
X-Hybrid Modular Z – 実行インテリジェンス・プラットフォーム あらゆるインジケーターを完全自動売買システムへ X-Hybrid Modular Zは、設計されたカスタムインジケーターを完全な自動売買システムへと変換するモジュール式実行エンジンです。 プロレベルの執行(エグゼキューション)とリスク管理を求めるトレーダーのために設計されており、プログラミング不要で、シグナル発生から機関投資家レベルの取引管理までのギャップを埋めることができます。 このEA(エキスパートアドバイザー)が選ばれる理由 従来のEAとは異なり、単なる「シグナル読み取り機」ではありません。 X-Hybrid Modular Zは、執行プロセスを高度に把握するトレーディング・フレームワークであり、以下の機能を備えています。 適応型スリッページ制御 (ATRおよびスプレッドを考慮) ブローカー挙動プロファイリング (自己学習型執行調整) リトライベースの執行エンジン エントリー間隔フィルター (視覚的なギャップゾーン表示、表示のON/OFF切り替え可能) ブローカー制限レベルの動的検出 (ストップレ
Cumulative Volume Delta (CVD) MA-X Plus:究極のオーダーフロー・フレームワーク CVD MA-X Plus で、市場の隠されたメカニズムを解き明かしましょう。標準的なボリューム指標は「どれだけ取引されたか」を伝えるだけですが、CVD MA-X Plusは、 誰が 戦いに勝っているのか、 いつ 勝っているのか、そして「 スマートマネー 」が どこに 定着しているのかを明らかにします。ティックレベルのプライスアクション(株式/先物/ゴールドなどの規制市場ではリアルボリュームに設定可能)と多層的なボリューム分布を集計することで、このインジケーターは市場の確信、枯渇、そして流動性の極めて鮮明なマップを提供します。これは、こちら( https://www.mql5.com/en/market/product/162375?source=Site+Profile+Seller )にあるCVD MA-Xの進化版です。 トレーダーの優位性:なぜPlus版にアップグレードするのか? 多くのトレーダーが失敗するのは、遅行するプライスアクションに反応してしまうからです。
Hybrid FATL-LRMA : Digital Precision Meets Statistical Certainty The Ultimate Trend-Momentum Convergence System with clear action protocols. Why Hybrid FATL-LRMA? The Edge some Traders Miss Are you tired of lagging indicators that signal entries after the move has already happened? Frustrated by noisy oscillators that keep you in chop while trends pass you by? The Hybrid FATL-LRMA is a dual-engine trading system that bridges the gap between high-frequency digital signal processing and stat
ADX ClrDynamic: The Gradient-Aware, Low-Lag Trend and Momentum ADX/DMI Evolution Tired of lagging indicators that signal a trend only after the move is over? Most ADX indicators are too slow for modern markets. ADX Gradient-Aware solves this by fusing Hull-style low-lag smoothing with a unique Gradient Momentum Logic. This isn't just an indicator; it's a complete decision-engine that identifies trend structure, measures strength, and pinpoints high-probability entries using dual-slope detection.
ADX ClrDynamic  MTF Dashboard: The Ultimate Multi-Timeframe Trend and Momentum Command Center Tired of switching between timeframes to get the full market picture? Most ADX indicators show you only one timeframe at a time, forcing you to piece together the puzzle manually.   ADX ClrDynamic MTF indicator   changes everything by displaying up to 8 timeframes simultaneously in a single, elegant dashboard. This isn't just an indicator; it's your complete multi-timeframe decision-engine that identifi
SERA - Sigma-Enhanced Regression Analysis – The Non-Repaint, Early-Entry MTF Trading System The Problem with Most Regression Tools (And How We Solved It) Traditional regression indicators lie to you. They repaint, they lag, and distort actionable data. Their flaws cost you in false back-tests, late entries/exits and therefore missed profits. Avoid catching a falling knife or chasing a train with SERA, she eliminates ALL three problems. One-Click Trading Style Selection – Choose Conservative, R
合理化された「三色バンド・ロジック (Tri-Color Band Logic)」は、スクイーズ(保合い)検出機能を維持しつつ、プライスアクションの可視性を最優先した設計になっています。 1. 哲学の切り替え:スタイルに合わせたトレード SignalMode 設定により、インジケーターがバンドへのタッチをどのように解釈するかを選択できます。これはあなたの「トレードの性格」に合わせた設定です。 価格が...にタッチした時 ブレイクアウトモード (トレンドフォロー) バウンスモード (逆張り・リバーサル) 自動モード (状況判断) アッパーバンド 買い – 「勢いが加速している、波に乗れ!」 売り – 「価格が伸びきった、逆張りの好機だ!」 価格次第:上で確定=買い / 内側で確定=売り ロワーバンド 売り – 「下落の勢いが強い、飛び乗れ!」 買い – 「売られすぎの反発が来るぞ!」 価格次第:下で確定=売り / 内側で確定=買い SignalMode パラメータは、インジケーターの「思考回路」として機能し、外側バンド(バッファ8および9)との相互作用をどのよう
フィルタ:
レビューなし
レビューに返信