Proton Market Range MT5

Proton Market Range MT5


OVERVIEW

Proton Market Range MT5 is an indicator for MetaTrader 5 that displays real-time spread information and daily price range data. The indicator shows current bid-ask spread and tracks how much price has moved from daily open to current price. This tool is designed for traders who need to monitor spread conditions and market volatility.


PRIMARY FUNCTION

The indicator displays current market spread and daily range metrics in a dashboard format on the chart. It updates in real-time as market conditions change. Traders can use this information to assess trading conditions and market volatility at any moment.


METRICS DISPLAYED


Current Bid-Ask Spread:

The current spread is the difference between bid price (sell price) and ask price (buy price). Spread is measured in pips or points depending on the symbol. The indicator displays current spread in real-time and updates as market conditions change.


Daily High Price:

Shows the highest price reached for the current symbol during the trading day. This value resets at market open time for the symbol being monitored.


Daily Low Price:

Shows the lowest price reached for the current symbol during the trading day. This value resets at market open time for the symbol being monitored.


Daily Range:

Calculated as the difference between daily high and daily low. Expressed in pips. This represents total volatility for the day so far.


Daily Range Percentage:

Shows daily range as a percentage of the entry price. Indicates volatility as a relative percentage.


Session Status:

Indicates which trading session is currently active (Asian, London, New York, etc.). Different sessions typically have different spread characteristics.


UNDERSTANDING SPREAD


What is Spread:

Spread is the cost of trading. Every time you enter a trade, you pay the spread cost. A 1 pip spread costs 10 on standard lots. A 2 pip spread costs 20 on standard lots.


Spread Variations:

Spreads vary based on:

- Market volatility (wider during high volatility)

- Trading session (wider during off-hours)

- Liquidity (wider during low liquidity periods)

- Economic announcements (much wider during news)

- Time of day (varies by market opening/closing)


Spread Impact:

A trade needs to move more than the spread amount just to break even. A 1 pip spread requires price to move 1 pip in your direction just to recover the spread cost.


Why Monitor Spread:

For scalpers, spread is critical. A 2 pip spread scalp has a higher break-even requirement than 1 pip spread. Monitoring spread helps avoid trading during wide-spread periods.


TECHNICAL SPECIFICATIONS


Data Provided:


Spread Display:

Current bid-ask spread measured in points. On most symbols displayed in pips (1 point = 0.0001 on 4-digit quotes).


Daily High/Low:

Highest and lowest prices reached today. Values update in real-time as new extremes are reached.


Daily Range:

Calculated from high minus low. Refreshes throughout the day as volatility changes.


Session Identification:

Automatically identifies current trading session based on server time.


Display:

- Dashboard-style indicator panel on chart

- Real-time updates every tick

- Color coding for spread levels (tight vs wide)

- Customizable panel position on chart


Compatibility:

- Works with all currency pairs

- Works with all commodities (especially gold)

- Works with all indices

- Works with all trading instruments

- Works on any chart timeframe


Installation:

1. Download the file to your computer

2. Copy file to MetaTrader 5 installation folder: MQL5/Indicators/

3. Restart MetaTrader 5 platform

4. Open any chart in MetaTrader 5

5. Insert menu > Indicators > Proton Market Range

6. Indicator will attach to chart

7. Current spread and range will immediately display


Configuration:

- Default settings provide immediate functionality

- Optional: Customize color scheme for spread levels

- Optional: Adjust display position on chart

- Optional: Change font size for visibility


HOW TO USE


Monitoring Spread Conditions:

Check spread before opening trades. Compare current spread to historical spread for the same symbol and time. If spread is unusually wide, consider waiting for tighter conditions.


Day Trading Spread Analysis:

For day traders, monitor how spread changes throughout the day. Spreads are typically tightest during major market overlap hours. Spreads are typically widest during off-hours and low-liquidity periods.


Scalping Spread Assessment:

For scalpers, wide spreads make scalping unprofitable. Use the indicator to identify periods when spreads are tight enough for your scalping strategy. Avoid scalping during news events when spreads widen significantly.


Daily Range Monitoring:

Track daily range to understand market volatility. A 100 pip daily range indicates higher volatility than a 50 pip daily range. Use this information to adjust position sizing and take profit distances.


Session-Based Trading:

Different trading sessions have different spread characteristics. Use the session indicator to understand which session you are trading during. Adjust trading strategy based on session-specific volatility and spread conditions.


Risk Management Adjustment:

On days with very wide spreads, consider reducing position size or increasing take profit targets to account for additional spread cost. On days with tight spreads, normal position sizing and targets are appropriate.


SPREAD LEVELS EXPLAINED


Tight Spread (0.5 - 1.5 pips):

Indicates tight market conditions. Spread is at favorable levels for traders. Good time for both scalpers and day traders to trade.


Normal Spread (1.5 - 3.0 pips):

Indicates normal market conditions. Spread is moderate. Suitable for most trading strategies.


Wide Spread (3.0 - 5.0 pips):

Indicates wider than normal conditions. May indicate lower liquidity period or early news impacts. Scalpers should consider reducing size.


Very Wide Spread (5.0+ pips):

Indicates very wide market conditions. Typical during economic news or major market events. Most traders reduce size or exit trades. Scalping becomes unviable.


IMPORTANT NOTES


Spread Characteristics:

- Spreads vary significantly by symbol class

- Forex spreads typically 0.5-3 pips

- Gold spreads typically 0.5-2 pips

- Index spreads typically 1-5 pips

- Different brokers have different spreads

- Your spread may be wider or tighter than other traders


Time-Based Variations:

- Spreads tightest during major market overlap (London/New York)

- Spreads widen during off-hours trading

- Asian session typically has wider spreads than European session

- Night hours typically have widest spreads


Economic News Impact:

- Major economic announcements cause spread spikes

- High impact news creates very wide spreads temporarily

- Spreads may take 5-30 minutes to normalize after news

- Consider avoiding trades during scheduled news events


Broker Differences:

- ECN brokers may have different spread patterns than market makers

- Some brokers add commissions instead of wider spreads

- Different broker types may have very different spreads

- Always check your specific broker's spread conditions


Daily Range Interpretation:

- High daily range indicates volatile day

- Low daily range indicates calm day

- Use range to set realistic take profit targets

- Don't expect 100+ pip moves if daily range is 60 pips


Testing Recommendations:

- Test on multiple symbols to understand spread patterns

- Compare your spreads to other brokers (for reference)

- Track spread at different times of day

- Monitor spread before and during news events

- Document spread patterns for your trading times


Disclaimer:

This indicator displays spread and range information based on your broker's data. Spread values displayed are specific to your broker and account type. Different brokers and account types have different spreads. Spread information is provided for informational purposes only. The developer is not responsible for discrepancies between displayed spreads and actual spreads. Always verify spread information with your broker directly for critical trading decisions.

おすすめのプロダクト
Expasion Limits
Danny Giovanni Romero Lozano
Expansion Limits  Expansion Limits is a powerful multi-timeframe indicator that automatically draws dynamic support, resistance, and expansion levels based on higher timeframe price action. How It Works The indicator takes the high and low from a selected higher timeframe (default H4) and calculates 11 strategic levels: HTF High – The high price from the higher timeframe HTF Median – The exact midpoint between high and low HTF Low – The low price from the higher timeframe 4 Upper Expansio
FREE
FX Clock
Abderrahmane Benali
FXClock – Professional Clock Indicator for Traders Please leave a 5 star rating if you like this free tool! Thank you so much :) The FXClock indicator is a practical and simple tool that displays time directly on your trading platform, allowing you to track multiple key pieces of information at the same time. It is specially designed to help traders synchronize their trading with market hours and global sessions. Key Features: Displays the broker server time with precision. Displays your local c
FREE
My other indicators: https://www.mql5.com/en/market/product/156702   (FREE) https://www.mql5.com/en/market/product/153968 (FREE) https://www.mql5.com/en/market/product/153960 (FREE) This indicator displays higher timeframe candles directly on your lower timeframe chart, allowing you to monitor higher timeframe price action without switching between charts. It also plots session highs and lows for the Asia, London, and New York kill zones, giving you key liquidity levels directly on your chart.
FREE
This Mt5 Indicator Signals when there is two opposite direction bars engulfed by current bar.  has a recent Exponential Moving Average Cross and past bar was oversold/bought Expert Advisor Available in Comments  Free Version Here : https://www.mql5.com/en/market/product/110114?source=Site&nbsp ; Full Alerts for mt5 terminal , phone , email, print to file, print to journal  Buy Signal ( blue line ) Past ema cross ( set at 30 bars back ) Past bar rsi is oversold ( level 40  ) Engulfing bar closes
FREE
ST Pure Path Indicator Description for Metatrader ST Pure Path Indicator Description for Metatrader This document aims to provide a clear and accessible description of the ST Pure Path indicator, developed for the Metatrader platform. It is designed to assist traders, especially those with little experience, in identifying market trends and decision points visually and intuitively. 1. Visual Identification The ST Pure Path appears on the chart as a continuous, solid line , with a thickness of 2
FREE
Candle Number Indicator for MetaTrader 5 The Candle Number Indicator displays a numeric label on each candlestick, starting from the most recent bar. This tool assists traders in visually tracking candle progression, which may support strategies based on time, structure, or pattern identification. Features: Numbers each candle from the current bar backward Allows custom color, horizontal or vertical text orientation, and label offset Option to limit display to recent candles (e.g., last 10 bar
FREE
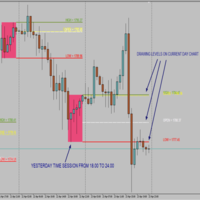
Time Session OPEN-HIGH-LOW-CLOSE This Indicator Will Draw Lines Of OHLC Levels Of Time Session Defined By User. It Will Plot Floating Lines On Current Day Chart. Time Session Can Of Current Day Or Previous Day. You Can Plot Multiple Session Lines By Giving Unique ID To Each Session. It Can Even Show Historical Levels Of Time Session Selected By User On Chart To Do Backdating Test. You Can Write Text To Describe The Lines.
FREE
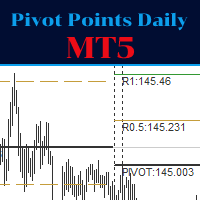
The Indicator show Daily Pivot Points. It is possible to specify the number of days to display. For forex it doesn't consider the sunday session data. It is possibile to modify the color, style and  width for every level. It is better to use this indicator with timeframe not higher than Н1. 4 Levels of support and resistance with also Intermediate Levels that is possible to hide.
FREE
デュアルラインシグナル、三重レベルシステム、マルチタイムフレームサポート、カスタマイズ可能なビジュアルシグナル、高度に設定可能なアラートシステムを備えた高度なStochastic RSIオシレーター。 フリーランスプログラミングサービス、アップデート、その他のTrueTL製品は私の MQL5プロフィール でご利用いただけます。 フィードバックとレビューをお待ちしております! Stochastic RSIとは? Stochastic RSI(StochRSI)は、価格データの代わりにRSI値にストキャスティクスオシレーターの計算式を適用したモメンタムインジケーターです。特定の期間における高値-安値レンジに対するRSIのレベルを測定し、0と100の間で振動するより感度の高いインジケーターを生成します。 StochRSIは2本のラインで構成されます:%K(メインライン)と%D(シグナルライン、%KのMAです)。このインジケーターは、RSI自体の中の買われすぎ・売られすぎ状態を識別するのに特に有用で、従来のRSIやストキャスティクスインジケーターよりも早いシグナルを提供します。%Kと%D
FREE
Spread Viewer
Aurelio Miguel Machado Da Silva
FREE
RangeXpert
Steve Rosenstock
5 (19)
すべての無料商品を見るにはここをクリック 完璧なマーケットチャンスを見極め、正確にブレイクアウトを取引するために、 RangeXpert は市場で最も 効果的なツールの1つ です。初心者やセミプロ向けに特別に開発されており、通常は 銀行、機関投資家、ヘッジファンドが使用するプロフェッショナルツール でしか見られない分析品質を提供します。 このインジケーターは、強い値動きにつながりやすいマーケットゾーンを特定し、それらを非常に明確かつ直感的に表示するため、複雑な構造でも瞬時に視覚化できます。 RangeXpert は誤った判断を減らし、タイミングを改善し、レンジが終わり本物のトレンドが始まる瞬間をリアルタイムで示します。 ボラティリティへの動的な適応、複数ポジションの強さ、利益のインテリジェントな分配によって、これは現在トレーダーが使用する 最も強力なブレイクアウトインジケーターの1つ となっています。 仕様 完璧なエントリーゾーン  完全に最適化されたチャートビュー  視認性の高いテイクプロフィットとストップロスライン シグナル最適化されたトレーリングストップ (pips 表示付
FREE
QuantumAlert Stoch Navigator is a free indicator available for MT4/MT5 platforms, its work is to provide "alerts" when the market is inside "overbought and oversold" regions in the form of "buy or sell" signals. This indicator comes with many customization options mentioned in the parameter section below, user can customise these parameters as needful. Join our   MQL5 group , where we share important news and updates. You are also welcome to join our private channel as well, contact me for the p
FREE
Are you tired of drawing trendlines every time you're analyzing charts? Or perhaps you would like more consistency in your technical analysis. Then this is for you. This indicator will draw trend lines automatically when dropped on a chart. How it works Works similar to standard deviation channel found on mt4 and mt5. It has 2 parameters: 1. Starting Bar 2. Number of bars for calculation The   starting bar   is the bar which drawing of the trend lines will begin, while the   number of bars for c
FREE
マルチタイムフレーム対応、カスタマイズ可能なビジュアルシグナル、設定可能なアラートシステムを備えたAverage True Range(ATR)インジケーター。 フリーランスプログラミングサービス、アップデート、その他のTrueTL製品は私の MQL5プロフィール でご覧いただけます。 フィードバックとレビューを大変お待ちしております! ATRとは? Average True Range(ATR)は、J. Welles Wilderが開発した市場のボラティリティを測定するテクニカルインジケーターです。指定した期間のTrue Rangeの平均を計算します。True Rangeは以下の中で最大の値です:現在の高値から現在の安値までの距離、前回の終値から現在の高値までの距離、または前回の終値から現在の安値までの距離。 ATRは価格方向を示しません — ボラティリティのみを測定します。ATRが上昇するとボラティリティの増加を示し、ATRが低下するとボラティリティの減少を示します。トレーダーはATRを使用して市場状況を評価し、動的なストップロスを設定し(例:ATRベースのトレーリングストッ
FREE
Hi everyone, THV Unmitigated FVGs (Fair Value Gaps) Indicator automatically detects and highlights market imbalances based on the ICT/SMC concept. Unmitigated bullish and bearish FVGs are plotted in real time, with customizable colors, zone extension, and optional alerts. Fully mitigated gaps are automatically removed to keep your chart clean and focused on valid trading opportunities. The indicator also displays the Previous Day High (PDH) and Previous Day Low (PDL) as key liquidity levels Simp
FREE
TSV Timer
Joao Victor De Sousa
Overview Time Candle is a MetaTrader 5 indicator that displays a countdown timer on the chart, positioned to the right of the current candle at the bid price level. The timer relies on the trading server clock and continues updating even when no new ticks are received. Features Time Counter Displays the time remaining until the current candle closes. Updates every 500 milliseconds regardless of market activity. Compatible with all timeframes from M1 to MN. Shown in MM:SS format for intervals un
FREE
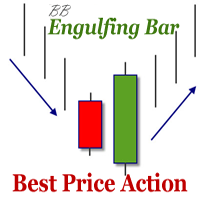
The indicator defines the Bullish and Bearish Engulfing Bar. The pattern has greater reliability when the open price of the engulfing candle is well above the close of the first candle, and when the close of the engulfing candle is well below the open of the first candle. For an engulfing bar to be valid it must fully engulf at least one previous bar or candle - includes all the body and the wick. The engulfing bar can engulf more than one bar as long as it completely engulfs the previous bar.
FREE
Get ALERTS for break of your TRENDLINES, SUPPORT LINES, RESISTANCE LINE, ANY LINE!! 1. Draw a line on the chart (Trend, support, resistance, whatever you like) and give it a name (e.g. MY EURUSD line) 2. Load the Indicator and input the Line Name the same name in Indicator INPUT so system knows the name of your line (= MY EURUSD line) 3. Get Alerts when Price breaks the line and closes Works on All Time frames and charts LEAVE A COMMENT AND IF THERE IS ENOUGH INTEREST I WILL WRITE AN EA WHICH W
FREE
FlatBreakout MT5 (Free Version) Flat Range Detector and Breakout Panel for MT5 — GBPUSD Only FlatBreakout MT5   is the free version of the professional FlatBreakoutPro MT5 indicator, specially designed for flat (range) detection and breakout signals on the   GBPUSD   pair only. Perfect for traders who want to experience the unique fractal logic of FlatBreakout MT5 and test breakout signals on a live market without limitations. Who Is This Product For? For traders who prefer to trade breakout of
FREE
️ FWS Storm Watch — Economic News Radar & Storm Warning System Never get blindsided by news again. Storm Watch monitors the MT5 Economic Calendar in real time, filters upcoming events by currency and impact level, calculates a weather-style severity rating, and alerts you before high-impact releases. All from a compact on-chart panel with a stunning browser-based web dashboard. Part of the Forex Weather Station suite. Uses MT5's built-in calendar. What It Shows Severity Rating — Weather-styl
FREE
概要 このインジケーターは、クラシックな ドンチャンチャネル を強化したバージョンで、実践的なトレード機能を追加しています。 標準の3本線(上限、下限、中央線)に加え、 ブレイクアウト を検出し、チャート上に矢印で視覚的に表示します。また、チャートを見やすくするために、 現在のトレンド方向と逆側のラインのみを表示 します。 インジケーターの機能: 視覚的シグナル :ブレイクアウト時にカラフルな矢印を表示 自動通知 :ポップアップ、プッシュ通知、Eメール RSIフィルター :市場の相対的な強弱に基づいてシグナルを検証 カスタマイズ可能 :色、ラインの太さ、矢印コード、RSI閾値など 動作原理 ドンチャンチャネルは次のように計算します: 上限線 :直近N本のクローズ済みローソク足の最高値 下限線 :直近N本のクローズ済みローソク足の最安値 中央線 :最高値と最安値の平均値 上方ブレイクアウト は終値が上限線を超えたときに発生し、 下方ブレイクアウト は終値が下限線を下回ったときに発生します。 インジケーターは以下を行います: 3本のドンチャンラインを描画 方向転換後の最初のブレイクアウト
FREE
Main purpose:   "Pin Bars"   is designed to automatically detect pin bars on financial market charts. A pin bar is a candle with a characteristic body and a long tail, which can signal a trend reversal or correction. How it works:   The indicator analyzes each candle on the chart, determining the size of the body, tail and nose of the candle. When a pin bar corresponding to predefined parameters is detected, the indicator marks it on the chart with an up or down arrow, depending on the directi
FREE
マルチタイムフレーム対応、カスタマイズ可能なビジュアルシグナル、設定可能なアラートシステムを備えたRate of Change(ROC)インジケーター。 フリーランスのプログラミングサービス、アップデート、その他のTrueTL製品は MQL5プロフィール でご利用いただけます。 フィードバックとレビューを大変感謝いたします! ROCとは? Rate of Change(ROC)は、指定した期間における価格の変化率をパーセンテージで測るモメンタムオシレーターです。現在の価格をn期間前の価格と比較し、差をパーセンテージで表示することで、価格動向の速度を容易に把握できます。 正のROC値は上昇モメンタムを、負の値は下降モメンタムを示します。ROCが零線をクロスすると、トレンド転換の可能性を示します。トレーダーはROCを使って買われすぎ・売られすぎの状態を識別し、トレンドを確認し、価格とモメンタムの乖離を発見します。 機能: 矢印と垂直線によるビジュアルシグナルマーカー 設定可能なトリガーを持つ3つの独立したシグナルバッファ シグナル検出オプション:方向転換、レベルクロス、ピーク/バレー
FREE
This indicator is very useful for day traders or short term traders. (MT5 version) No need to calculate the number of pips manually, just look at the chart and you will see the Virtual Take Profit / Virtual Stop Loss target line and evaluate whether the entry point is feasible to reach the intended target or not. Enter the intended   Take Profit / Stop Loss   pips for your trade. The indicator will display   Virtual Take Profit / Virtual Stop Loss   lines for you to easily see if the target is
FREE
Daily Time Lines Indicator for MT5 Daily Time Lines is a simple and powerful chart tool for MetaTrader 5 that automatically draws vertical and horizontal lines at a specific time each day. Perfect for marking session opens, key levels, or important trading moments directly on your chart. Main Features Automatic daily vertical line at a selected time Optional horizontal line starting from the same point Horizontal line can end: At the end of the day Or extend for a customizable number of future d
FREE
マルチタイムフレーム対応、カスタマイズ可能なビジュアルシグナル、設定可能なアラートシステムを備えたBalance of Power(BOP)インジケーター。 フリーランスプログラミングサービス、アップデート、その他のTrueTL製品は私の MQL5プロフィール からご利用いただけます。 フィードバックとレビューを大歓迎します! BOPとは? Balance of Power(BOP)は、価格の変化をバーの値幅と比較することで、買い手と売り手の強さを測定するオシレーターです。インジケーターは(終値 - 始値)/(高値 - 安値)として計算され、その後Simple Moving Average(SMA)で平滑化されます。 BOP値は-1から+1の間で変動します。正の値は買い手が強いことを示し(終値が始値より高い)、負の値は売り手が強いことを示します(終値が始値より低い)。値の大きさは動きの強さを示します。BOPは買い圧力と売り圧力のバランスを示すことで、市場の強さと潜在的な反転を識別するのに役立ちます。 特徴: 矢印と垂直線によるビジュアルシグナルマーカー 設定可能なトリガーを持つ3
FREE
VolumeBasedColorsBars — Free Powerful Volume Analysis for All Traders Unlock the hidden story behind every price bar! VolumeBasedColorsBars is a professional-grade, 100% FREE indicator that colorizes your chart candles based on real, adaptive volume analysis. Instantly spot surges in market activity, identify exhaustion, and catch the moves that matter. This indicator gives you:    • Dynamic color-coded bars for instant volume context    • Adaptive thresholds based on historical, session-awar
FREE
My Big Bars MT5
Evgeniy Scherbina
4.54 (13)
The indicator My Big Bars can show bars (candles) of a higher timeframe. If you open an H1 (1 hour) chart, the indicator puts underneath a chart of H3, H4, H6 and so on. The following higher timeframes can be applied: M3, M5, M10, M15, M30, H1, H3, H4, H6, H8, H12, D1, W1 and MN. The indicator chooses only those higher timeframes which are multiple of the current timeframe. If you open an M2 chart (2 minutes), the higher timeframes exclude M3, M5 and M15. There are 2 handy buttons in the lower r
FREE
RBM Volume Real 2
Renato Brendim Medici
5 (2)
O RBM Volume Real foi desenvolvido para transformar volume em informação útil para tomada de decisão. Em vez de observar apenas a movimentação do preço, o indicador permite identificar quem está dominando o mercado em determinado momento: compradores ou vendedores. O primeiro dado apresentado é o volume de Compras, que representa a agressão dos participantes que aceitaram pagar o preço pedido para entrar no mercado. Já o volume de Vendas mostra a agressão daqueles que aceitaram vender ao preço
FREE
The Choppery notifier is an indicator that has been developed and tested for the purpose of alerting you that a candle is about to form, it takes away the trouble of having to play a guessing game as to when next a candle will form after a trend, therefore most of the time it eliminates the thought of having to predict which direction price will begin to move at. This indicator can be used in any timeframe, a notification will be sent out to you via email when price moves. you can start at a min
FREE
このプロダクトを購入した人は以下も購入しています
この製品は 2026 年の市場向けに更新され、最新の MT5 ビルドに最適化されています。 価格更新のお知らせ: Smart Trend Trading System は現在 $99 で提供されています。 次の 30 件の購入 後、価格は $199 に上がります。 特別オファー: Smart Trend Trading System を購入後、私にプライベートメッセージを送ることで、 Smart Universal EA を無料 で受け取り、Smart Trend のシグナルを自動売買に変えることができます。 Smart Trend Trading System は、リペイントなし、再描画なし、遅延なしの完全なトレーディングシステムです。よりクリーンなシグナル、より明確なトレンド方向、そしてより整理された取引方法を求めるトレーダー向けに作られています。 Online course , manual and [download presets] . このシステムは、トレンド検出、反転ゾーン、Smart Cloud、トレーリングストップロジック、サポートとレジスタンス、ローソク足の色分け
Neuro Poseidon is a new indicator by Daria Rezueva. It combines precise trading signals with adaptive TP/SL levels - creating best possible trades as a result! Message me and get  Neuro Poseidon Assistant  as a gift to automize your trading process! What makes it stand out? 1. Proven profitability on all assets and timeframes 2. Only confirmed BUY and SELL signals present on the chart 3. Adaptive TP & SL levels generated by the software for each trade 4. Easy to understand - suitable for al
開発者からのお知らせ: 価格は 2026年7月13日 に 169米ドル へ値上げされます。 M1 Quantum を使用したライブトレードシグナル : シグナル (取引は 自動的に Quantum Trade Assistant によって実行され、この製品に 無料 で含まれています。) 価格プラン: 現在価格: $149 (早期購入者向けオファー) 次回予定価格: $169 予定小売価格: $299 開発者からのお知らせ: ご購入後、 最新の推奨設定ファイル(Set File) 、運用アドバイス、および他の M1 Quantum ユーザーと交流できる VIPサポートグループ への招待をご希望の場合は、お気軽にご連絡ください。 M1 Quantum は、M1専用のプロフェッショナルトレーディングシステムであり、ストップロス、テイクプロフィット、スマートな資金管理を内蔵した、迅速かつ正確な取引シグナルを提供します。 M1 Quantum は、 連続勝利 に重点を置いて口座を素早く成長させるために設計されたプロフェッショナルな資金管理を備えています。 M1 Quantum インジケーター
SuperScalp Pro
Van Minh Nguyen
4.69 (29)
SuperScalp Pro – プロフェッショナル多層コンフルエンス・スキャルピングシステム SuperScalp Pro は、複数のコンフルエンスを組み合わせたプロフェッショナル向けスキャルピングシステムです。より高い確率のトレードチャンスを見つけられるよう設計されており、明確なエントリー確認、ATRに基づくStop LossとTake Profit、さらにXAUUSD、BTCUSD、主要なFX通貨ペアに対応した柔軟なシグナルフィルター機能を提供します。 完全なドキュメントは製品ブログにあります: [User Guide] SuperScalp Pro Auto Trader EA による自動売買が利用可能です: [Auto Trader] SuperScalp Proの取引ロジックを基に開発されたゴールド専用自動スキャルピングEA:   [SuperScalp Gold] SuperScalp Pro は、Supertrend、VWAP、EMA、RSI、ADX、出来高分析、ボリンジャーバンド、MACDダイバージェンスを組み合わせ、低品質なトレードセットアップをフィルタリングし
まず正直に言いましょう。 どんなインジケーターも、それ単体であなたを利益化させることはできません。もしそう言う人がいるなら、それは夢を売っているだけです。完璧な売買シグナル(矢印)を表示するインジケーターは、いくらでも“完璧に見せる”ことができます。正しい過去の区間を拡大して、勝ちトレードだけを切り取ればいいだけです。私たちはそれをしません。 SMC Intraday Formula はツールです。 市場構造を読み取り、最も高い確率の価格ゾーンを特定し、今この瞬間のスマートマネーの痕跡をシンプルな言葉で正確に示します。最終判断はあなたが行います。トレードを実行するのもあなたです。しかし今は「希望」ではなく「精度」でエントリーできます。 私たちはこのインジケーターを、ゴールド(XAUUSD)および主要FX通貨ペアで約3年間、日々のスキャルピングに使用してきました。M1、M5、M15、M30の主要ツールです。これは未来を予測しようとするのではなく、今まさに形成されている高確率セットアップを示し、その理由を説明します。 他のすべてのインジケーターと何が違うのか? ほとんどのトレーディングイ
Gold Entry Sniper – ゴールドスキャルピング&スイングトレード用プロフェッショナル多時間足ATRダッシュボード Gold Entry Sniper は、XAUUSDや他の銘柄向けに正確な 売買シグナル を提供する、MetaTrader 5用の高度なインジケーターです。 ATRトレーリングストップロジック と 多時間足分析ダッシュボード を搭載し、スキャルピングからスイングトレードまで対応します。 主な特徴と利点 多時間足シグナル分析 – M1、M5、M15 のトレンドを同時表示。 ATRベースのトレーリングストップ – ボラティリティに応じて動的に調整。 プロ仕様のチャートダッシュボード – シグナル状況、ATRレベル、回帰線、売買方向を表示。 明確な売買マーカー – 自動矢印とテキストラベル。 エグジットアラートとトレード管理 – 利益確定のための自動検出。 完全カスタマイズ可能 – パネル位置、色、フォント、ATR/回帰設定を調整可能。 ゴールド(XAUUSD)に最適化 – M1〜M15のスキャルピングに最適、FXや指数、暗号資産にも対応。 Gold Entry
Entry In The Zone and SMC Multi Timeframe is a real-time 2-in-1 market analysis tool that combines SMC market structure analysis and a No Repaint BUY / SELL signal system into a single indicator, built on Smart Money Concepts (SMC) — a widely adopted framework used by professional traders to understand market structure. This indicator helps you see the market more clearly, make decisions based on structure rather than guesswork, and focus on high-probability zones where price is more likely to r
Trend Sniper X
Sarvarbek Abduvoxobov
5 (5)
Trend Sniper X は、MetaTrader 5 用のマルチタイムフレーム・トレンドフォロー・インジケーターです。トレーダーがトレンドの方向性と反転ポイントを明確かつ正確に特定できるよう支援します。 価格情報: 現在の価格はキャンペーン価格であり、今後のアップデートや新機能のリリースに伴い変更される可能性があります。 Code2Profit チャンネル マルチタイムフレーム分析で市場をマスターしよう! 技術仕様 プラットフォーム MetaTrader 5 インジケータータイプ マルチタイムフレーム・トレンドインジケーター 操作タイムフレーム あらゆるチャートタイムフレームに対応。個別に選択可能な上位タイムフレーム (M1–MN1) を搭載 主要銘柄 FX、ゴールド (XAUUSD)、およびその他のCFD 推奨口座 あらゆる口座タイプに対応 視覚化 色分けされたトレンドローソク足 (買い/売り/弱気/変化) + 買い/売り矢印 追加モジュール セッション市場ボックス (シドニー、東京、ロンドン、ニューヨーク) 主な機能 マルチタイムフレーム・トレンド分析: 上位タイムフレームの
Power Candles V3 - 自己最適化型強弱インジケーター Power Candles V3は 、通貨や銘柄の強さを、適用されたすべてのチャート上で実行可能なトレードプランに変換します。単にローソク足を色分けするだけでなく、バックグラウンドでリアルタイムの自動最適化を実行し、目の前の銘柄に対して最適なストップロス、テイクプロフィット、およびシグナルの閾値を提示します。ワンクリックで実取引に適用でき、エントリーポイント、ストップロス、テイクプロフィットのラインが正確な価格位置にチャート上に表示され、方向性を示すアラートがリアルタイムで発動します。 このツールは、Stein Investmentsのエコシステムの一部です。  18種類以上のツールをすべて閲覧し、AIを活用したセットアップの推奨事項を入手し、  https://stein.investments でコミュニティに参加しましょう クローズしたバーごとに3,000回以上のトレードシミュレーション。9つの強さの状態。2つの戦略を並行してテスト。勝率の高い設定をワンクリックで適用。 なぜこれが必要なのか ほとんどの強
この製品は 2026 年の市場向けに更新され、最新の MT5 ビルドに最適化されています。 価格更新のお知らせ: Atomic Analyst は現在 $99 で提供されています。 次の 30 件の購入 後、価格は $199 に上がります。 特別オファー: Atomic Analyst を購入後、私にプライベートメッセージを送ることで、 Smart Universal EA を無料 で受け取り、Atomic Analyst のシグナルを自動売買に変えることができます。 Atomic Analyst は、リペイントなし、再描画なし、遅延なしの Price Action トレーディングインジケーターで、手動取引、シグナルの明確化、EA 自動化のために設計されています。 User manual: settings, inputs and strategy.   &   User Manual PDF . 価格行動、強さ、モメンタム、マルチタイムフレーム方向、高度なフィルターを分析し、トレーダーがノイズを減らし、弱いセットアップを避け、より構造化された取引判断を行えるようにします。 このイ
このインジケーターを購入された方には、以下の特典を 無料 で提供しています: 各トレードを自動で管理し、ストップロスとテイクプロフィットを設定し、戦略ルールに基づいてポジションを決済する補助ツール 「Bomber Utility」 様々な銘柄に合わせたインジケーターの設定ファイル(セットファイル) 「最小リスク」、「バランスリスク」、「待機戦略」 の3つのモードで使用できる Bomber Utility 用の設定ファイル このトレーディング戦略をすぐに導入・設定・開始できる ステップバイステップのビデオマニュアル ご注意: 上記の特典を受け取るには、MQL5のプライベートメッセージシステムを通じて販売者にご連絡ください。 オリジナルのカスタムインジケーター 「Divergence Bomber(ダイバージェンス・ボンバー)」 をご紹介します。これは、MACDのダイバージェンス(乖離)戦略に基づいた 「オールインワン」型のトレーディングシステム です。 このテクニカルインジケーターの主な目的は、価格とMACDインジケーターの間に発生するダイバージェンスを検出 し、将来の価格の動きを示す
Gann Made Easy   は、ミスター・ギャンの理論を使用した取引の最良の原則に基づいた、プロフェッショナルで使いやすい外国為替取引システムです。 W・D・ガン。このインジケーターは、ストップロスとテイクプロフィットレベルを含む正確な買いと売りのシグナルを提供します。 PUSH通知を利用して外出先でも取引可能です。 ご購入後、取引方法の説明と優れた追加インジケーターを無料で入手するには、私にご連絡ください! おそらく、ギャンの取引手法についてはすでに何度も聞いたことがあるでしょう。通常、ギャンの理論は初心者のトレーダーだけでなく、すでにある程度の取引経験がある人にとっても非常に複雑なものです。なぜなら、ギャンの取引手法は理論的にはそれほど簡単に適用できるものではないからです。私はその知識を磨き、最良の原則を私の外国為替インジケーターに組み込むために数年を費やしました。 このインジケーターは非常に簡単に適用できます。必要なのは、それをチャートに添付し、簡単な取引推奨事項に従うだけです。このインジケーターは常に市場分析の仕事を行い、取引の機会を探します。適切なエントリーポイントを検
トレンドキャッチャーインジケーター トレンドキャッチャーインジケーターは、開発者独自の適応型トレンド分析指標を組み合わせることで、市場価格の動きを分析します。短期的なノイズを除去し、根底にあるモメンタムの強さ、ボラティリティの拡大、価格構造の挙動に焦点を当てることで、真の市場方向性を特定します。また、移動平均線、RSI、ボラティリティフィルターなどの平滑化およびトレンドフィルタリング機能を備えたカスタマイズ指標も使用します。 実際の運用状況のモニタリングやその他の製品については、こちらをご覧ください: https://www.mql5.com/en/users/mechanic/seller ご注意ください。私はTelegramでEAや設定を販売していません。詐欺です。すべての設定はブログで無料で公開しています。 重要!ご購入後すぐにご連絡ください。手順とボーナスをお送りします!
伝説が帰ってきました:Entry Points Pro 10。 MQL5 Marketのトップ3に3年間入り続けた伝説的インジケーターの再始動です。 2つのバージョンで合計589件の高評価レビュー、毎日数千人のトレーダーが実際のトレードに使用し、デモのダウンロードは31,000件以上。 私はこの5年間に寄せられたレビューをすべて読み、約束を並べる代わりに、その答えをバージョン10に組み込みました。1999年から相場に携わり、 誠実さ、自らの評判、そして顧客を大切にする 作者による製品です。 Entry Points Proのエントリーシグナルは、リペイント(再描画)を一切行いません。 そして今回初めて、これは作者の言葉ではなく検証可能な事実になりました。確定シグナルはローソク足の終値確定後にのみ表示され、自動テストで リペイントはゼロ と確認されています(EURUSD、XAUUSD、BTCUSDで2,486,568回の不変条件チェック、違反0件)。検証方法は公開されており、ストラテジーテスターでご自身で再現できます。 ご購入後は、必ずすぐにダイレクトメッセージでご連絡ください。 拡張マ
GoldenX Entryは、MT5向けのインジケーターであり、適応型Smart Entry Trendアルゴリズム、シグナルスコアリングシステム、マーケットレジーム検出機能、およびボラティリティフィルターを備えています。各シグナルには、計算されたエントリーレベル、3つのテイクプロフィット(TP1、TP2、TP3)、およびストップロスレベルが含まれます。本インジケーターは、異なる市場環境に適応するために設計された複数の分析レイヤー上に構築されており、マルチレイヤー分析システムと内蔵オプティマイザーおよび統計トラッキングシステムを組み合わせています。リスク・リワード(RR)指標および過去のトレード履歴に基づく定量分析を提供します。 使い始めは簡単です — 選択した時間足でオプティマイザーを実行し、そのままチャート上でインジケーターを使用します。 コア機能 GoldenX Entryは、シグナルエンジンとトレード管理機能、そして過去統計トラッキングを1つのチャートに統合しています: - 内蔵オプティマイザー: オプティマイザーはチャート上でワンクリックで実行できます。200通りのパラメー
M1 SNIPER は使いやすいトレーディングインジケーターシステムです。M1時間足向けに設計された矢印インジケーターです。M1時間足でのスキャルピングのためのスタンドアロンシステムとして、また既存のトレーディングシステムの一部としても使用できます。このトレーディングシステムはM1時間足での取引に特化して設計されていますが、他の時間足でも使用できます。元々、この手法はXAUUSDとBTCUSDの取引用に設計しましたが、他の市場においても役立つと考えています。 インジケーターのシグナルは、トレンドの方向と逆方向に取引できます。インジケーターのシグナルを利用して両方向に取引するのに役立つ特別な取引テクニックをご紹介します。この手法は、特別な動的なサポートとレジスタンスの価格帯を利用することに基づいています。 ご購入後、M1 SNIPER矢印インジケーターをすぐにダウンロードできます。さらに、M1 SNIPERツールのすべてのユーザーに、以下のスクリーンショットに表示されているApollo Dynamic SRインジケーターを無料で提供しています。この2つのインジケーターを組み合わせることで
Crystal Heikin Ashi Signals - Professional Trend & Signal Detection Indicator Advanced Heikin Ashi Visualization with Intelligent Signal System for Manual & Automated Trading Final Price: $149 ---------> Price goes up $10 after every 10 sales . Limited slots available — act fast . Overview Crystal Heikin Ashi Signals is a professional-grade MetaTrader 5 indicator that combines pure Heikin Ashi candle visualization with an advanced momentum-shift detection system. Designed for both manual traders
ARIPoint
Temirlan Kdyrkhan
1 (1)
ARIPoint is a powerful trading companion designed to generate high-probability entry signals with dynamic TP/SL/DP levels based on volatility. Built-in performance tracking shows win/loss stats, PP1/PP2 hits, and success rates all updated live. Key Features: Buy/Sell signals with adaptive volatility bands Real-time TP/SL/DP levels based on ATR Built-in MA Filter with optional ATR/StdDev volatility Performance stats panel (Success, Profit/Loss, PP1/PP2) Alerts via popup, sound, push, or email Cu
KAMA Confluence Engine トレンドに沿って取引し、反転した瞬間にエントリー、ストップ、ターゲットを即座に把握する。 KAMA Confluence Engine は、カウフマン適応型移動平均(KAMA)を中心に構築されたオールインワンのトレンド指標であり、ティック出来高の加重、マルチタイムフレーム確認、自動トレードレベルを組み合わせています。市場環境に応じて適応し、トレンド時は素早く反応し、レンジ時はノイズを抑えて安定した動きを示します。常に「正しい側」に立てるよう設計されています。 特徴 出来高加重型アダプティブエンジン 実際のティック出来高が増えると KAMA ラインが加速し、出来高が減ると減速します。強いトレンドに乗り、偽の動きを避けることができます。 視認性の高いネオンリボン 明るく滑らかなラインで、下に濃い影が描かれています。緑=上昇、赤=下降、灰色=レンジ/ノートレード。遠くからでも一目でトレンドが分かります。 トレンドカラーのローソク足 ローソク足自体がトレンド色に塗られ、チャート全体が一つのストーリーとして視覚的にまとまります。 自動エントリー/SL
The Oracle Pro
Ottaviano De Cicco
5 (1)
The Oracle Pro:MT5向け合成マルチタイムフレーム・バイアスエンジン ️ サマー・ローンチ・オファー — The Oracle Pro を 199 USD で(早期購入者向け)。価格は普及に応じて上昇します。最終価格 399 USD。 The Oracle Pro は、要求の高いプロのトレーダーのために作られた MetaTrader 5 向けのプレミアム・マルチタイムフレーム バイアスエンジン です。ひとつの問いに規律をもって答えます。すなわち、各タイムフレームの現在の方向バイアスは何か、その強さはどれほどか、そしてタイムフレーム同士はどれだけ一致しているか。すべては確定足のみで計算され、リペイントはありません。 The Oracle Pro はマルチファクター・コンセンサス・システムです。独自のインジケーターと最適化されたアルゴリズムを単一の高度なコンセンサス・ベクトルに統合し、それを単一のインジケーター・インスタンス内で現在足と上位足のスタックにわたって読み取ります。複数のチャートにばらばらのツールを積み重ねる代わりに、です。 これは Oracle コンセンサス手法
ご紹介     Quantum Breakout PRO は 、ブレイクアウト ゾーンの取引方法を変革する画期的な MQL5 インジケーターです。 13年以上の取引経験を持つ経験豊富なトレーダーのチームによって開発されました。     クォンタム ブレイクアウト プロ   は、革新的でダイナミックなブレイクアウト ゾーン戦略により、あなたのトレーディングの旅を新たな高みに押し上げるように設計されています。 クォンタム ブレイクアウト インジケーターは、5 つの利益ターゲット ゾーンを備えたブレイクアウト ゾーン上のシグナル矢印と、ブレイクアウト ボックスに基づいたストップロスの提案を提供します。 初心者トレーダーにもプロのトレーダーにも適しています。 量子EAチャネル:       ここをクリック 重要!購入後、インストールマニュアルを受け取るためにプライベートメッセージを送ってください。 推奨事項: 時間枠: M15 通貨ペア: GBPJPY、EURJPY、USDJPY、NZDUSD、XAUUSD アカウントの種類: ECN、Raw、またはスプレッドが非常に低い R
MT5 Indicator See What the Market Is Really Doing, See the 3 Market Phases Live in front of you (Contraction, Expansion, Trend Phases) and have Better Entries at the Early Stage in the Trend Phase. Stop guessing . Start reading the market like the institutions, Smart Money do. Apex Market Structure Pro Indicator for MT5 is a precision smart-money analysis tool that strips away the noise and shows you the true structure beneath every candle, liquidity, structure shifts, accumulat
Super Hero Signals
Eugen-alexandru Zibileanu
5 (2)
SUPER HERO Signals は、MeanFX が開発した新しいトレーディングインジケーターです。高精度な売買シグナルと適応型 TP/SL(利益確定・損切り)レベルを組み合わせることで、統計的優位性の高いトレード機会を提供します。 価格は5件の購入ごとに値上がりします。次回の価格は 50ドル です。 ご購入前にメッセージをお送りください。リアルタイムチャートのプレビューと最新の取引統計データをご提供いたします。より良い判断材料となり、トレードの向上に役立つはずです。 SUPER HERO Signals の特徴 M15ゴールド(XAUUSD)において実証された統計的パフォーマンス。 (複数の市場や時間足に手を広げるのではなく、1つの時間足を徹底的に極めることに重点を置いています。) 1日あたり1〜3回のトレード機会で、高い勝率と明確な統計的優位性を実現。 チャート上には確認済みの BUY(買い)および SELL(売り)シグナルのみを表示。 各トレードごとに、インジケーターが市場状況に応じた TP(利益確定)および SL(損切り)レベルを自動生成。 平均勝率 75%以上。 平均リ
ACB Breakout Arrows MT5
KEENBASE SOFTWARE SOLUTIONS
3.5 (2)
ACB Breakout Arrows インジケーターは、特別なブレイクアウトパターンを検出することで、市場における重要なエントリーシグナルを提供します。このインジケーターはチャートを常に監視し、一方向に勢いが定着してきた段階で、主要な値動きの直前に精度の高いエントリーシグナルを表示します。 マルチシンボル・マルチタイムフレームスキャナーはこちらから - ACB Breakout Arrows MT5 用スキャナー 主な機能 ストップロスとテイクプロフィットの水準が自動で表示されます。 すべての時間足のブレイクアウトシグナルを監視できるMTFスキャナーダッシュボードを搭載。 デイトレーダー、スイングトレーダー、スキャルパーに最適。 シグナル精度を高めるための最適化されたアルゴリズム。 損益分岐点やスキャルピングターゲットに使える特別なライン(クイックプロフィットライン)。 勝率、平均利益などのパフォーマンス分析メトリクスを表示。 リペイントなし。 トレードの確認 - 低確率のトレードを除外するために ACB Trade Filter インジケーター を使用してください。 強い買い:
Atbot
Zaha Feiz
4.69 (55)
AtBot: どのように機能し、どのように使用するか ### どのように機能するか MT5プラットフォーム用の「AtBot」インジケーターは、テクニカル分析ツールの組み合わせを使用して売買シグナルを生成します。単純移動平均(SMA)、指数移動平均(EMA)、および平均真実範囲(ATR)インデックスを統合して取引機会を特定します。さらに、Heikin Ashiキャンドルを使用してシグナルの精度を向上させることもできます。 購入後にレビューを残すと、特別なボーナスギフトを受け取ります。 ### 主な機能: - 再描画なし: シグナルはプロット後に変更されません。 - 再描画なし: シグナルは一貫しており、変更されません。 - 遅延なし: 遅延なくタイムリーなシグナルを提供します。 - 多様な時間枠: あらゆる時間枠で使用可能で、取引戦略に合わせることができます。 ### 操作手順: #### 入力と設定: - firstkey (TrendValue): トレンド検出の感度を調整します。 - Secondkey (SignalValue): 売買シグナル生成の感度を定義します。 - ma
Prop Firm Sniper MT5 is a professional market structure indicator that automatically identifies high-probability BUY and SELL opportunities using BOS and CHoCH analysis. Recommended Timeframes: For backtesting, use the indicator on   M5 or M15   for Gold (XAUUSD), and   M15 or H1   for more volatile Forex pairs such as   GBPUSD, USDJPY, EURGBP , and similar markets. CONTACT ME AFTER PURCHASE TO CLAIM YOUR FREE BONUSES! Prop Firm Sniper  is a professional market structure indicator designed to
UZFX {SSS} スキャルピング・スマートシグナル v4.0 MT5は、変動の激しい市場において正確かつリアルタイムのシグナルを求めるスキャルパー、デイトレーダー、スイングトレーダー向けに設計された、リペイントのない高性能な取引インジケーターです。(UZFX-LABS)によって開発されたこのインジケーターは、価格行動分析、トレンド確認、スマートフィルタリングを組み合わせることで、すべての通貨ペアおよび時間軸において、高確率の売買シグナル、警告シグナル、トレンド継続の機会を生成します。 トレードの判断に迷うのはもうやめましょう。明確さ、正確さ、そして規律ある市場執行を求めるトレーダーのために設計された、体系的なシグナルシステムに従い始めましょう。 私のおすすめ* 最適な時間足:15分足以上。 {H1} が私のお気に入りです。そして、その成果は驚異的です…!! 主な機能の更新 • 自動売買シグナル検出 • 高度な反転認識ロジック • 市場反転の可能性に先立つ早期警告シグナル • トレンド継続確認シグナル • エントリー、ストップロス、TP1、TP2、TP3レベルを備えた組み込み型
この製品は 2026 年の市場向けに更新され、最新の MT5 ビルドに最適化されています。 価格更新のお知らせ: Smart Price Action Concepts は現在 $200 で提供されています。 次の 30 件の購入 後、価格は $299 に上がります。 特別オファー: 購入後、私にプライベートメッセージを送ることで、 無料ボーナス + ギフト を受け取ることができます。 まず、このトレーディングツールはリペイントなし、再描画なし、遅延なしのインジケーターであり、プロフェッショナルな取引に最適であることを強調しておきます。 Online course , and manual Smart Price Action Concepts Indicator は、初心者から経験豊富なトレーダーまで使える非常に強力なツールです。20 種類以上の便利なインジケーターを 1 つにまとめ、Inner Circle Trader Analysis や Smart Money Concepts Trading Strategies などの高度な取引アイデアを組み合わせています。このインジケ
AXIOM MATRIX MT5 ローンチ価格:$99 Axiom Matrix はローンチ価格 $99 でご利用いただけます。 最初の30件の購入後、価格は $199 に上がります。 ご購入後、手順のご案内と限定ギフトボーナスの受け取りのために、直接DMをお送りください。 Axiom Matrix は、MetaTrader 5 用のプロフェッショナルなマルチシンボル・マルチタイムフレーム市場スキャナー兼意思決定ダッシュボードです。 Market Watch をスキャンし、複数の時間足を分析し、複数のエビデンスエンジンを読み取り、最も強いチャンスを比較し、1つのクリーンなマトリックスダッシュボード内で最適な BUY、SELL、WAIT、またはブロック状態を表示します。 私が Axiom Matrix を作った理由は、市場スキャンという重い作業を代わりに行ってくれる1つのツールが欲しかったからです。 RSI だけを確認したくありませんでした。 次に MACD だけ。 次に移動平均線。 次に出来高。 次にボラティリティ。 次にサポートとレジスタンス。 そして、1つのトレードアイデアを作るた
FX Power: 通貨の強弱を分析して、より賢い取引を実現 概要 FX Power は主要通貨と金の実際の強弱をあらゆる市場状況で理解するための必須ツールです。強い通貨を買い、弱い通貨を売ることで、 FX Power は取引の意思決定を簡素化し、高い確率の取引機会を見出します。トレンドを追従する場合でも、極端なデルタ値を使用して反転を予測する場合でも、このツールはあなたの取引スタイルに完全に適応します。ただ取引するだけではなく、 FX Power で賢く取引をしましょう。 1. なぜ FX Power がトレーダーにとって非常に有益なのか 通貨と金のリアルタイム強弱分析 • FX Power は主要通貨と金の相対的な強弱を計算し、マーケットダイナミクスに関する明確な洞察を提供します。 • どの資産がリードしているか、または後れを取っているかを監視して、取引するペアを賢く選びましょう。 マルチタイムフレームの包括的なビュー • 短期、中期、長期のタイムフレームで通貨と金の強弱を追跡し、マーケットトレンドに基づいて取引戦略を調整できます。 • スキャルピングからスイングトレード
作者のその他のプロダクト
Proton Candle Time MT5 OVERVIEW Proton Candle Time MT5 is an indicator for MetaTrader 5 that displays a real-time countdown timer showing the number of seconds remaining in the current candle. The indicator updates continuously as the candle develops and resets when a new candle opens. This tool is designed for traders who need precise timing information while analyzing price action. PRIMARY FUNCTION The indicator displays the active candle countdown timer directly on the chart. The timer show
FREE
Proton Trade Assistant MT5 OVERVIEW Proton Trade Assistant MT5 is a utility for MetaTrader 5 that provides streamlined position management functions accessible directly from the chart. This tool is designed for traders who manage positions manually and require faster execution of closing and risk management operations. PRIMARY FUNCTION The utility provides one-click access to commonly used position management operations that normally require menu navigation in MetaTrader 5. All operations exe
FREE
Proton Strength Matrix MT5 OVERVIEW Proton Strength Matrix MT5 is an indicator for MetaTrader 5 that analyzes and displays market strength metrics across multiple timeframes simultaneously. The indicator quantifies buying and selling pressure for the current symbol on selected timeframes and presents this information in a dashboard format on the chart. PRIMARY FUNCTION The indicator analyzes price action patterns and generates strength values representing buying pressure (positive) and sellin
FREE
Proton Gold Risk Engine MT5 OVERVIEW Proton Gold Risk Engine MT5 is a utility for MetaTrader 5 that calculates position size based on user-defined risk parameters. The tool helps traders implement consistent position sizing by calculating required lot size based on account capital, risk percentage, and stop loss distance. This utility is designed for manual traders who manage position sizing themselves. PRIMARY FUNCTION The utility provides a calculator interface for determining appropriate p
FREE
Proton Account Dashboard MT5 OVERVIEW Proton Account Dashboard MT5 is a utility for MetaTrader 5 that displays real-time account information on the chart. The dashboard shows key account metrics without requiring navigation to the account settings menu. This tool is designed for traders who want immediate visibility of account status while maintaining focus on price action. PRIMARY FUNCTION The utility displays critical account metrics in a dedicated panel attached to the chart. All values up
FREE
フィルタ:
レビューなし
レビューに返信