Inside Bar PA MT5

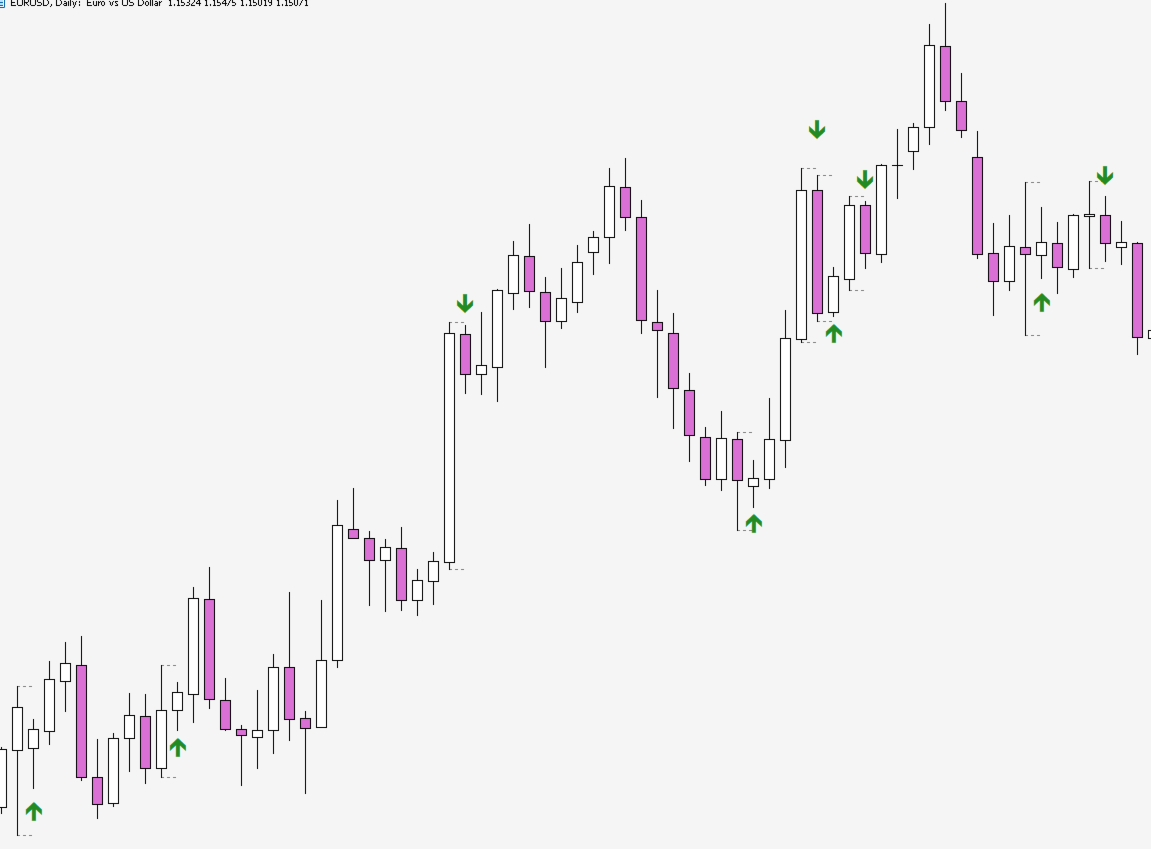
"Inside Bar PA" is a technical indicator for the MetaTrader 5 platform, designed to automatically detect the Inside Bar pattern on the chart. An Inside Bar is a candle whose high and low are completely within the range of the previous candle (mother bar). This pattern often signals market consolidation and can precede a strong price movement.

Features:

• Automatic detection of all Inside Bars on the chart
• Visual marking with arrows: green up arrow for bullish Inside Bars (close >= open), green down arrow for bearish Inside Bars (close < open)
• Optional display of mother bar levels with dotted lines
• Filter by minimum mother bar size
• Adjustable number of bars to analyze

Indicator Parameters:

• LookBackBars - number of bars to analyze (default 1000)
• ShowMotherBarLevels - show/hide mother bar boundaries (enabled by default)
• MinMotherBarSize - minimum mother bar size in points (0 = no limit)
• MotherBarColor - color of mother bar lines (gray by default)

How to Use:

1. Attach the indicator to the chart in MetaTrader 5
2. Adjust parameters according to your preferences
3. Arrow direction shows the Inside Bar type (bullish or bearish)
4. Dotted lines show mother bar boundaries
5. Use signals as part of your trading strategy

Trading Strategy:

Inside Bar is often used as an entry signal after consolidation. The traditional strategy is to wait for a breakout of the mother bar boundaries and enter in the breakout direction. A bullish Inside Bar can strengthen a buy signal, while a bearish one can strengthen a sell signal. It is recommended to use the indicator in combination with trend analysis, support/resistance levels, and other technical analysis tools.


Disclaimer:

• It is recommended to test the indicator on a demo account before using it on a live account
• The indicator is provided "as is" without any warranties regarding its effectiveness or suitability for specific trading purposes
• Not financial advice
おすすめのプロダクト
This SMT (Smart Money Technique) divergence indicator identifies discrepancies in price movement between two different trading symbols, helping traders detect potential market reversals. This tool compares the price action of two correlated assets, such as two currency pairs or indices, to spot divergences where one asset's price moves in the opposite direction of the other. For example, while one symbol may be making higher highs, the other might be making lower highs, signaling a divergence. T
FREE
Renko Chart
Marcin Konieczny
3.56 (9)
This indicator allows to display Renko charts in the indicator window. Renko charts show only price movements that are bigger than the specified box size. It helps to eliminate noise and allows to focus on main trends. Time is not a factor here. Only price movements are taken into account. That's why Renko chart is not synchronized with the main chart it is attached to. Indicator works in two modes: CLOSE - only close prices are taken into account while building the chart HIGH_LOW - only high/l
FREE
Gino Renko
Stephane, Andr Valette
1 (1)
Another renko-based indicator. It returns different usable values ​​for an EA, and is directly displayed on the main chart. Its setting is very simple: The size of the renko The number of bars taken into account The falling color The color on the rise Returned values: Buffer 0 : Value of the middle Buffer 1 : Value of the Top Buffer 2 : Value of the Bottom Buffer 3 : Direction of renko (0.0 for top ; 1.0 for bottom) Buffer 4 : Ratio of the renko, for example, if it is twice, 3 times, ro more of
BerelzBox Darvas based
Barend Willem Van Den Berg
5 (1)
概要 BerelzBox Darvas は MetaTrader 5 用の Darvas Box インジケーターです。現在のローソク足にリアルタイムで更新されるボックスを描画し、参照用に前回の完成したボックスを表示します。ボックスはカラーコード化されたゾーンに分割され、潜在的なエントリーエリアとブレイクアウト条件の特定に役立ちます。 このインジケーターは、Nicolas Darvas の古典的なボックス理論に基づき、現代のマルチタイムフレーム使用に適応させたものです。 仕組み インジケーターは選択したタイムフレーム(デフォルト H4)で各ローソク足ごとに1つのボックスを作成します。現在のボックスは bar 0 の形成に合わせて毎ティック更新されます。前回のボックスは比較のために固定されたまま残ります。 各ボックスは6つのグラデーションゾーンに分割されます: 緑色ゾーン(下半分)は買いエッジエリアを示し、ボックスの安値付近でより濃い色になります 赤色ゾーン(上半分)は売りエッジエリアを示し、ボックスの高値付近でより濃い色になります 点線の中間線が2つの半分を分離します 設定可能な Edg
FREE
2本の加重移動平均線(WMA)をチャート上に表示し、低モメンタムおよびレンジ相場を自動検出するプロフェッショナル向けインジケーターです。 WMA1は始値を基準に計算され、軽微なオフセット付きでトレンド方向を示します。 WMA2は終値を基準に計算され、モメンタムの確認に使用されます。 2本のWMA間の距離が縮小すると、ローソク足は自動的にグレー表示となり、市場がレンジまたは調整局面に入っていることを警告します。 すべての通貨ペア、指数、商品、そして全時間足で使用可能です。 SuperSmooth WMA Trading System Proへアップグレード Pro版では、エントリー/イグジットシグナル、ロング/ショートのローソク足カラー表示、上位足EMAトレンドフィルター、MACDモメンタム確認、SMA方向フィルター、リアルタイムアラート、時間足フィルター設定機能を追加。 すべてのフィルターが一致した場合のみシグナルを生成し、誤シグナルを大幅に削減します。 このインジケーターが役に立つと感じた場合は、ぜひレビューをご検討ください。あなたのフィードバックは、他のトレーダーがこのツールを
FREE
A professional tool for trading - the divergence indicator between the RSI and the price, which allows you to receive a signal about a trend reversal in a timely manner or catch price pullback movements (depending on the settings). The indicator settings allow you to adjust the strength of the divergence due to the angle of the RSI peaks and the percentage change in price, which makes it possible to fine-tune the signal strength. The indicator code is optimized and is tested very quickly as par
FREE
FREE Prop Firm Navigator EA - Advanced Trend-Following & Protection Developed by the EA Trading Academy team using Expert Advisor Studio , this free trading robot combines powerful trend-following indicators with a robust set of account protection features to secure your trading capital. You can find a detailed documentation about the properties and inputs on our  knowledge base . Key Strategy Features: Uses Bulls Power and Awesome Oscillator indicators for precise entry signals Sophisticat
FREE
Forex 17 – Bollinger Bands Pure Sound Alert No Plots は、価格がボリンジャーバンドの上限または下限を明確に突破した際に、音によるアラートを発するインジケーターです。上方向と下方向のブレイクアウトには異なるサウンドが割り当てられており、潜在的な買われ過ぎ・売られ過ぎの状況を直感的に把握することができます。 本バージョンは描画を行わない設計となっており、チャート上には一切の視覚的要素を表示しません。そのため、チャートを常にクリーンな状態に保ちたいトレーダーや、価格そのものに集中したいユーザーに適しています。 ボリンジャーバンドの期間、偏差設定、アラートの発生間隔などを細かく調整でき、異なる時間足や取引スタイルに柔軟に対応可能です。音のみで状態を把握できるため、複数チャートの監視やバックグラウンドでの使用にも適しています。 AI の支援により翻訳されました。
FREE
LongTerm ― 中長期トレンド方向分析インジケーター LongTerm は、 中長期トレンドの強さと質 を解釈するために設計された 方向性分析インジケーター であり、特に ロング(買い)方向の分析 に重点を置いています。 これは エントリー用インジケーターではなく 、また タイミングを測るためのツールでもありません 。 市場が 中長期のロングトレンドにとって有利か不利か を理解するための分析ツールであり、短期的な価格変動によるノイズを効果的に低減します。 目的 LongTerm は以下の目的で設計されています。 強く構造化されたロングトレンド を識別する トレンドの 拡大・減速・消耗フェーズ を見極める 支配的な方向性コンテキスト を明確に可視化する スイングトレード や 長期トレンド分析 を行うトレーダーにとって理想的なツールです。 カラー解釈と市場状態 LongTerm は、ロングトレンドの各フェーズを直感的に把握できるよう設計されたカラー構造を採用し、市場における 最良および最悪のコンディション を明確に示します。 緑のライン(上向きで青ラインの上) こ
FREE
Free until ... The MACD Indicator is a MetaTrader 5 tool that helps traders analyze market trends and momentum. It shows three components in a separate window below the price chart: the MACD Line, Signal Line, and Histogram. What It Shows: MACD Line (Blue): Tracks the difference between a fast and slow moving average. Signal Line (Orange): A smoothed average of the MACD Line. Histogram (Bars): Shows the gap between MACD and Signal Lines with colors: Dark Green : Rising momentum above zero. Lig
FREE
TrendBite v1.5 - プロフェッショナルトレンド追跡インジケーター 開発者: 8aLt4 バージョン: 1.5 プラットフォーム: MetaTrader 5  概要 TrendBite v1.5 は、市場のトレンドの変化を検知し、投資家に明確な売買シグナルを提供するために設計された、高度なテクニカル分析インジケーターです。ボリンジャーバンドのアルゴリズムに基づいて、トレンドの転換を正確に捉えるこのツールは、初心者にも経験豊富なトレーダーにも最適です。  主な機能  トレンドの検知 自動トレンド分析:市場の上昇トレンドと下降トレンドを瞬時に検出 ボリンジャーバンドベース:信頼性の高い数学的モデルに基づく計算システム 視覚的な明瞭さ:緑(上昇)と黄色(下降)のヒストグラムバーでトレンド状況を明確に表示  売買シグナル 緑色の矢印(↑):買い機会を示します 赤色の矢印(↓):売り機会を示します 明確な視覚化:トレンドラインにより、ポジションの方向を簡単に追跡できます ヒストグラム表示:トレンドの強さを視覚的に評価可能  警告システム 音声警告:新しいシグナルが発生すると自動
FREE
Mario Order Block Indicator Overview The Professional Order Block Indicator is an advanced technical analysis tool that automatically identifies and displays institutional order blocks on your chart. Based on smart money concepts, this indicator helps traders identify high-probability support and resistance zones where institutional traders have placed significant orders. Key FeaturesAutomatic Order Block Detection Identifies bullish and bearish order blocks based on pivot point analysis Uses so
DAILY OH/OL SDEV QUANT MODEL - STATISTICAL TRADING WITH PRECISION RISK MANAGEMENT TRADE WITH MATHEMATICAL CERTAINTY - KNOW YOUR EXACT STOP-LOSS AND TAKE-PROFIT BEFORE YOU ENTER This indicator analyzes 5,000+ days of price history to give you: Exact entry levels (sigma bands locked at daily open) Exact stop-loss distance (from M
MAD Bands(Moving Average Deviation Bands) MAD Bands は、価格に対するボラティリティの挙動を移動平均との関係から視覚的に確認したい場合に利用することを想定しています。 MAD_Bands (MQL5版) パラメータ解説 このドキュメントでは、各設定項目(Inputパラメータ)について、MT5のパラメータ入力画面を解説します。 Group: Main (基本設定) Period 初期値 :     20 解説 : 移動平均線(Mid)やバンド幅の計算に使用するローソク足の本数です。数値を大きくすると線が滑らかになりますが、反応は遅くなります。 Shift 初期値 :     0 解説 : インジケータの描画位置を左右にずらします。通常は     0     です。 Center Method 初期値 :     EMA 解説 : 中心線(Midライン)の計算ロジックを選択します。 SMA : 単純移動平均 EMA : 指数平滑移動平均(直近重視) WMA : 加重移動平均 SMMA : 平滑移動平均(長期目線) ZLMA : ゼロラグ
FREE
This indicator calculates fibonacci levels via moving averages trend and draw these lines. You can change fast and slow Moving Averages settings for customization. Inputs: Fast MA Time Period :  64 Fast MA Shift: 0 Fast MA Method: Smoothed Fast MA Apply To: Median Price Slow MA Time Period: 32 Slow MA Shift: 0 Slow MA Method: Smoothed Slow MA Apply To: Median Price ZigZag: False ZigZag Color: Red ZigZag Type: DashDot ZigZag Width: VeryThin Fibo Settings TrendFibonacci: True FiboTrendColor: Black
FREE
このインジケーターは、Patrick Mulloy、Mark Jurik、Chris Satchwell、Alan Hull などの著者によって開発された 37 種類の移動平均のバリエーションを組み込んだ分析ツールです。履歴仮想テストの機能を提供します。 このインジケーターは、金、暗号通貨、株価指数、通貨ペア、その他の資産など、さまざまな金融商品に使用できます。 統合されたビジュアル バックテスターを使用すると、仮想取引ポジションをシミュレートし、結果を追跡し、各移動平均の変化の有効性を視覚的に評価できます。これにより、トレーダーは市場の状況を迅速に特定できます。 このツールには、「最大可能利益」機能(理想的な終了ポイント)も含まれており、最も収益性の高いポイントで各ポジションをクローズした場合の仮想的な取引結果を示します。 さらに、仮想ストップロス機能も提供されており、視覚的なテスト中にリスク管理と潜在的な損失の制御が可能になります。これにより、トレーダーは現実的な状況で戦略を評価することができます。 このツールは、取引戦略の最適化を目指す経験豊富なトレーダーにとっても、移動平均が取
FREE
This utility EA will display simple renko, hence the name essential renko. The renko will be shown in a new tab and using custom symbol. Please do note (especially for those who new to Renko), that Renko does not follow timeline as it will follow price movement. That's why it has a lot of potential where you can attach any EA that you want and use any custom indicator in this new custom symbol for renko. Always use M1 timeframe. Most of the time you don't need to change anything. But if you d
FREE
スリー・プッシュ・フリー:高精度プライスアクション・ストラテジー ️ 重要:この無料版は AUDUSD ペアおよび H1 時間枠のみに制限されています。 トレードとは「聖杯」を見つけることではなく、繰り返される市場心理を特定することです。 スリー・プッシュ・フリー は、機関投資家レベルのフィルターを使用して、古典的な「スリー・プッシュ」のエグゾースト(枯渇)パターンを特定するために設計されたプロフェッショナルなテクニカル分析ツールです。 価格のみを見る基本的なインジケーターとは異なり、このツールは 出来高、モメンタム、トレンドフィルター を統合し、市場が真にオーバーエクステンデッド(過熱)しているセットアップのみを表示するようにします。 ストラテジーの仕組み 「スリー・プッシュ」は反転および枯渇のパターンです。これは、市場が一方向へ押し進もうとする3回連続の試みを特定し、現在の動きが勢いを失っていることを頻繁に示唆します。このインジケーターは、これらのパターンを見つけるために必要な複雑な幾何学的計算を自動化し、 フィボナッチ比率、波の対称性、およびピーク間の時間 を算出します。 プロ
FREE
本指标 基于 Zigzag 基础上... 增加了: 1.增加了箭头指示,使图表更鲜明 2.增加了价格显示,使大家更清楚的看清价格. 3.增加了报警等设置,可以支持邮件发送 原指标特性: 1.基本的波段指标构型. 2.最近的2个ZIGZAG点不具有稳定性,随着行情而改变,(就是网友所说的未来函数) 3.原指标适合分析历史拐点,波段特性,对于价格波动有一定的指导性. Zigzag的使用方法一 丈量一段行情的起点和终点 (1)用ZigZag标注的折点作为起点和终点之后,行情的走势方向就被确立了(空头趋势); (2)根据道氏理论的逻辑,行情会按照波峰浪谷的锯齿形运行,行情确立之后会走回撤行情,回撤的过程中ZigZag会再次形成折点,就是回撤点; (3)在回撤点选择机会进场,等待行情再次启动,止损可以放到回撤的高点。 一套交易系统基本的框架就建立起来了。 Zigzag的使用方法二 作为画趋势线的连接点 趋势线是很常见的技术指标,在技术分析中被广泛地使用。 但一直以来趋势线在实战中都存在一个BUG,那就是难以保证划线的一致性。 在图表上有很多的高低点,到底该连接哪一个呢?不同的书上画趋势线的方法
FREE
This indicator displays buy or sell signals according to Bill Williams' definition of the Trading Zone. [ Installation Guide | Update Guide | Troubleshooting | FAQ | All Products ] Easy to use and understand Avoid trading flat markets Deterministic indicator with clear rules The indicator is non-repainting It implements alerts of all kinds It has straightforward trading implications. A blue arrow is a buy signal A red arrow is a sell signal According to Bill Williams trading in the zone helps t
FREE
This indicator creates a Renko-based custom symbol in MetaTrader 5. Renko charts are built using price movement only, not time, making them useful for analyzing trends and filtering noise. Features Customizable brick size in points. Option to calculate brick size using ATR (adaptive). Ability to show or hide wicks. Creates and updates a custom Renko chart symbol. Automatically opens the chart window (optional). Maintains a limited bar history for performance. Inputs BrickSizePoints – brick size
FREE
Renko Chart Builder
Nopphawin Inthaphong
5 (1)
"Heads up! I've spotted quite a few bugs. I'm working on the fixes right now and will roll out an update shortly. Important Note: You cannot execute orders directly on the simulated (offline) chart. However, you can open it side-by-side with your main chart and place your trades on the main chart. Renko Chart Builder User Manual (UI Edition) How to use: Simply drag and drop the tool onto your chart, just like any standard indicator. MODE (Brick Size Settings) This menu allows you to choose how
FREE
All-in-One Chart Patterns Professional Level: The Ultimate 36-Pattern Trading System All-in-One Chart Patterns Professional Level is a comprehensive 36-pattern indicator well known by retail traders, but significantly enhanced with superior accuracy through integrated news impact analysis and proper market profile positioning. This professional-grade trading tool transforms traditional pattern recognition by combining advanced algorithmic detection with real-time market intelligence.  CORE FEATU
FREE
The TrendOscillator Indicator is an upgraded version of the traditional Stochastic Oscillator.   It comprises two lines: %K and %D.   The %K line represents the current market position.   In contrast, the %D line is a moving average of the %K line used to generate signals and identify potential entry or exit points. The good thing is the indicator works on all timeframes like the traditional Stochastic.   However, to avoid any false signals, applying the indicator on longer timeframes is better
FREE
Advanced CRT Indicator MT5 — Candle Range Theory Tool Advanced CRT Indicator MT5 is a professional analysis tool that automates Candle Range Theory. It identifies consolidation ranges, breakout levels, Fair Value Gaps (FVG), and profit targets, with a real-time dashboard and alerts. Overview - Multi-timeframe candle range detection   - Automatic breakout levels with buffer settings   - Fair Value Gap identification and tracking   - Up to three customizable target levels (Risk:Reward ratios)  
Big candle breakout EA
Irvan Trias Putra
4.33 (3)
Big Candle Break Out is an expert advisor that uses a simple and effective trading strategy based on significant changes in volatility. The EA identifies support and resistance levels on the chart and looks for a candle that breaks through one of these levels with at least x volume. This can signal a shift in the market’s direction and provide a potential trading opportunity. The EA can trade both long and short positions depending on the direction of the break out and this expert has three mon
FREE
ROMAN5 Time Breakout Indicator automatically draws the boxes for daily support and resistance breakouts. It helps the user identifying whether to buy or sell. It comes with an alert that will sound whenever a new signal appears. It also features an email facility. Your email address and SMTP Server settings should be specified in the settings window of the "Mailbox" tab in your MetaTrader 5. Blue arrow up = Buy. Red arrow down = Sell. You can use one of my Trailing Stop products that automatical
FREE
The   Trendlines Oscillator   helps traders identify trends and momentum based on the normalized distances between the current price and the most recently detected bullish and bearish trend lines. The indicator features bullish and bearish momentum, a signal line with crossings, and multiple smoothing options. USAGE The   Trendlines Oscillator   works by systematically: Identifying pivot highs and lows. Connecting pivots to form bullish (support) and bearish (resistance) trendlines. Measuring
Market Maven FX
Michael Prescott Burney
今年上半期のGBP/USD市場に関する専門家。 市場の専門家   この製品は高精度で製造されています。     上半期のGBP/USD取引システム   外国為替市場で最も発展した通貨ペアの一つを対象とした、体系的なチャートベースの取引戦略を求めるトレーダー向けに特別に設計されています。また、飽和状態にある取引プラットフォームの代替を探している方にも最適です。     金取引システム 、ハイリスクな金取引ロボット、あるいはXAUUSDペア向けの変動の激しい自動取引システムなど、Market Mavenは金取引システムに特化したソリューションを提供しています。       GBP/USD 1時間足   状況。 上半期におけるGBP/USDペアの取引に特化して設計されています。 Market Mavenは、より明確な市場構造、より厳密なエントリー戦略、そしてより制御された自動FX取引を重視するトレーダー向けに特別に設計され、市場動向を分析するために開発されました。       GBP/USD:最初の6ヶ月間   このエキスパートアドバイザー(EA)取引システムは、安定した正確な運用を保証しま
FREE
インジケーター   Haven FVG   は、市場を分析するためのツールで、チャート上で非効率性の領域(Fair Value Gaps、FVG)を特定することができ、トレーダーに価格分析と取引決定のための主要なレベルを提供します。 他の製品 ->  ココ 主な特徴: 個別のカラー設定: ブルFVGの色   (Bullish FVG Color)。 ベアFVGの色   (Bearish FVG Color)。 柔軟なFVGの視覚化: FVGを検索するための最大ローソク足数。 FVGゾーンの追加延長(特定のバー数)。 FVGの塗りつぶしを有効にするオプション。 中央線(Middle Line): 線の色とスタイルの選択(例:点線)。 線の太さの調整。 一般設定: FVGを現在のバーまで拡張。 塗りつぶしのある歴史的なFVGを除外し、最新のデータに焦点を当てる。 チャート上の非効率性の領域を分析し、根拠のある取引決定を行う簡単で効果的な方法。
FREE
このプロダクトを購入した人は以下も購入しています
SuperScalp Pro — 高度なマルチフィルター対応スキャルピングインジケーターシステム SuperScalp Pro は、クラシックな Supertrend と複数のインテリジェントな確認フィルターを組み合わせた高度なスキャルピング用インジケーターシステムです。M1〜H4 のすべての時間足で効率的に機能し、特に XAUUSD、BTCUSD、および主要なFX通貨ペアに適しています。単体のシステムとして、また既存の取引戦略へ柔軟に統合して使用できます。 本インジケーターは 11 以上のフィルターを統合しており、短期・長期の EMA、トレンド判定に用いる 3 本の EMA、EMA スロープ(EMA slope)、RSI、ADX、出来高、VWAP、ボリンジャーバンドのブレイクアウト、MACD ダイバージェンスフィルターなどを含みます。スマートキャンドルフィルターはローソク足の終値を確認して弱いシグナルを排除し、3 本の EMA と MACD ダイバージェンスを組み合わせたトレンド認識メカニズムにより勝率の高いシグナルの選別を支援します。 SuperScalp Pro は ATR に基
Azimuth Pro
Ottaviano De Cicco
5 (6)
発売プロモーション Azimuth Proは先着100名様限定で 299ドル でご提供します。最終価格は 499ドル となります。 リテールとインスティテューショナルのエントリーの違いはインジケーターではなく、ロケーションにあります。 多くのトレーダーは、モメンタムを追いかけたり、遅行シグナルに反応して、任意の価格レベルでエントリーします。機関投資家は、需給が実際にシフトする構造的なレベルに価格が到達するのを待ちます。 Azimuth Proはこれらのレベルを自動的にマッピングします:スイングアンカーVWAP、マルチタイムフレーム構造ライン、高確率ロケーションにのみ出現するABCパターン。 Azimuth Proは、構造分析とインテリジェントな自動化の両方を求めるプロフェッショナルトレーダー向けに構築されています。 Azimuthが外科的精度で市場構造をマッピングする一方、Azimuth Proはインテリジェンスレイヤーを追加します:トレーディングスタイルの自動検出、スマート設定された移動平均線、20年のデータでバックテストされた最適化パラメータ。その結果、お使いの銘柄と
このインジケーターを購入された方には、以下の特典を 無料 で提供しています: 各トレードを自動で管理し、ストップロスとテイクプロフィットを設定し、戦略ルールに基づいてポジションを決済する補助ツール 「Bomber Utility」 様々な銘柄に合わせたインジケーターの設定ファイル(セットファイル) 「最小リスク」、「バランスリスク」、「待機戦略」 の3つのモードで使用できる Bomber Utility 用の設定ファイル このトレーディング戦略をすぐに導入・設定・開始できる ステップバイステップのビデオマニュアル ご注意: 上記の特典を受け取るには、MQL5のプライベートメッセージシステムを通じて販売者にご連絡ください。 オリジナルのカスタムインジケーター 「Divergence Bomber(ダイバージェンス・ボンバー)」 をご紹介します。これは、MACDのダイバージェンス(乖離)戦略に基づいた 「オールインワン」型のトレーディングシステム です。 このテクニカルインジケーターの主な目的は、価格とMACDインジケーターの間に発生するダイバージェンスを検出 し、将来の価格の動きを示す
Entry In The Zone and SMC Multi Timeframe is a real-time market analysis tool developed based on Smart Money Concepts (SMC). It is designed to analyze market structure, price direction, reversal points, and key zones across multiple timeframes in a systematic way. The system displays Points of Interest (POI) and real-time No Repaint signals, with instant alerts when price reaches key zones or when signals occur within those zones. It functions as both an Indicator and a Signal System (2-in-1), c
RelicusRoad Pro: 定量的市場オペレーティングシステム 【期間限定】無制限アクセス 70% OFF - 2,000人超のトレーダーと共に なぜ多くのトレーダーは「完璧な」インジケーターを使っても失敗するのでしょうか? それは、文脈を無視して 単一の概念 だけでトレードしているからです。文脈のないシグナルは単なるギャンブルです。勝ち続けるには、 根拠の重なり(コンフルエンス) が必要です。 RelicusRoad Proは単なる矢印インジケーターではありません。完全な 定量的市場エコシステム です。独自のボラティリティモデリングを用いて、価格が推移する「適正価値の道(Fair Value Road)」をマッピングし、ノイズと真の構造的ブレイクを判別します。 推測はやめましょう。機関投資家レベルの「ロード・ロジック」でトレードを。 コアエンジン:「Road」アルゴリズム システムの中心となる Road Algo は、市場環境にリアルタイムで適応するダイナミックなボラティリティチャネルです。 安全ライン(平衡点) と、価格が数学的に反転しやすい 拡張レベル を投影します。 Si
CGE Trading Suite
Carl Gustav Johan Ekstrom
5 (1)
CGE Trading Suite delivers the analytical edge typically reserved for professional trading desks. The platform integrates a full suite of analytical tools into one seamless workflow: dynamic grid mapping, liquidity behavior analysis, ECM, trend lines, MIDAS, trade cycles, and directional channel projections. Together, these provide a unified view of market structure and momentum. Directional clarity is further enhanced by the capital flow index, which measures currency basket strength to identif
このインジケーターを購入すると、プロ仕様のトレードマネージャーを無料で差し上げます。 まず第一に、このトレーディングシステムがノンリペイント、ノンリドロー、ノンラグのインジケーターであることを強調する価値がある。これにより、手動取引とロボット取引の両方に理想的なものになっています。 オンラインコース、マニュアル、プリセットのダウンロード。 「スマートトレンドトレーディングシステム MT5」は、新規および経験豊富なトレーダー向けにカスタマイズされた包括的なトレーディングソリューションです。10以上のプレミアムインジケーターを組み合わせ、7つ以上の堅実なトレーディング戦略を備えており、多様な市場状況に対応する多目的な選択肢となっています。 トレンドフォロー戦略:トレンドを効果的に乗り越えるための正確なエントリーとストップロス管理を提供します。 リバーサル戦略:潜在的なトレンドの反転を特定し、トレーダーがレンジ相場を活用できるようにします。 スキャルピング戦略:高速で正確なデイトレードおよび短期取引のために設計されています。 安定性:すべてのインジケーターはノンリペイント、ノンリドロー、ノ
Gold Entry Sniper – ゴールドスキャルピング&スイングトレード用プロフェッショナル多時間足ATRダッシュボード Gold Entry Sniper は、XAUUSDや他の銘柄向けに正確な 売買シグナル を提供する、MetaTrader 5用の高度なインジケーターです。 ATRトレーリングストップロジック と 多時間足分析ダッシュボード を搭載し、スキャルピングからスイングトレードまで対応します。 主な特徴と利点 多時間足シグナル分析 – M1、M5、M15 のトレンドを同時表示。 ATRベースのトレーリングストップ – ボラティリティに応じて動的に調整。 プロ仕様のチャートダッシュボード – シグナル状況、ATRレベル、回帰線、売買方向を表示。 明確な売買マーカー – 自動矢印とテキストラベル。 エグジットアラートとトレード管理 – 利益確定のための自動検出。 完全カスタマイズ可能 – パネル位置、色、フォント、ATR/回帰設定を調整可能。 ゴールド(XAUUSD)に最適化 – M1〜M15のスキャルピングに最適、FXや指数、暗号資産にも対応。 Gold Entry
FX Trend NG:次世代マルチマーケット・トレンドインテリジェンス 概要 FX Trend NG は、複数の時間足に対応したプロフェッショナル向けトレンド分析およびマーケット監視ツールです。 市場全体の構造を数秒で把握することができます。 複数のチャートを切り替える必要はありません。どの銘柄がトレンド中なのか、どこでモメンタムが弱まっているのか、そしてどの時間足で強い整合性があるのかを瞬時に確認できます。 ローンチ特別オファー – FX Trend NG を $30(6ヶ月) または $80 永久ライセンス でご利用いただけます。 すでに Stein Investments のユーザーですか? -> メッセージを送信 して、プライベートグループへアクセスしてください。 セットアップや詳細情報が必要ですか? -> Stein Investments 公式ページ をご覧ください。 1. FX Trend NG が他と異なる理由 3ステート・トレンドロジック ― Buy と Sell だけではない • 多くのインジケーターは Buy または Sell の2状態のみを表示します。
Power Candles – あらゆる市場に対応した強度ベースのエントリーシグナル Power Candles は、Stein Investments が長年培ってきた強度分析を価格チャート上に直接反映します。価格だけに反応するのではなく、各ローソク足は実際の市場の強さに基づいて色分けされ、モメンタムの蓄積、強度の加速、明確なトレンド転換を瞬時に把握できます。 すべての市場に共通する単一ロジック Power Candles は すべての取引シンボル で自動的に動作します。現在のシンボルが Forex か非 Forex 市場かを自動判別し、内部で適切な強度モデルを適用します。 Forex および Gold :FX Power のデルタ値を使用(絶対値レンジ最大 100) 指数、暗号資産、CFD :IX Power の強度値を使用(絶対値レンジ最大 50) 必要な強度計算は Power Candles に直接組み込まれています。ローソク足のカラーリングやシグナルロジックに、追加のインジケーターは不要です。 価格ノイズではなく「強度状態」 各ローソク足は、以下の 9 つの明確に定義された強
Meridian Pro
Ottaviano De Cicco
5 (1)
Meridian Pro:MT5用プロフェッショナル・マルチタイムフレーム・トレンドマトリックス 概要 Meridian Pro は Merkava Labs が開発したマルチタイムフレーム・トレンドマトリックスで、方向性の状態、強度、モメンタムの状況、マトリックスの合意をひとつのコンパクトなパネルに集約します。ひとつのアダプティブエンジンがM1からW1まで一貫して適用されます。シンボルごとの調整は不要。インジケーターの積み重ねも不要。すべてのアセットとすべてのタイムフレームをカバーするひとつの構造化された読み取りです。 発売キャンペーン — Meridian Proを USD 99 (導入価格)で入手。通常価格:USD 149 。 1. Meridian Proが他と異なる理由 ひとつのエンジン、バラバラなインジケーターのダッシュボードではない 多くのMTFダッシュボードは、タイムフレームごとに生のインジケーター値を繰り返すだけです。Meridian Proはマトリックス全体でひとつのアダプティブ・トレンドエンジンを使用するため、パネルの各行が同じ構造化フレームワークから導出されます
トレンド スクリーナー インジケーターでトレンド取引の力を解き放ちます。ファジー ロジックと複数通貨システムを活用した究極のトレンド取引ソリューションです。 ファジー ロジックを活用した革新的なトレンド インジケーターである Trend Screener を使用して、トレンド取引を向上させます。 これは、13 を超えるプレミアム ツールと機能、および 3 つの取引戦略を組み合わせた強力なトレンド追跡インジケーターであり、Metatrader をトレンド アナライザーにする多用途の選択肢となります。 期間限定オファー : トレンド スクリーナー インジケーターは、わずか 100 ドルで生涯ご利用いただけます。 (元の価格 50$ ) (オファー延長) Trend Screener の 100% 非再描画精度の揺るぎない精度を体験して、取引の決定が過去の価格変動の影響を受けないようにしてください。 マルチタイムフレームおよびマルチ通貨機能の多用途性を解放し、比類のない自信を持って外国為替、商品、暗号通貨、インデックスの世界を取引できるようにします。 Trend Screener の包括的な
[ My Products ] , [ My Channel ]   ,  [ LIVE SIGNAL ] HFT Spike Detector HFT Spike Detector は、高頻度取引(HFT)による急激な価格変動をリアルタイムで分析・測定するために開発されたプロフェッショナルなティック監視ツールです。 目的は、ブローカーによって引き起こされる異常なスリッページ、流動性のギャップ、ミリ秒単位の価格スパイクを数値データで検出できるようにすることです。 リアルタイムのティックフローと約定条件を分析するため、バックテストで正確に評価することはできません。 このEAは、自動化のために用意されたセットファイルと一緒に使用するために購入できます: VolumeHedger EA 動作原理 この Expert Advisor は、受信するすべてのティックをリアルタイムで分析し、以下を行います: 価格変動速度 1秒あたりのティック密度 スリッページの大きさ 同方向のマイクロフロー 測定し、チャート上のパネルに表示します。 これにより、スプレッドを除いた実際の執行品質を確認できま
まず第一に、この取引インジケーターは再描画されず、再描画されず、遅延しないことを強調する価値があります。これにより、手動取引とロボット取引の両方に理想的なものになります。 ユーザーマニュアル:設定、入力、戦略。 アトミックアナリストは、価格の強さとモメンタムを利用して市場でより良いエッジを見つけるためのPA価格アクションインジケーターです。ノイズや誤ったシグナルを除去し、取引ポテンシャルを高めるための高度なフィルターを備えています。複雑なインジケーターの複数のレイヤーを使用して、アトミックアナリストはチャートをスキャンし、複雑な数学的計算をシンプルなシグナルと色に変換します。これにより、どのような初心者トレーダーでも理解して使用し、一貫した取引の決定を行うことができます。 「アトミックアナリスト」は、新規および経験豊富なトレーダー向けにカスタマイズされた包括的な取引ソリューションです。プレミアムインジケーターとトップノッチの機能を1つの取引戦略に組み合わせ、すべてのタイプのトレーダーにとって汎用性のある選択肢にします。 デイリートレーディングとスキャルピング戦略:高速で正確なデイ
マーケットメーカーのためのツール。 Meravith は次の機能を提供します: すべての時間足を分析し、現在有効なトレンドを表示します。 強気と弱気の出来高が等しくなる流動性ゾーン(出来高均衡)を強調表示します。 異なる時間足のすべての流動性レベルをチャート上に直接表示します。 テキスト形式の市場分析を生成し、参考情報として表示します。 現在のトレンドに基づいて目標値、サポートレベル、ストップロスを計算します。 取引のリスクリワード比を算出します。 口座残高に基づいてポジションサイズを計算し、潜在的な利益を推定します。 また、市場に大きな変化があった場合には警告を表示します。 インジケーターの主要ライン: 強気/弱気の出来高エグゾーストライン ― 目標値として機能します。 市場のトレンドを示すライン。市場が強気か弱気かによって色が変わり、トレンドのサポートとして機能します。主にその色が市場センチメントを示します。 出来高均衡ライン(Eq)。Eq(Volume Equilibrium)ラインはシステムの中核です。これは買い手と売り手の出来高のバランスポイントを表します。市場の流動性を示し
OmniSync Projection
Antonio-alin Teculescu
5 (1)
Chronos Fractal Engine is an innovative price projection indicator for MetaTrader 5, designed to transform your technical analysis by intelligently identifying and projecting historical price patterns. Built upon an advanced correlation algorithm and the fractal principles of the market, this powerful tool visualizes potential future price movements, giving you a unique edge in your trading decisions. What is Chronos Fractal Engine? At its core, the Chronos Fractal Engine employs a sophisticat
ARICoin is a powerful trading companion designed to generate high-probability entry signals with dynamic TP/SL/DP levels based on volatility. Built-in performance tracking shows win/loss stats, PP1/PP2 hits, and success rates all updated live. Key Features: Buy/Sell signals with adaptive volatility bands Real-time TP/SL/DP levels based on ATR Built-in MA Filter with optional ATR/StdDev volatility Performance stats panel (Success, Profit/Loss, PP1/PP2) Alerts via popup, sound, push, or email Cust
Quantum TrendPulse を ご紹介します。これは、   SuperTrend   、   RSI   、および Stochastic のパワーを 1 つの包括的なインジケーターに組み合わせて、取引の可能性を最大限に引き出す究極の取引ツールです。精度と効率を求めるトレーダー向けに設計されたこのインジケーターは、市場のトレンド、勢いの変化、最適なエントリー ポイントとエグジット ポイントを自信を持って特定するのに役立ちます。 主な特徴: SuperTrend 統合: 現在の市場動向に簡単に追従し、収益性の波に乗ることができます。 RSI精度: 買われすぎと売られすぎのレベルを検出し、市場の反転のタイミングに最適で、SuperTrendのフィルターとして使用されます。 確率的精度: 確率的振動を活用して、変動の激しい市場で隠れたチャンスを見つけます。SuperTrend のフィルターとして使用されます。 マルチタイムフレーム分析:   M5 から H1 または H4 まで、さまざまなタイムフレームで市場を常に把握します。 カスタマイズ可能なアラート: カスタム取引条件が満たされ
Currency Strength Dashboard Pro MetaTrader 5 用の リアルタイム通貨強度分析プロフェッショナルダッシュボード 。 このインジケーターは、 8つの主要通貨 (EUR、USD、GBP、JPY、CHF、AUD、CAD、NZD)の強さを計算し、 28の通貨ペア を同時に複数の時間足で分析・表示します。 ダッシュボードにより、トレーダーは 市場全体の状況を一目で把握 でき、余計な計算や複数のチャートを切り替える必要がありません。 計算方法 このインジケーターは、 高度な数学的通貨強度分析手法 に基づいています。 これは、類似インジケーターで一般的に使用されている RSIベースの手法 と比較して、より正確で客観的です。 この方法は 28の通貨ペアすべての相互関係を同時に分析 し、市場における実際の力関係をよりクリーンで偏りのない形で表示します。 リアルタイムダッシュボード メインテーブルには 8つの通貨 の完全なデータが表示されます。 Rank(順位) — 通貨の総合強度による順位。 1(最も強い)〜8(最も弱い) 。 Strength(強度) — 現在
優れたテクニカルインジケーター「Grabber」をご紹介します。これは、すぐに使える「オールインワン」トレーディング戦略として機能します。 ひとつのコードに、市場のテクニカル分析ツール、取引シグナル(矢印)、アラート機能、プッシュ通知が強力に統合されています。 このインジケーターを購入された方には、以下の特典を無料で提供します: Grabberユーティリティ:オープンポジションを自動で管理するツール ステップバイステップのビデオマニュアル:インジケーターのインストール、設定、取引方法を解説 カスタムセットファイル:インジケーターをすばやく自動設定し、最大限の成果を出すための設定ファイル 他の戦略はもう忘れてください!Grabberだけが、あなたを新たなトレードの高みへと導いてくれるのです。 Grabber戦略の主な特徴: 推奨タイムフレーム:M5〜H4 対応通貨ペア・資産:どれでも使用可能ですが、私が実際に検証した以下を推奨します(GBPUSD、GBPCAD、GBPCHF、AUDCAD、AUDUSD、AUDSGD、AUDCHF、NZDUSD、NZDCAD、EURCAD、EURUSD、E
ご紹介     Quantum Breakout PRO は 、ブレイクアウト ゾーンの取引方法を変革する画期的な MQL5 インジケーターです。 13年以上の取引経験を持つ経験豊富なトレーダーのチームによって開発されました。     クォンタム ブレイクアウト プロ   は、革新的でダイナミックなブレイクアウト ゾーン戦略により、あなたのトレーディングの旅を新たな高みに押し上げるように設計されています。 クォンタム ブレイクアウト インジケーターは、5 つの利益ターゲット ゾーンを備えたブレイクアウト ゾーン上のシグナル矢印と、ブレイクアウト ボックスに基づいたストップロスの提案を提供します。 初心者トレーダーにもプロのトレーダーにも適しています。 量子EAチャネル:       ここをクリック 重要!購入後、インストールマニュアルを受け取るためにプライベートメッセージを送ってください。 推奨事項: 時間枠: M15 通貨ペア: GBPJPY、EURJPY、USDJPY、NZDUSD、XAUUSD アカウントの種類: ECN、Raw、またはスプレッドが非常に低い R
FX Power: 通貨の強弱を分析して、より賢い取引を実現 概要 FX Power は主要通貨と金の実際の強弱をあらゆる市場状況で理解するための必須ツールです。強い通貨を買い、弱い通貨を売ることで、 FX Power は取引の意思決定を簡素化し、高い確率の取引機会を見出します。トレンドを追従する場合でも、極端なデルタ値を使用して反転を予測する場合でも、このツールはあなたの取引スタイルに完全に適応します。ただ取引するだけではなく、 FX Power で賢く取引をしましょう。 1. なぜ FX Power がトレーダーにとって非常に有益なのか 通貨と金のリアルタイム強弱分析 • FX Power は主要通貨と金の相対的な強弱を計算し、マーケットダイナミクスに関する明確な洞察を提供します。 • どの資産がリードしているか、または後れを取っているかを監視して、取引するペアを賢く選びましょう。 マルチタイムフレームの包括的なビュー • 短期、中期、長期のタイムフレームで通貨と金の強弱を追跡し、マーケットトレンドに基づいて取引戦略を調整できます。 • スキャルピングからスイングトレード
Bill Williams Advanced is designed for automatic chart analysis using Bill Williams' "Profitunity" system. The indicator analyzes four timeframes at once. Manual (Be sure to read before purchasing) Advantages 1. Analyzes the chart using Bill Williams' "Profitunity" system. Signals are displayed in a table in the corner of the screen and on the price chart. 2. Finds all known AO and AC signals, as well as zone signals. Equipped with a trend filter based on the Alligator. 3. Finds "Divergence Bar
現在33%オフ 初心者にもエキスパートトレーダーにも最適なソリューション このインジケーターは独自の機能と新しい公式を多数内蔵しており、ユニークで高品質かつ手頃な取引ツールです。このアップデートでは、2つの時間枠ゾーンを表示できるようになります。より長いTFだけでなく、チャートTFとより長いTF(ネストゾーンを表示)の両方を表示できます。すべてのSupply Demandトレーダーの皆さんのお気に召すはずです。:) 重要情報の公開 Advanced Supply Demandの可能性を最大化するには、 https://www.mql5.com/ja/blogs/post/720245 にアクセスしてください。   エントリーまたはターゲットの正確なトリガーポイントを正確に特定できれば取引がどのように改善されるか想像してみてください。新しい基盤となるアルゴリズムに基づいて構築されているため、買い手と売り手の間の潜在的な不均衡をさらに簡単に特定できます。これは、最も強い需要と供給のゾーンと、過去のパフォーマンス(古いゾーンを表示)がグラフィカルに表現されるためです。これらの機能は、最適な
このインジケーターは、反転ポイントと価格戻りゾーンを正確に表示します。     主要プレーヤー 。新たなトレンドが形成される場所を把握し、最大限の精度で意思決定を行い、すべての取引をコントロールします。 TREND LINES PRO インジケーターと組み合わせることで、その潜在能力を最大限に発揮します。 VERSION MT4 インジケーターが示す内容: 新しいトレンドの始まりに活性化する反転構造と反転レベル。 リスクと報酬の比率を最小限に抑えた利益 確定 と 損失停止の レベルの表示     RR 1:2   。 インテリジェントな削減ロジックによるストップロス。 指定されたインジケーターから 2 つのトレンド タイプの反転パターンを表示します。 指標: トレンドを追う   TREND LINES PRO   (世界的なトレンドの変化) TREND PRO   (クイックトレンド変更) シンプルで効果的   スキャナー   リアルタイムトレンド(新機能)。 マルチタイムフレームのインストゥルメント フィルタリング。 画面   利益     LOGIC AI信号の後。 当日プラス方
Market Structure Order Block Dashboard MT5 は、 MT5(MetaTrader 5)用インジケーター です。 市場構造 と ICT / Smart Money Concepts に基づき、 HH/HL/LH/LL 、 BOS 、 ChoCH に加えて、 Order Blocks 、 Fair Value Gaps (FVG) 、 流動性 (EQH/EQL、sweeps)、 セッション / Kill Zones 、 Volume Profile を表示し、コンパクトなコンフルエンス・ダッシュボードを提供します。 重要: これは 分析ツール です。自動売買は行いません(EAではありません)。 購入者特典(ボーナス) 購入後、私のストアから 2つのボーナスインジケーター を(選択して)受け取ることができます。 ボーナスの受け取り方法: 1) 本商品のページに正直なレビューを投稿してください。 2) MQL5のメッセージで、 BONUS MSOB + 選んだ 2つのインジケーター名 を送ってください。 主な機能 市場構造: HH/HL/LH/LL
Market Structure Patterns
Samuel Manoel De Souza
4.47 (19)
Available for   MT4   and   MT5 . Join the Market Structure Patterns channel to download materials available for study and/or additional informations. Related posts: Market Structure Patterns - Introduction Beyond Fancy Order Blocks: Using True Volumetric Analysis with Market Structure Patterns & Timeless Charts Market Structure Patterns   is an indicator based on   smart money concepts   that displays   SMC/ICT   elements that can take your trading decisions to the next level. Take advantage
Crystal Heikin Ashi Signals - Professional Trend & Signal Detection Indicator Advanced Heikin Ashi Visualization with Intelligent Signal System for Manual & Automated Trading Final Price: $149 ---------> Price goes up $10 after every 10 sales . Limited slots available — act fast . Overview Crystal Heikin Ashi Signals is a professional-grade MetaTrader 5 indicator that combines pure Heikin Ashi candle visualization with an advanced momentum-shift detection system. Designed for both manual traders
あなたのシンボルでどの戦略が実際に機能するか確認しましょう - リアルマネーをリスクにさらす前に。 Power Barは、あらゆるシンボルとあらゆるタイムフレームで 極端な価格バー を検出し、3つの異なるトレード戦略を即座にバックテストします。勝率、プロフィットファクター、損益を並べて比較できます。すべてが1つのインタラクティブなパネルに集約されています。 推測なし。カーブフィッティングなし。データだけです。 Power Barが特別な理由 ほとんどのインジケーターはシグナルを出すだけで、それが機能するかどうかは推測に任されます。Power Barはさらに先を行きます - すべてのシグナルを 3つの戦略 に対してテストし、統計を表示します。FlipFlop、Momentum、Reversalをワンクリックで切り替え、数値が即座に変化するのを確認できます。 FlipFlop - 常にポジションを保有。シグナルでエントリーし、反対シグナルでイグジット。当社のリサーチでは、US30、US500、DAXなどのトレンドのあるインデックスで最も効果的です。 Momentum - シグナルの方向に
Smart Stop Indicator – チャート上で実現するインテリジェントなストップロス精度 概要 Smart Stop Indicator は、ストップロスを勘や感情ではなく、明確で体系的に設定したいトレーダーのために設計されています。本ツールは、クラシックなプライスアクション(高値更新・安値切り下げ)と最新のブレイクアウト認識ロジックを組み合わせ、次に来るべき論理的なストップレベルを正確に特定します。トレンド相場、レンジ、急速なブレイクアウト局面のいずれであっても、最適な SL ゾーンとその状態(“new”、“broken”、“valid”)をチャート上に直接表示します。さらに今回、SL 距離の %ADR 表示も新たに追加されています。 主な特徴 マーケット構造に基づく自動ストップ配置 • 市場構造とリアルタイムの値動きに基づき、意味のあるストップロスレベルを自動検出します。 スマートなブレイクアウト感知 • 急激な方向転換やブレイクアウトにも柔軟に対応し、早すぎるストップ調整を避けます。 SL %ADR の表示 • ストップロスまでの距離を ADR(Averag
作者のその他のプロダクト
This expert Advisor is primarily intended for dispersing small deposits. For example, in testing since 2017, the EA increased its balance from   100 $ to   6 514 361 $ The "Pand0ra EA" expert Advisor is perfect for the   "EUR/GBP M30"   pair. It uses only two indicators "Previous High Low" and "Top Bottom Price". Each trade is protected by a Stop Loss and Take Profit. In the parameters of the expert Advisor, you can change the percentage of the lot from the Deposit(by default, it is 5%) also,
Pin Bars
Yury Emeliyanov
5 (4)
主な目的:"ピンバー"は、自動的に金融市場チャート上のピンバーを検出するように設計されています。 ピンバーは、特徴的なボディと長いテールを持つキャンドルであり、トレンドの反転または修正を知らせることができます。 それがどのように機能するか:インジケーターはチャート上の各キャンドルを分析し、キャンドルの体、尾、鼻のサイズを決定します。 事前定義されたパラメータに対応するピンバーが検出されると、インジケータはピンバーの方向(強気または弱気)に応じて、上矢印または下矢印でチャート上に パラメータ: TailToBodyRatio-テールの長さとピンバーのボディサイズの最小比率を定義します。 NoseToTailRatio-ピンバーの「ノーズ」とテールの間の最大許容比を設定します。 ArrowSize-マークされたピンバーとチャート上のピンバーを指す矢印との間の距離を定義します。 適用:"ピン棒"の表示器が潜在的な傾向の逆転ポイントを識別し、市場か近い位置を書き入れる信号を発生させるのに使用することができます。 正しく使用され、他のテクニカル指標や分析方法と組み合わせると、指標は取引結果
FREE
PPRとEngulfing は、MetaTrader 4 (MT4)トレーディングプラットフォームの通貨チャートで「PPR」および「Engulfing」パターンを識別するために設計されたユニークなテクニカルインディケーターです。これらのパターンは、トレンドの反転や継続の可能性を示すことができ、トレーダーに市場へのエントリーとエグジットのための貴重なシグナルを提供します。 主な特徴: パターンの自動検出 : インディケーターは、PPRおよびEngulfingパターンを自動的に識別し、チャートに矢印でマークします。 視覚的シグナル : 緑色の上向き矢印は買いのポイントを示し、赤色の下向き矢印は売りのポイントを示します。 カスタマイズ可能な矢印の色 : ユーザーは、インディケーター設定を通じて、強気および弱気シグナルの矢印の色を選択できます。 モード選択 : 3つの動作モード - PPRのみ、Engulfingのみ、または両方のパターンを同時に分析します。 使用方法: チャートに追加 : インディケーターを希望する通貨ペアまたは金融商品のチャートに適用します。 シグナルを分析 : チャート上
FREE
Ppr PA
Yury Emeliyanov
4.5 (2)
"Ppr PA" is a unique technical indicator created to identify "PPR" patterns on the currency charts of the MT4 trading platform. These patterns can indicate possible reversals or continuation of the trend, providing traders with valuable signals to enter the market. Features: Automatic PPR Detection:   The indicator automatically identifies and marks PPR patterns with arrows on the chart. Visual Signals:   Green and red arrows indicate the optimal points for buying and selling, respectively. Ar
FREE
The EA is designed primarily for the GBP / USD pair with the M15 timeframe , but it can also be used on other major pairs with preliminary testing using minimal risks. You can change the lot size in the adviser parameters. The EA is based on several indicators: Percent BB, Steady Bands, and Donchian Channel. The expert Advisor opens a buy transaction at the opening of a new day if all the conditions of the above Indicators are met. Below are screenshots of testing since 2018. Initial balance
"Fakey PA" is a technical indicator for the MetaTrader 5 platform, designed to automatically identify the Fakey pattern (false breakout) on the chart. The Fakey pattern is a combination of an Inside Bar followed by a false breakout, which often precedes a strong price movement in the opposite direction. What is the Fakey Pattern: Fakey is a three-bar false breakout formation: 1. Mother Bar - a wide bar that contains the next bar 2. Inside Bar - a bar completely within the range of the mother ba
FREE
"PPR PA" is a technical indicator for the MetaTrader 5 platform, designed to automatically identify the PPR (Push-Pull-Rejection) pattern on the chart. This is a three-candle reversal pattern that can signal the end of a correction and resumption of the trend, providing traders with entry signals. What is the PPR Pattern: PPR is a three-candle reversal formation: • Bullish PPR: two consecutive bearish candles (the second with a lower high and low), then a bullish candle that closes above the
FREE
Main purpose:   "Pin Bars"   is designed to automatically detect pin bars on financial market charts. A pin bar is a candle with a characteristic body and a long tail, which can signal a trend reversal or correction. How it works:   The indicator analyzes each candle on the chart, determining the size of the body, tail and nose of the candle. When a pin bar corresponding to predefined parameters is detected, the indicator marks it on the chart with an up or down arrow, depending on the directi
FREE
Fakey Detector — False Breakout (Fakey) Indicator Fakey Detector is an indicator that automatically detects the classic Fakey pattern (false breakout of an inside bar) from Price Action and displays it on the chart using an arrow and breakout level. How it works: The Fakey pattern consists of three candles: Mother Bar — the largest by range Inside Bar — fully contained within the Mother Bar's range Fakey Candle — breaks out (up or down), but then closes back inside the range The indicator
FREE
Three Bar Reversal (MT4) — free indicator Three Bar Reversal is a simple and effective MetaTrader 4 indicator that detects the classic three-bar reversal candlestick pattern with additional filtering based on ATR and candle body sizes. Arrows are displayed on the last closed candle of the pattern, and push notifications are also sent. An automated trading robot Three Bar Reversal EA has been developed based on this indicator. The indicator works on all currency pairs and timeframes but pe
FREE
Railway Tracks Pattern — Reversal Pattern Indicator Railway Tracks Pattern is an indicator that automatically detects a powerful two-candle reversal pattern on the chart. It looks for two candles with opposite directions (bullish and bearish), similar in size, and with minimal wicks — a clear sign of momentum shift. How it works: The first candle is strong and directional. The second candle moves in the opposite direction and is of similar size. Both candles have small shadows (wicks). The
FREE
"Inside Bar PA" is a technical indicator designed to determine the inner bars on the chart. An internal bar is a bar or candle, the maximum and minimum of which are completely contained in the previous bar. This may signal a potential reversal or continuation of the trend, depending on the context. Features: Automatic detection of internal bars. Visual marking of internal bars with arrows on the chart. The ability to adjust the distance of the mark from the bar. How to use: Attach the indicato
FREE
R2d2
Yury Emeliyanov
R2d2unit description in lists のR2D2専門の取引に基づく%BBと着実なバンドを示します。 通貨ペア:EURUSD,時間枠:M15.(推奨) GBPUSD,USD/CHF,USD/CAD,EUR/JPY,EUR/GBP,EUR/CHF,AUD/USD,NZD/USDタイムフレームM15(場合によってはM30) オープニング(入力信号) R2D2エキスパートアドバイザーは、パーセントBBと定常バンド指標のすべての論理条件が満たされた日の初めに新しいロングまたはショートポジシ 取引量 あなたのアカウントの割合を取引。 新しいポジションを開く-口座資本の5%。 保護 停止損失を制限する損失の位置を55ポイントを開きます。 テイク利益は、利益の60ポイントのレベルでの位置を閉じます。 ポジションのストップロスは、利益が50ポイントに達すると損益分岐点の価格に設定されます。 実際のアカウントで使用する前に、最小限のリスクでEAをテストしてください。 低スプレッド+手数料+高品質の実行-これは、取引のためのブローカーを選択する際の主なものです。
EAは、主にユーロ/英ポンドのペアM15時間枠のために設計されています,それはまた、最小限のリスクを使用して予備テストと他の主要なペアで使用 アドバイザーのパラメータでは、取引ごとにリスクの割合を変更できます。 EAはいくつかの指標に基づいています:%BB、安定したバンド、およびロスフック。 エキスパートアドバイザーは、上記の指標のすべての条件が満たされている場合、新しい日の開始時に買い取引を開始します。 以下は、最後の3年間のテストのスクリーンショットです。 初期残高=$100. 最終的な結果= 1   137 000$. ドローダウン= 13%. 。 勝ち負け取引の割合= 85/15% 実際のアカウントで使用する前に、最小限のリスクでEAをテストしてください。
Imba
Yury Emeliyanov
"IMBA"  is a trading robot for the trading on forex. The EA analyzes the market using several indicators (Persistent BB, Steady Bands). Opens and closes trades on indicators, but sometimes on Stop Loss or Take Profit. It doesn't open many deals, but it compensates for this with the quality of the deals. There is no point in telling too much, just download the Demo version and test it. Others Product:  https://www.mql5.com/ru/users/yura1994ru/seller#products Recommendations: Symbol EURUSD Time
The main advantage of the EA is the percentage of profitable trades that is   99%   in testing over the past 2 years. He does not make many transactions, please note this. Designed primarily for the   EUR/USD M30 pair . The EA Uses several indicators the main one of which is   "Stochastics" Default testing parameters Initial balance = $10,000 Net profit = $27,300 Profitable trades = 99% Drawdown = 38% Other product:   https://www.mql5.com/ru/users/yura1994ru/seller#products Before using it on a
Naboo
Yury Emeliyanov
By default, the expert Advisor parameters allow trading on the   GBP/USD M30 pair . Using three indicators (ATR MA Oscillator, Stochastic, Top Bottom Price) to open and close trades, but also uses Stop Loss and Take Profit. Below is a test   for the last 6 years.   The default lot size is 1 lot and is recommended for a Deposit of 10 000. For a smaller Deposit, it is recommended to reduce the lot size. For 1000 = 0.1 lot, for 100 = 0.01 lot. Other product:   https://www.mql5.com/ru/users/yura1994
The "Mjolnir" Expert Advisor is perfect for most Currency Pairs and Timeframes from M15 to H4, but it performs best on the   "EUR/GBP M30" pair.   It uses only two indicators "Bollinger Bands" and "Top Bottom Price". Each trade is protected by Stop Loss and Take Profit. In the parameters of the expert Advisor, you can change the percentage of the lot from the Deposit(by default, it is 5%), as well as the values of indicators, Stop Loss and Take Profit, if necessary.  The test statistics for 4 y
By default, the EA parameters allow trading on the   EUR/JPY M30 pair.   For the test from 2017.01.07 - 2021.01.07   from 100   $   to   1 957 164   $   see below. The EA uses three indicators (ATR MA Oscillator,   Donchian Channel , Top Bottom Price) to open and close trades, but also uses Stop Loss and Take Profit. The lot size is specified as a percentage of the account balance (by default, 5% and a limit of 100 lots is specified). Default testing parameters Initial balance = 100  $ Net profi
Ord Mantell
Yury Emeliyanov
5 (1)
Suitable currency pairs:   EUR/JPY H1   (there will be sets with settings for other currency pairs in the discussions) Indicators used:   "ATR MA Oscillator", "Entry Time", "Top Bottom Price" and "Previous High Low" Default lot size =   5% Other Products:  https://www.mql5.com/ru/users/yura1994ru/seller#products Test results since 2017 for the EUR/JPY H1 pair Initial balance = 500  $ Net profit = 2,372,808  $ Profitability = 4.07 Profitable trades = 84% Drawdown = 7% Recommendation: use an ac
Barracuda EA
Yury Emeliyanov
4 (1)
The main advantage of the Expert Advisor is the percentage of profitable trades, which is 70% in testing over the past 5 years. The EA is primarily designed for the EUR/GBP M15 pair, but it can also be used on other currency pairs if the EA is pre-optimized. The EA uses several indicators, the main one of which is the "Donchian Channel". Look at the test results over the past 5 years. Default testing parameters Initial balance = 500 $ Net profit = 8,431 $ Profitable trades = 70% Drawdown = 17%
"Temeria" -   Forex Expert Advisor for dispersal of small deposits Statistics after testing in MT4 (EURGBP M30, 2018 - 2023) Initial balance: $10,000 Net profit: $240,900 Maximum drawdown: 2.11% Profitability: 3.74 Description: The Temeria Expert Advisor is designed specifically for the rapid acceleration of small deposits, providing a high level of profit. It is based on several indicators that ensure effective trading. The results of testing over the past five years indicate its stable perfo
Sakaar Expert Advisor for XAUUSD (M30) Sakaar is an automated trading system specifically designed for trading gold (XAUUSD) on the M30 timeframe. The advisor’s algorithm is based on a combination of three technical indicators: Top Bottom Price ATR MA Oscillator Previous High Low The EA uses a reliable risk management system: every trade includes a stop loss and take profit, and position sizing is based on a percentage lot model , allowing the system to adapt to the current balance and scale tra
特別オファー:最初の10名の購入者には特別な低価格が適用され、その後価格が上がります。この機会に、信頼性の高いアドバイザーを割引価格で手に入れるユニークなチャンスです。 Stellaris アドバイザーは、過去10年間のテストで70%の高い勝率を誇ります。 EUR/GBP ペアの M30 タイムフレーム専用に設計されていますが、パラメータの最適化によって他の通貨ペアにも適用可能です。戦略は、主要なツールである Steady Bands および Donchian Channel を含む、いくつかの強力なインジケーターに基づいています。これにより、取引のエントリーとエグジットに正確なシグナルを提供します。 10年間のバックテスト結果は高いパフォーマンスを示しています: 初期残高 :100ドル 純利益 :3,013,278ドル 勝率 :70% 最大ドローダウン :9% リアルアカウントで使用する前に、最小限のリスクでテストを行い、ブローカーでの正しい動作を確認することをお勧めします。 その他の製品やテスト結果はこちらから確認できます: [製品へのリンク] 。
このアドバイザーは、EUR/GBP通貨ペアをM30タイムフレームで取引するために設計されていますが、初期テストを経て、最小限のリスクで他の主要通貨ペアでも使用することが可能です。アドバイザーの設定では、ロットサイズを調整でき、ユーザーの好みに合わせてカスタマイズが可能です。 主な特徴: Steady Bands と Bollinger Bands インジケーターに基づき、他の取引システム要素と組み合わせて動作します。 全てのインジケーター条件が一致し、取引戦略の追加条件が満たされた場合にのみ取引を開始します。 テスト結果(2020年~現在): 初期デポジット: $100 純利益: $624,880 最大ドローダウン: 9%(1取引あたりのリスク5%; 設定でリスクを減少可能)。 勝率: 75% 推奨事項: 効率を高めるため、スプレッドが低く固定されている口座を使用してください。 実際の口座で使用する前に、最低限のリスクでデモ口座でアドバイザーをテストし、その安定性と適切な設定を確認してください。 このアドバイザーは、高い収益性と緻密なリスク管理、柔軟な設定を組み合わせており、多様な取引
Roobi
Yury Emeliyanov
特別オファー: 最初の10名の購入者には特別な低価格が適用され、その後は価格が上昇します。これは、割引価格でアドバイザーを購入できる貴重な機会です。 Roobiアドバイザー は、過去 5年間 のテストで 73% の高い利益率を達成しました。 EUR/GBP M30 通貨ペア向けに設計されていますが、パラメータを最適化することで他の通貨ペアにも適用可能です。その動作は、 Steady Bands や Moving Average などの強力なインジケーターに基づいており、正確なエントリーおよびエグジットシグナルを提供します。 2020年以来のテスト結果は高い効率性を示しています: 初期残高: $200 純利益: $1,022,383 勝率: 73% リアルアカウントで使用する前に、最低リスクでテストを行い、お使いのブローカーで適切に動作することを確認することをお勧めします。 他の製品やテスト結果はこちらでご覧いただけます: [製品リンク]
Pinok
Yury Emeliyanov
Pinok は EURGBP(M30)向けのトレーディングアドバイザーで、前のバーの高値・安値のブレイクアウトと ATR MA オシレーターによるフィルターに基づいています。固定されたストップロスとテイクプロフィットで、指定された取引時間内に動作します。 ロジック 買いエントリー: オープン価格が前のバーの安値より低く、かつ ATR MA オシレーターがゼロ未満の場合。 売りエントリー: オープン価格が前のバーの高値より高く、かつ ATR MA オシレーターがゼロ未満の場合。 エグジット: 固定のテイクプロフィット(+90ポイント)またはストップロス(-400ポイント)。 取引: 取引量 — 預金の2%。 テスト統計(2018–2025) 初期預金: 500ドル 総利益: +6279ドル プロフィットファクター: 2.36 最大ドローダウン: 30.52% 総取引回数: 256回 勝率: 74% ️ 重要: 実際の口座で使用する前に、必ずデモ口座またはストラテジーテスターでテストしてください。過去の結果は将来の利益を保証するものではありません。 その他の製品とテスト結果はこちら
KazePro — Japanese Precision in Forex Trading KazePro is a modern Expert Advisor designed for stable growth of small deposits with controlled risk. It combines speed, accuracy, and disciplined money management — bringing the spirit of Japanese precision into Forex trading. The algorithm focuses on clean entry points and time-based logic, opening trades only when the market shows strong reversal or impulse potential. Key Features Works best on pairs with the Japanese Yen ( JPY ) Optimized f
Three Bar Reversal Expert Advisor An automated trading robot based on the classic Three Bar Reversal pattern. Optimized for the D1 timeframe , where signals are more stable and statistically reliable. ️ Features: Strategy based on a 3-bar reversal pattern with impulse strength filtering Customizable risk/reward ratio ( RiskRewardRatio ) Limit on the number of simultaneous trades ( MaxOrders ) Suitable for all instruments with strong volatility Backtest Results (EURUSD, D1, 2010–2025): N
Railway Tracks EA — Automated Trading Based on the "Railway Tracks" Pattern Railway Tracks EA is an expert advisor that trades a powerful candlestick reversal pattern known as “Railway Tracks.” It automatically detects signals from two strong opposite-direction candles and places trades with a customizable risk/reward ratio. Trading Logic: BUY : after a bearish candle followed by a bullish one. SELL : after a bullish candle followed by a bearish one. SL : placed beyond the extreme of the
フィルタ:
レビューなし
レビューに返信