Jonux Systems Bundle MT5
- インディケータ
-
Dennis John
 Dennis John - Founder of JONUX Systems | Precision Engineering for the Modern Trader
Welcome to my official MQL5 profile. - バージョン: 1.0
- アクティベーション: 10
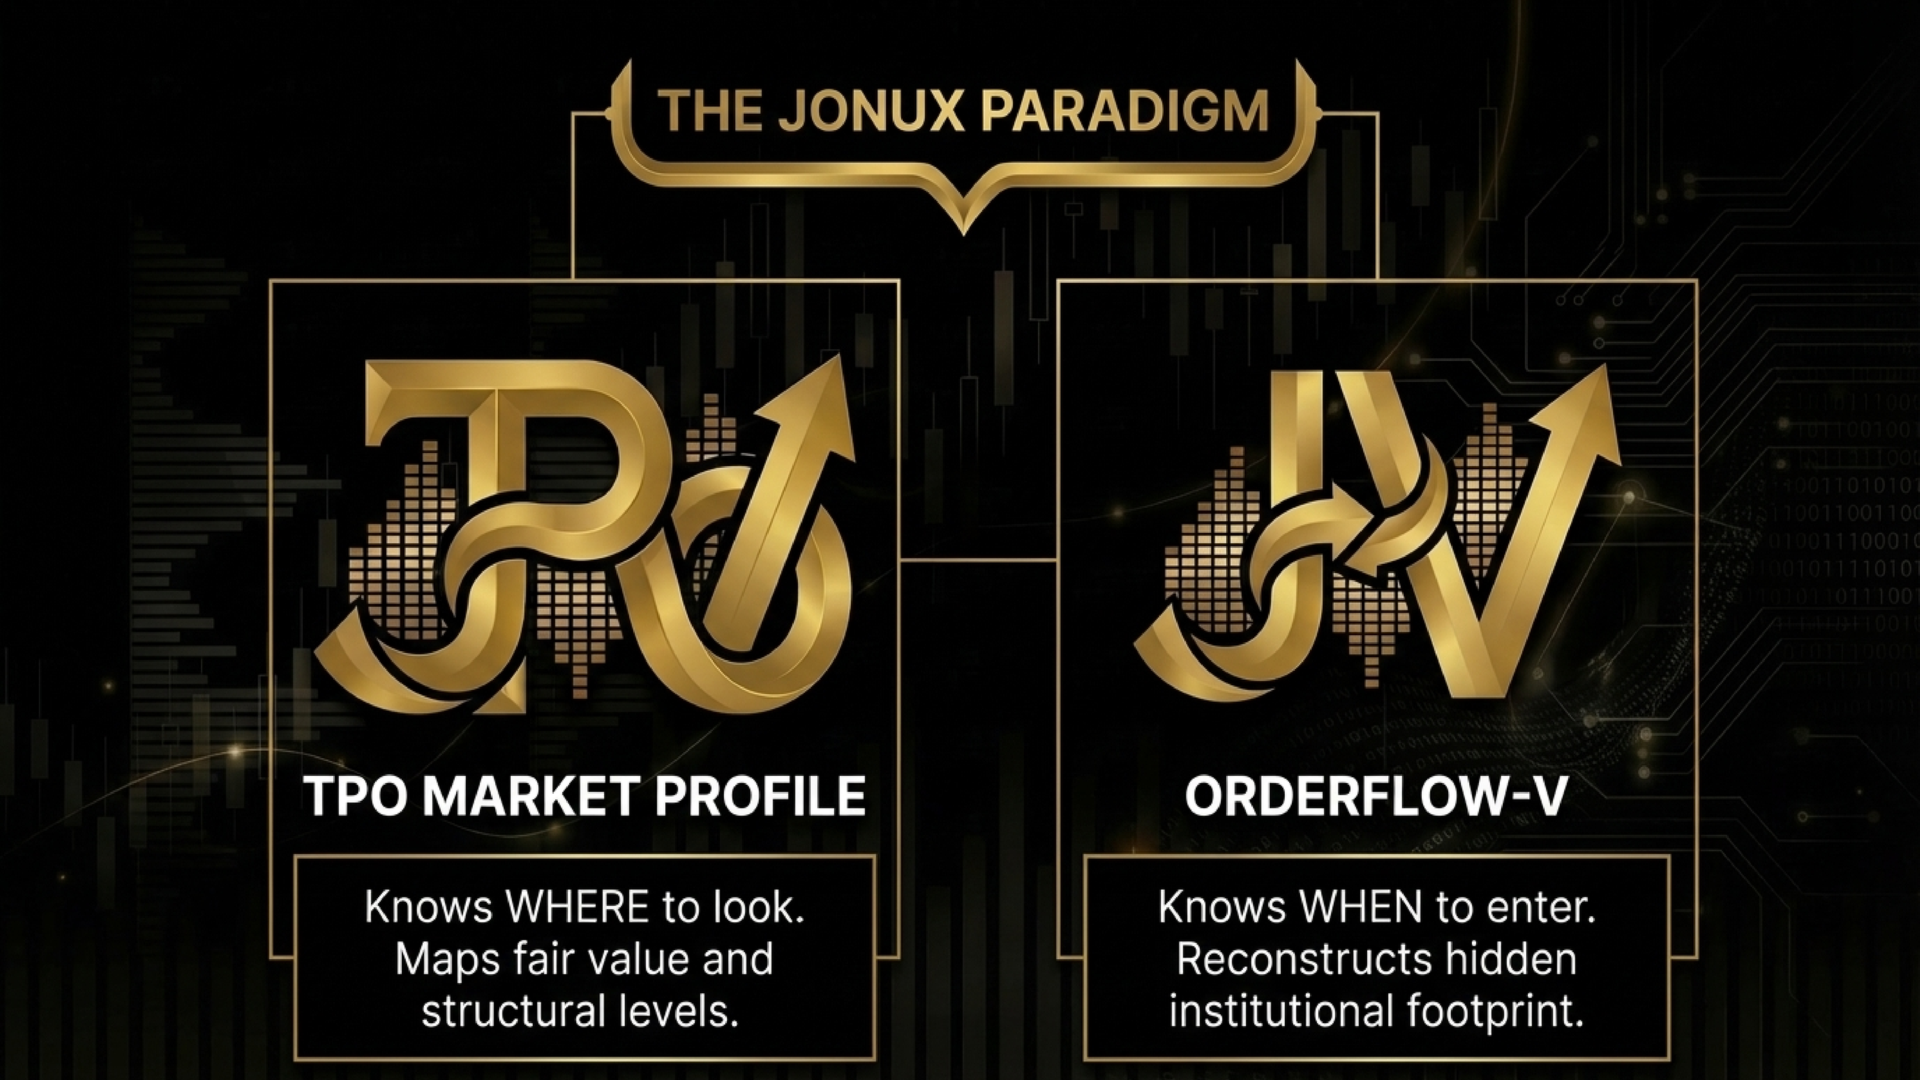
JONUX TPO and Orderflow-V Bundle for MT5
This technical bundle combines two specialized analytical tools for the MetaTrader 5 terminal: JONUX TPO Market Profile and JONUX Orderflow-V. The combination is designed to provide a comprehensive view of market structure and directional price pressure within a single analytical framework.
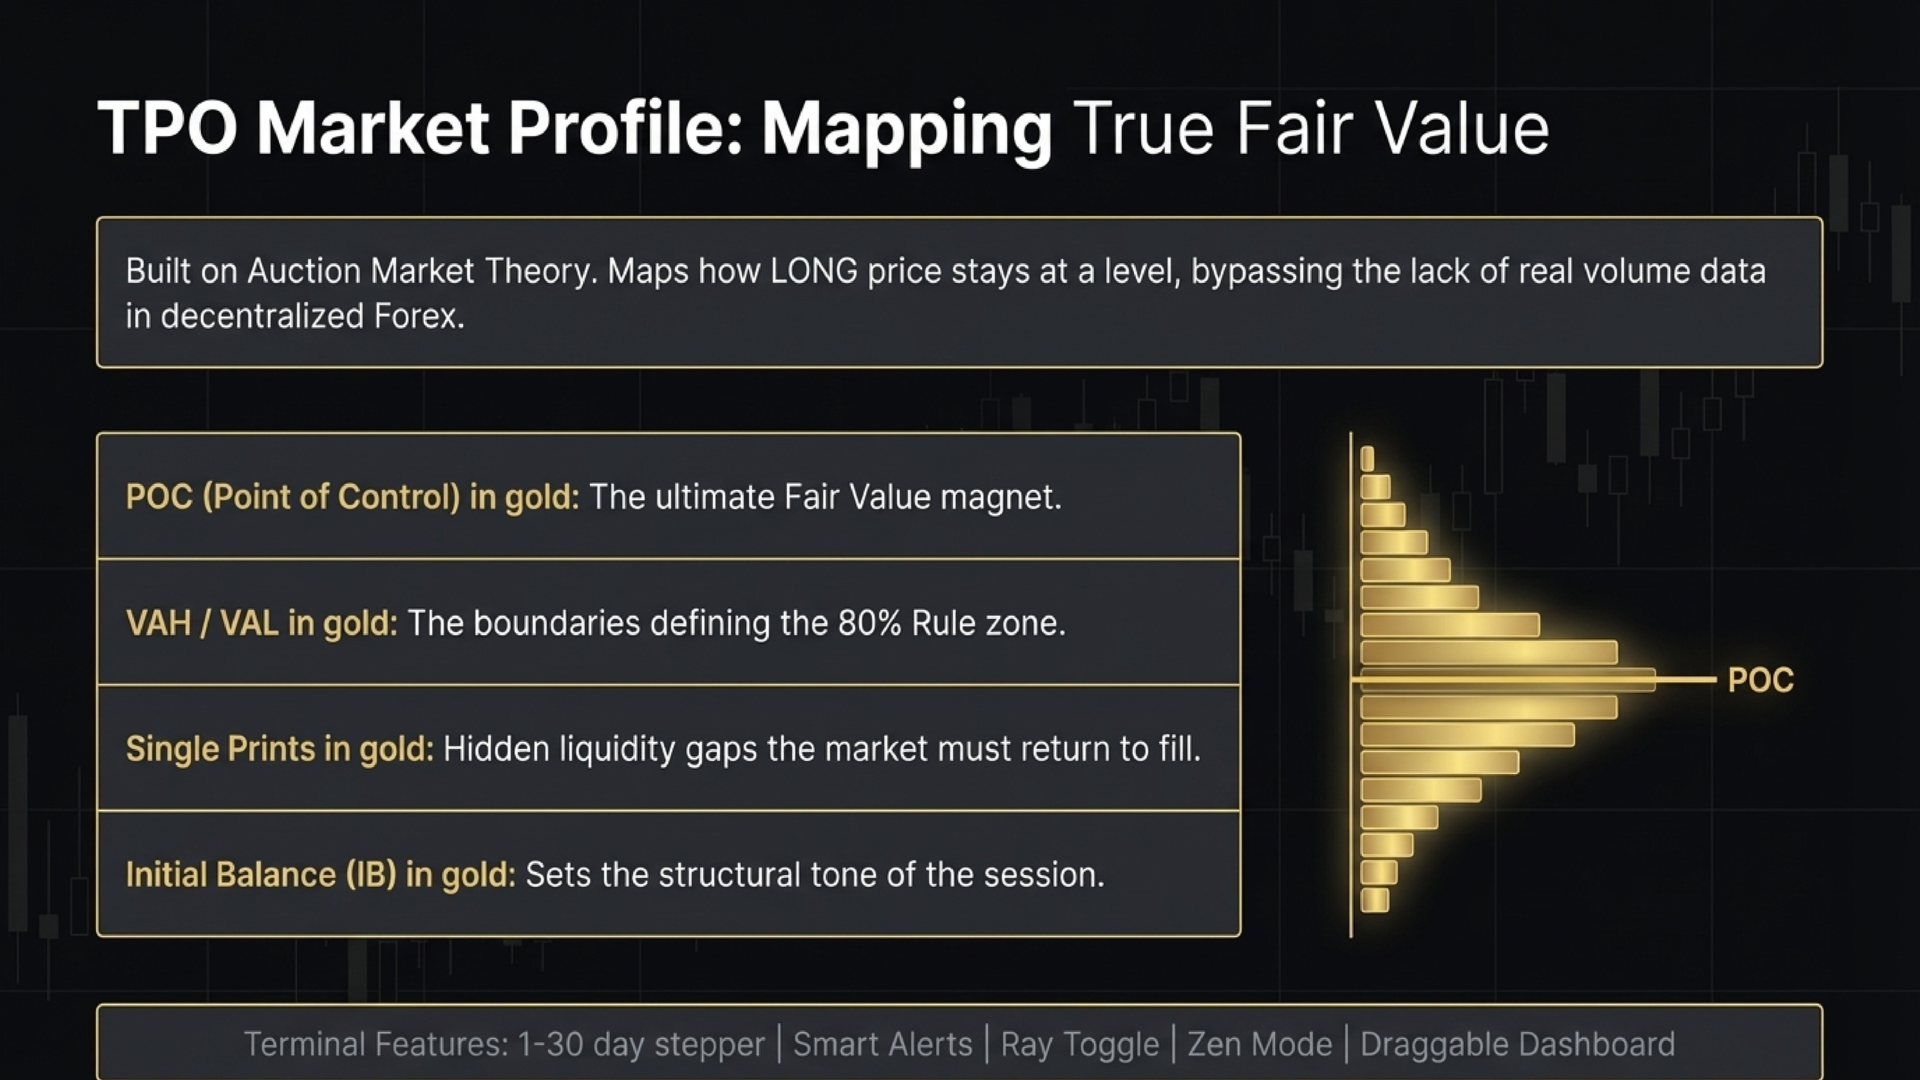
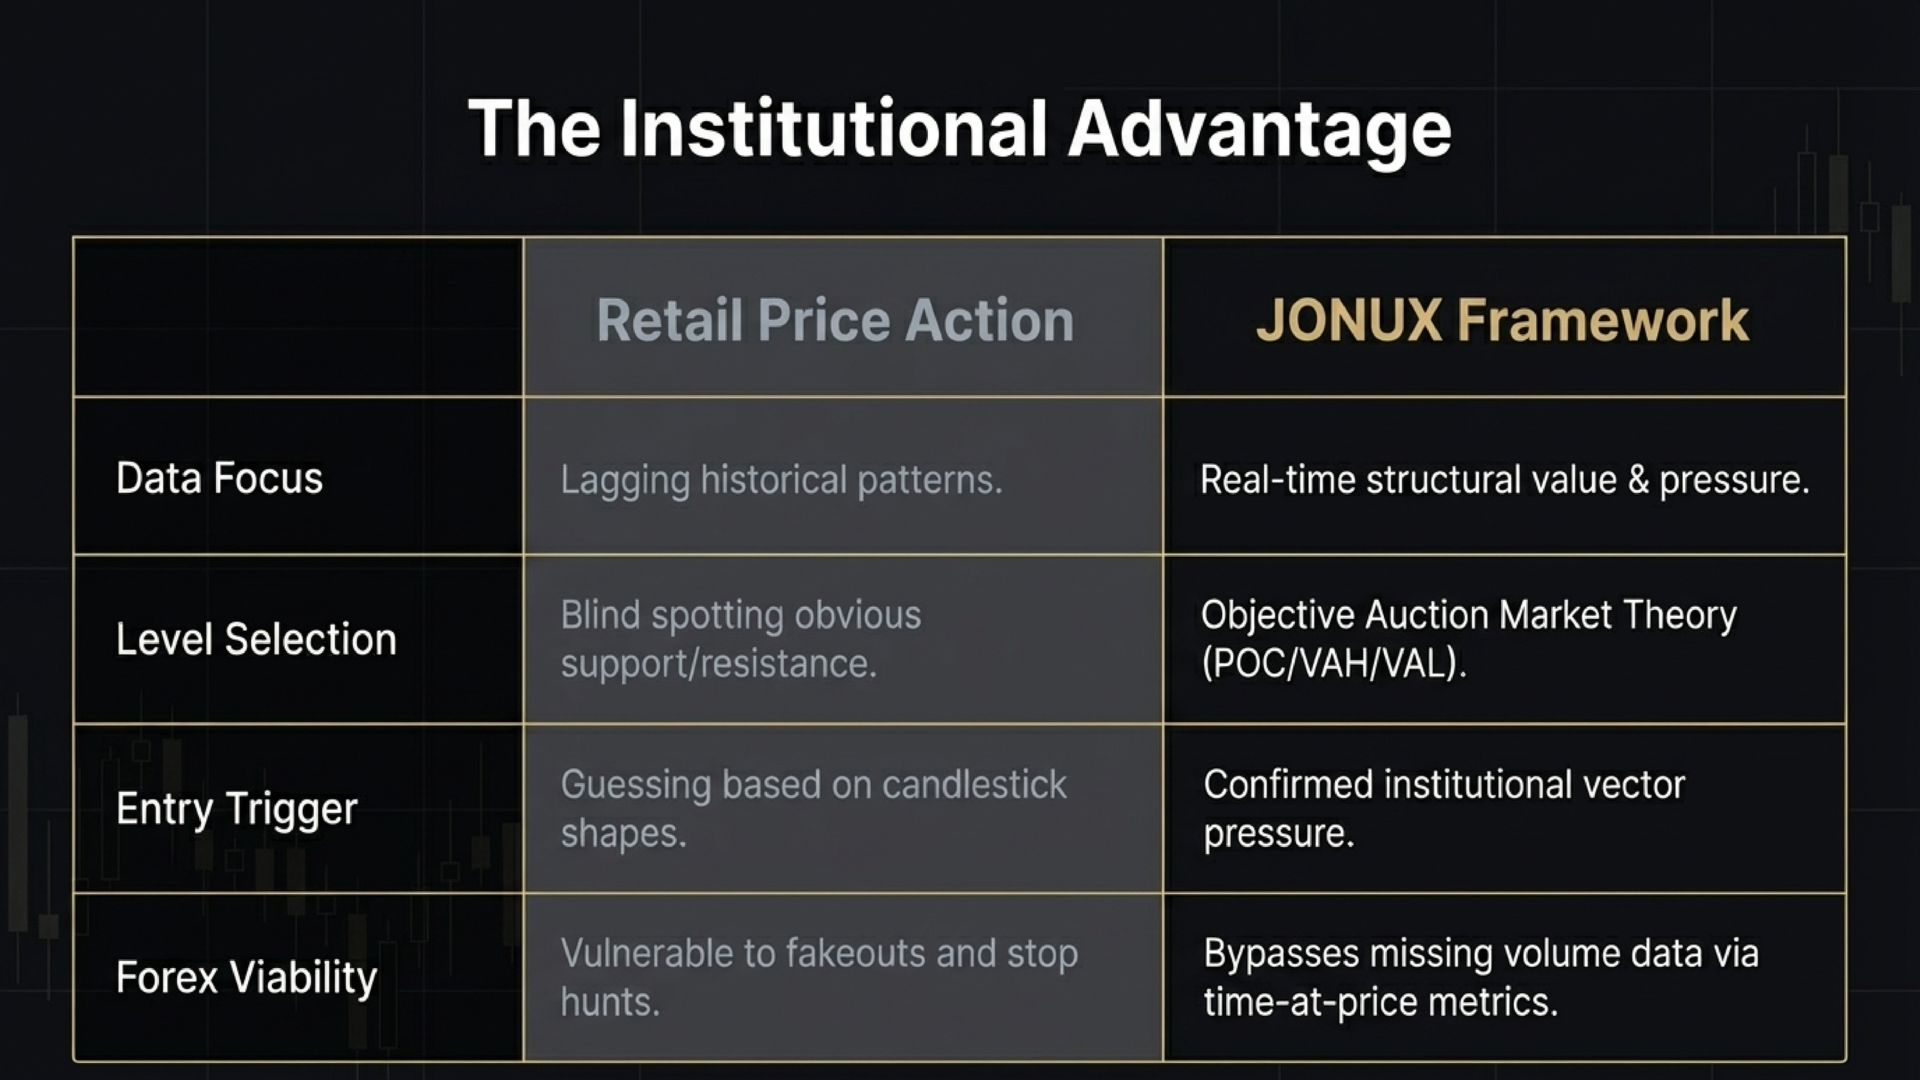
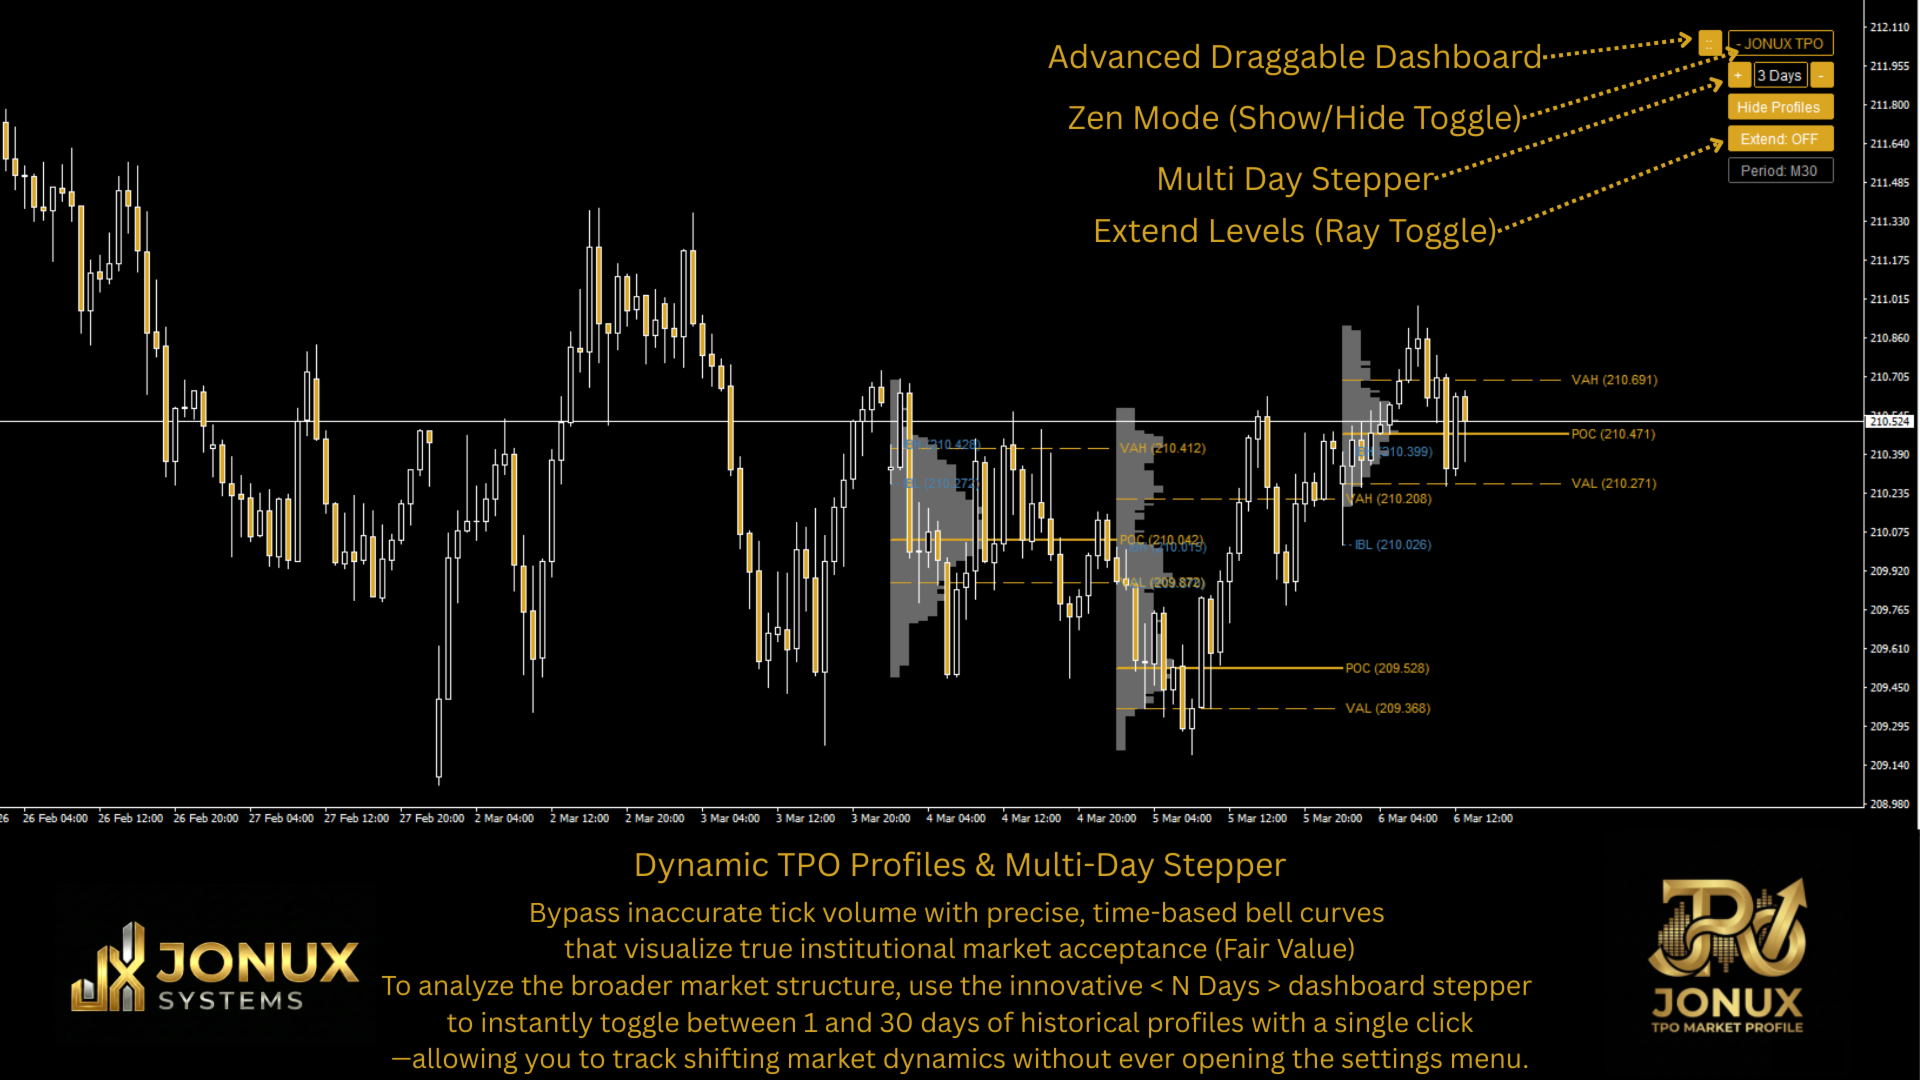
1. JONUX TPO Market Profile — Structural Analysis The TPO (Time Price Opportunity) component identifies price levels based on the time spent at specific quotes during a session. It utilizes Auction Market Theory principles to visualize market acceptance and rejection.
-
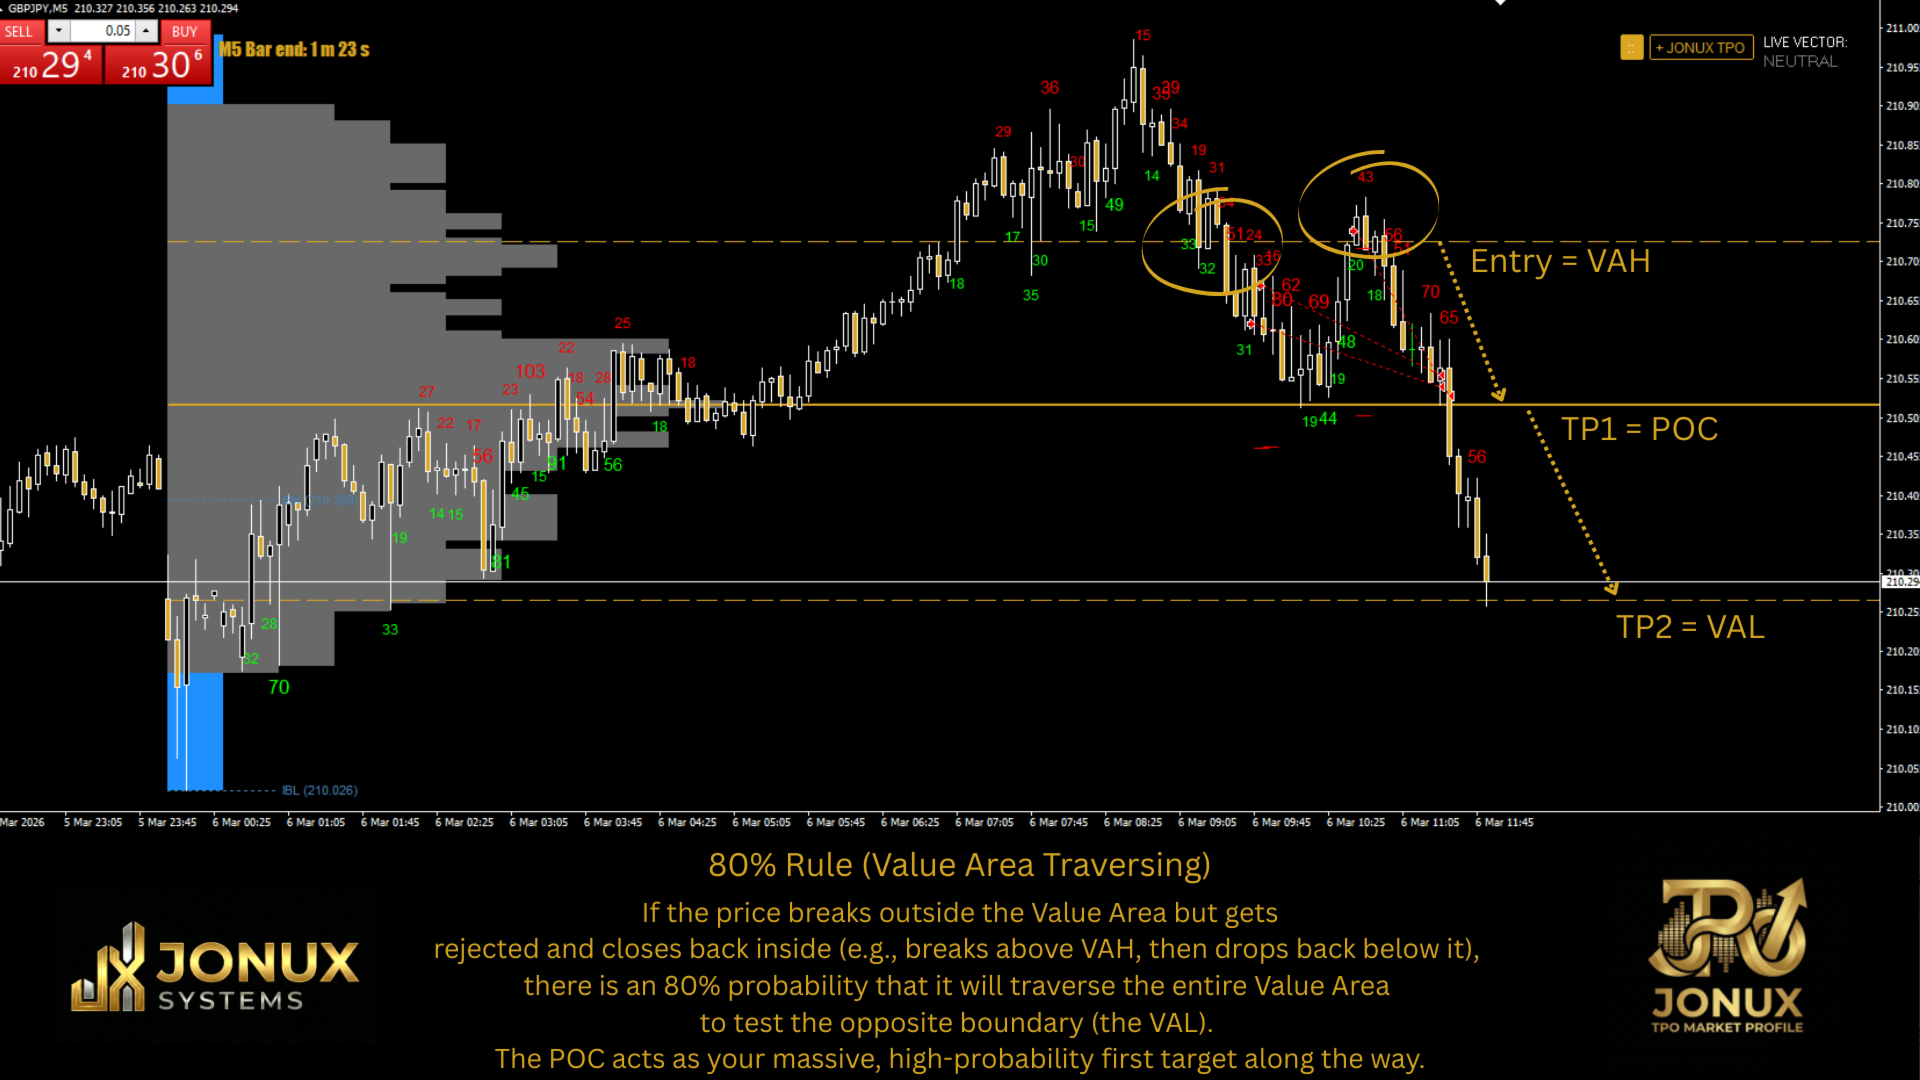
Point of Control (POC): Identifies the price level with the highest time-based concentration.
-
Value Area (VAH & VAL): Highlights the range where 70% of the session’s activity occurred.
-
Single Prints: Visualizes areas of rapid price discovery and structural gaps.
-
Initial Balance (IB): Defines the price range of the first hour of trading to establish session context.
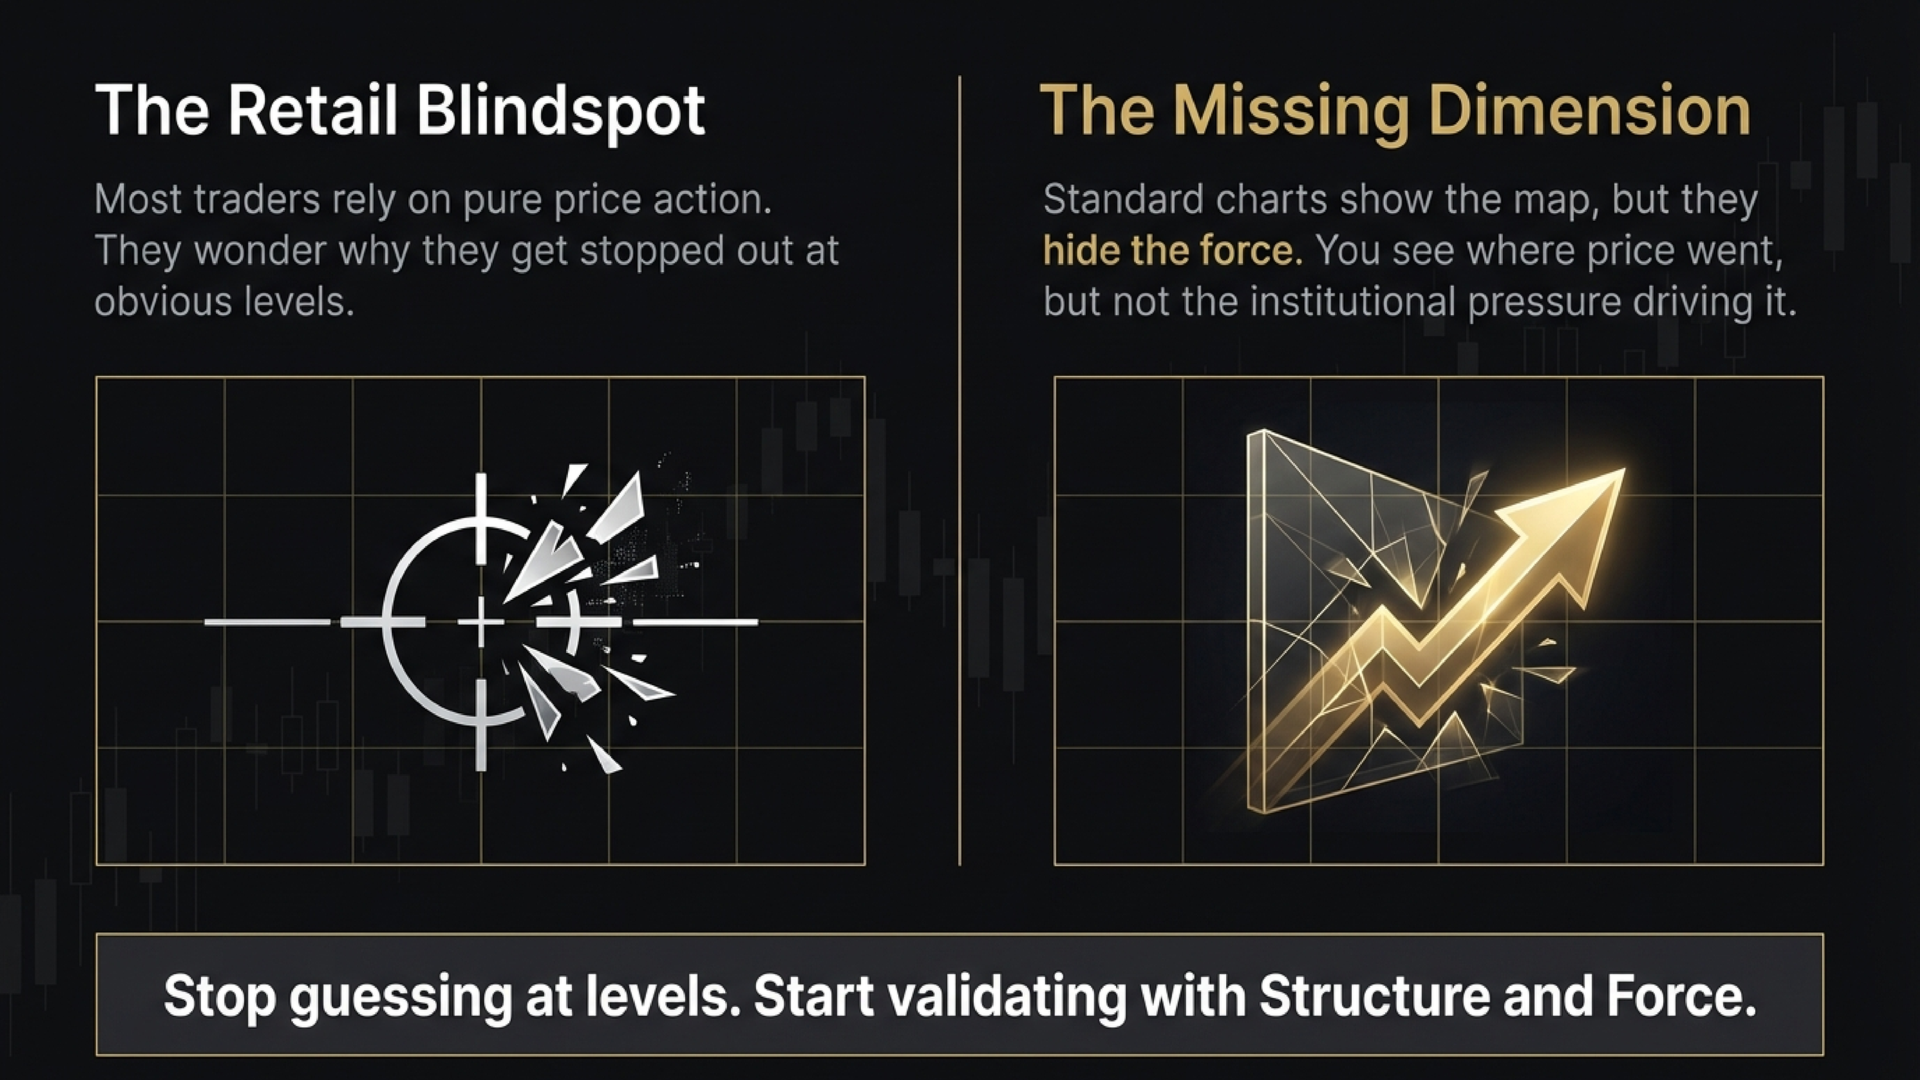
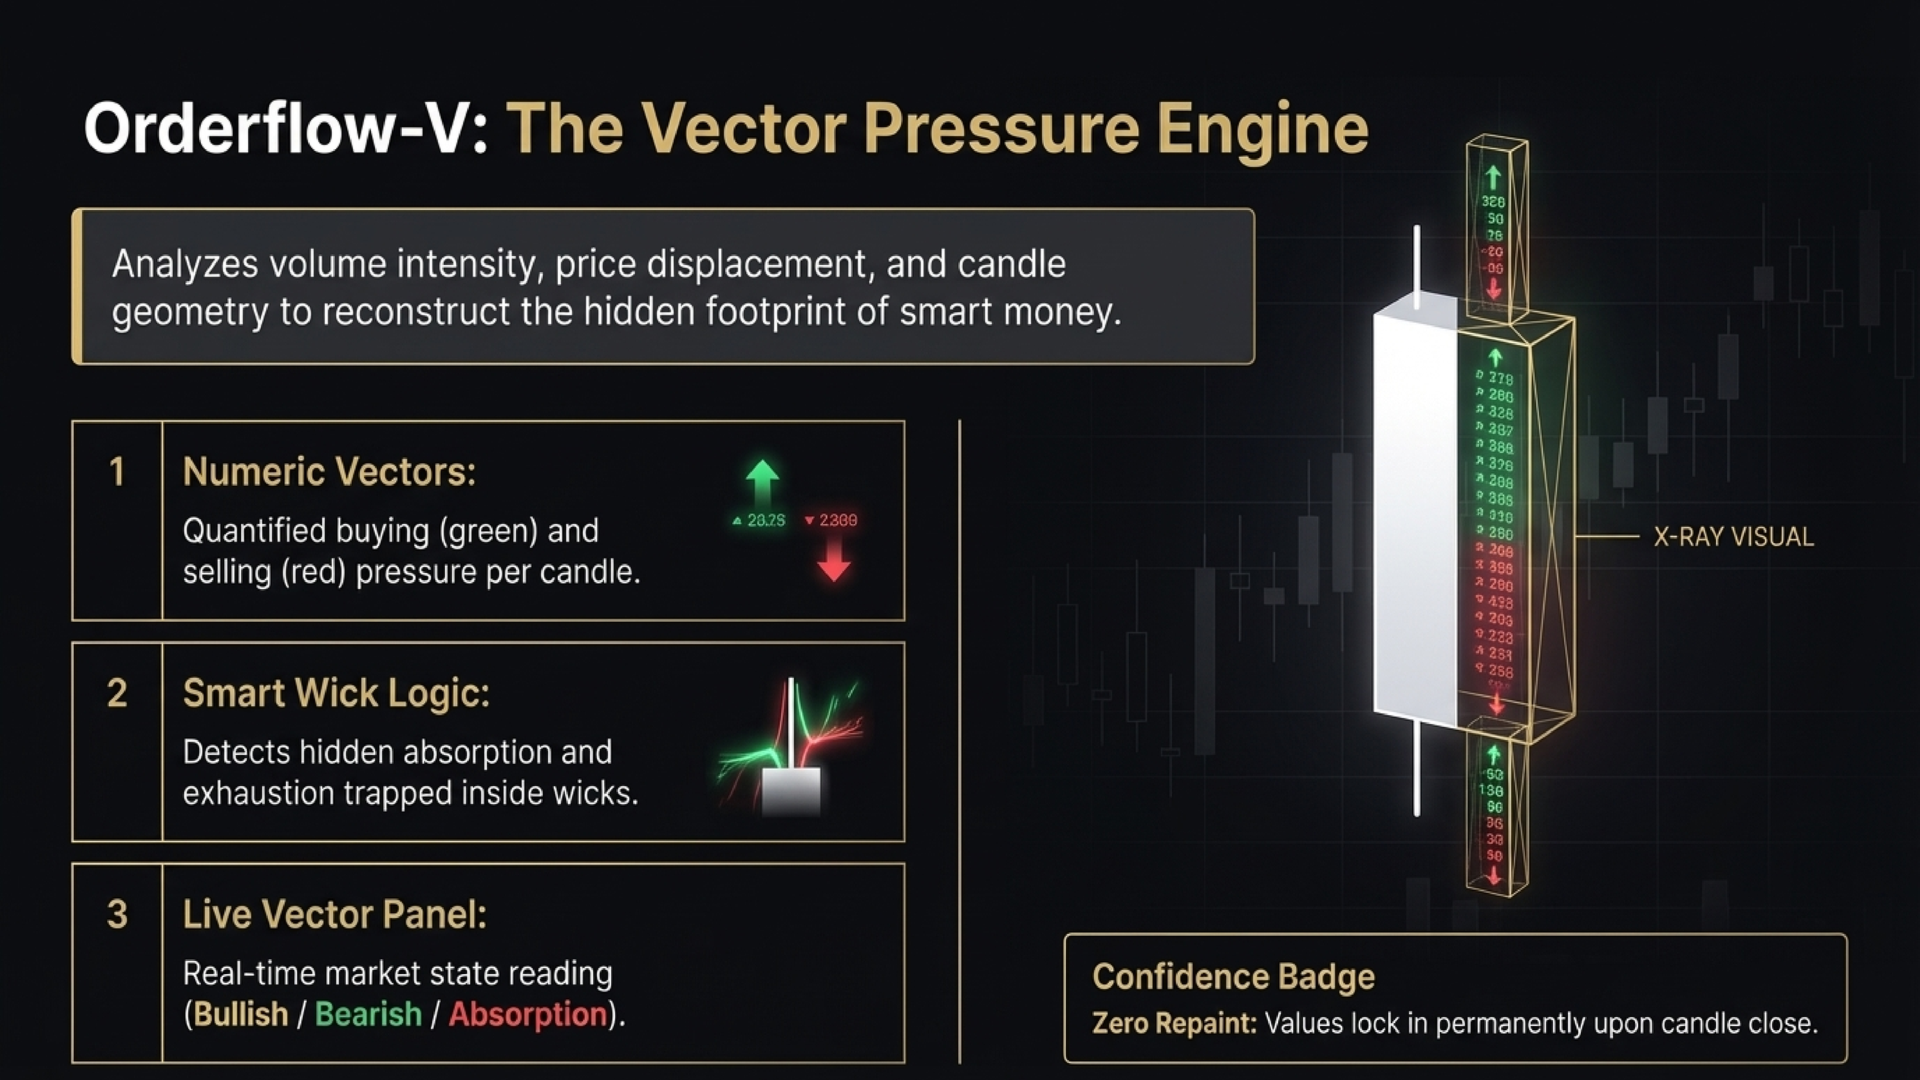
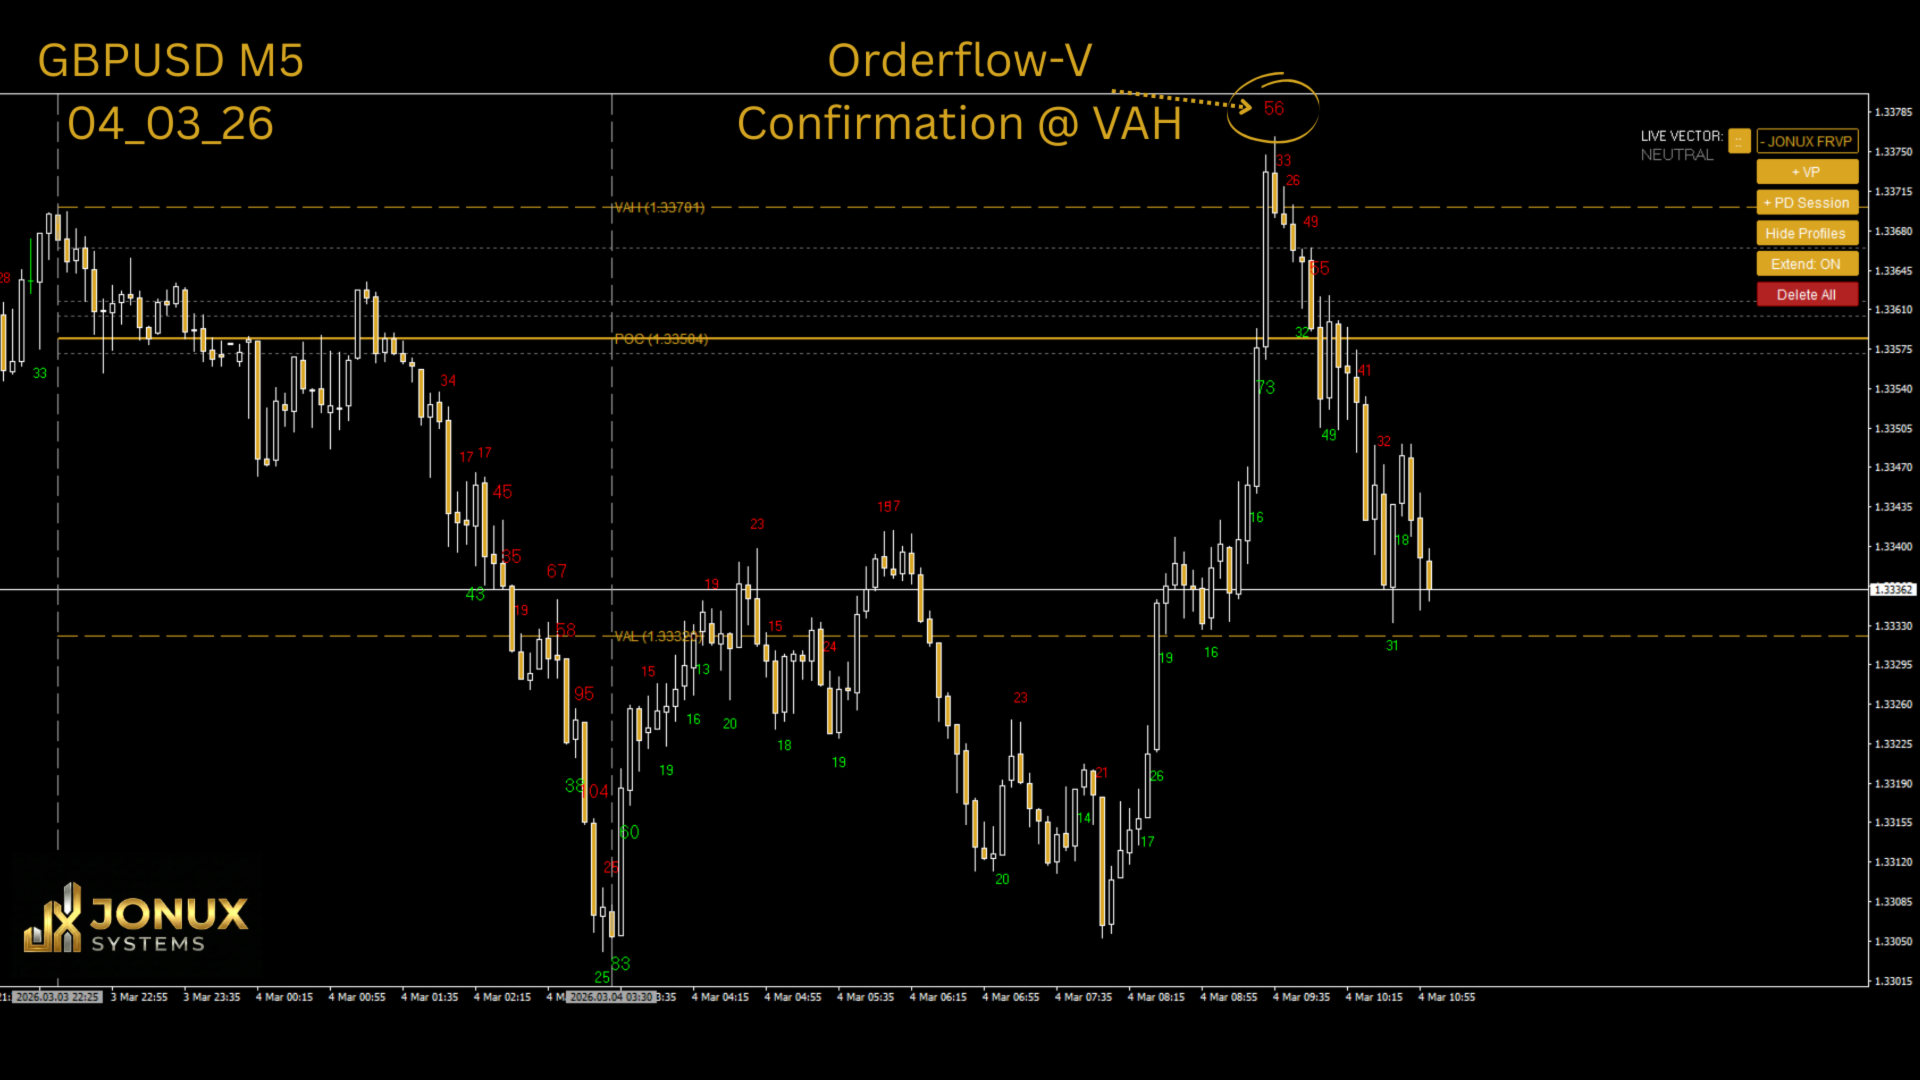
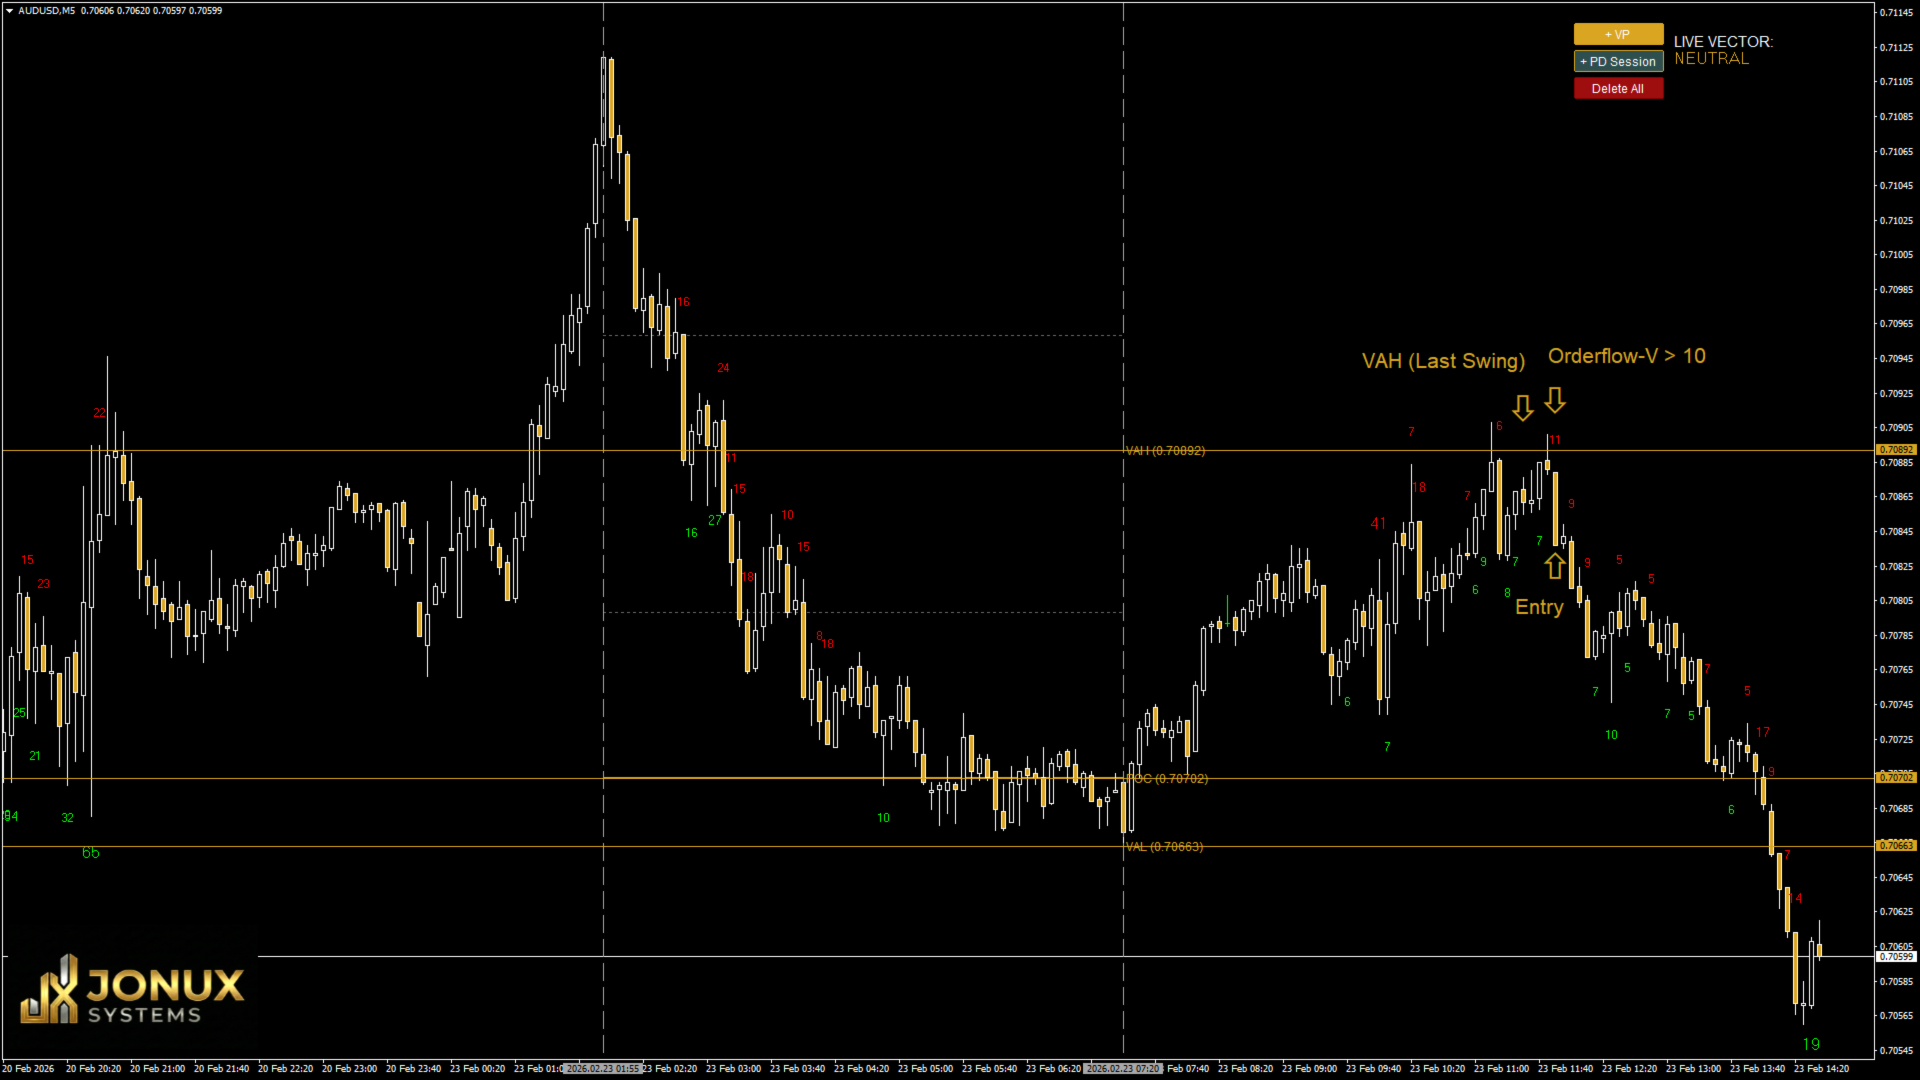
2. JONUX Orderflow-V — Pressure Analysis The Orderflow-V component provides a quantitative analysis of market activity. It evaluates the relationship between price displacement and tick volume to estimate the strength behind price movements.
-
Vector Calculation: Assigns a numeric value to each candle to represent buying or selling pressure.
-
Wick Evaluation: Analyzes price rejection within candle wicks to detect potential absorption.
-
Real-Time Dashboard: Displays the current calculated state of market pressure (Bullish, Bearish, or Neutral).
-
Non-Repainting: All values are fixed upon the close of the candle for consistent historical analysis.
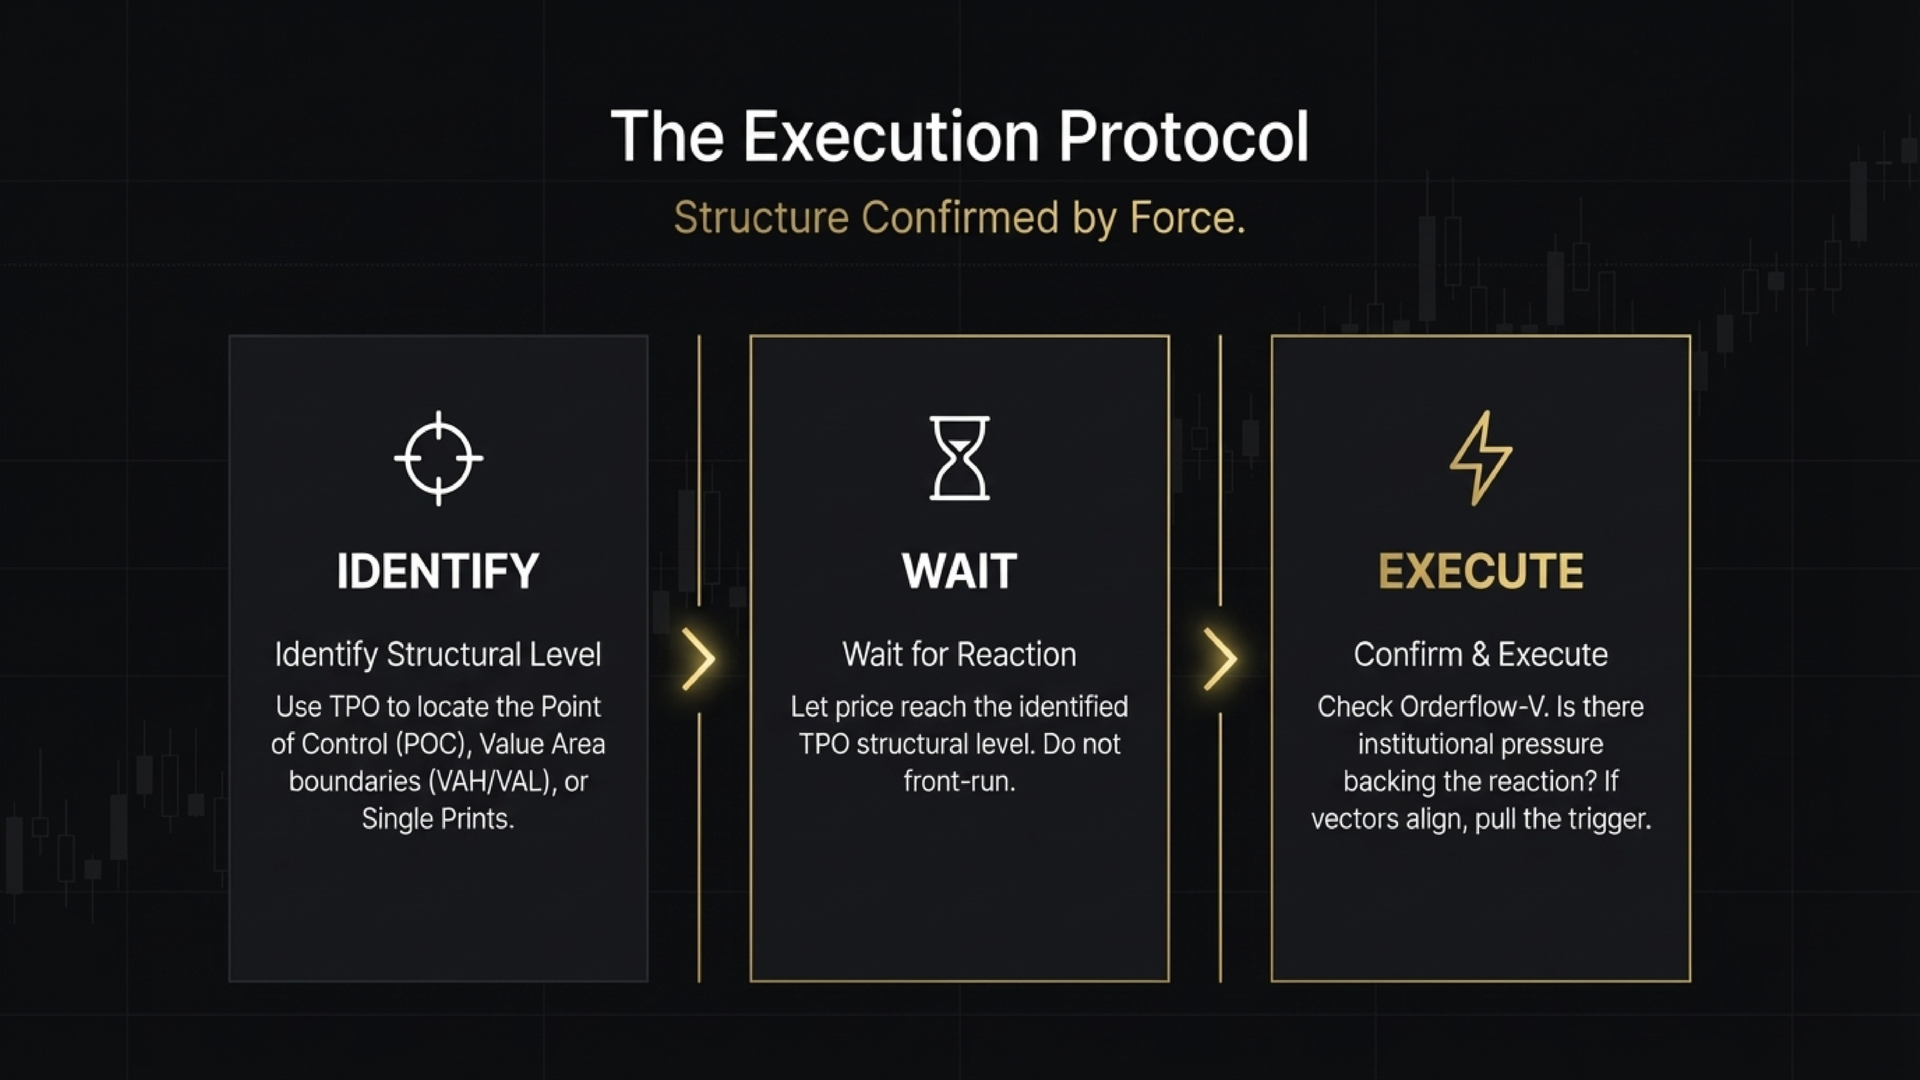
Integrated Workflow The tools are designed to be used in conjunction:
-
The TPO Market Profile identifies structural points of interest and equilibrium zones.
-
The Orderflow-V indicator provides a technical filter to analyze the activity once the price interacts with these structural levels. This combined approach assists in distinguishing between high-activity zones and low-conviction price moves.
Technical Features
-
Optimized for MT5: Both tools are engineered for high performance and low CPU usage.
-
On-Chart Controls: Interactive dashboards for session stepping and visual toggles (Zen Mode, Extend Levels).
-
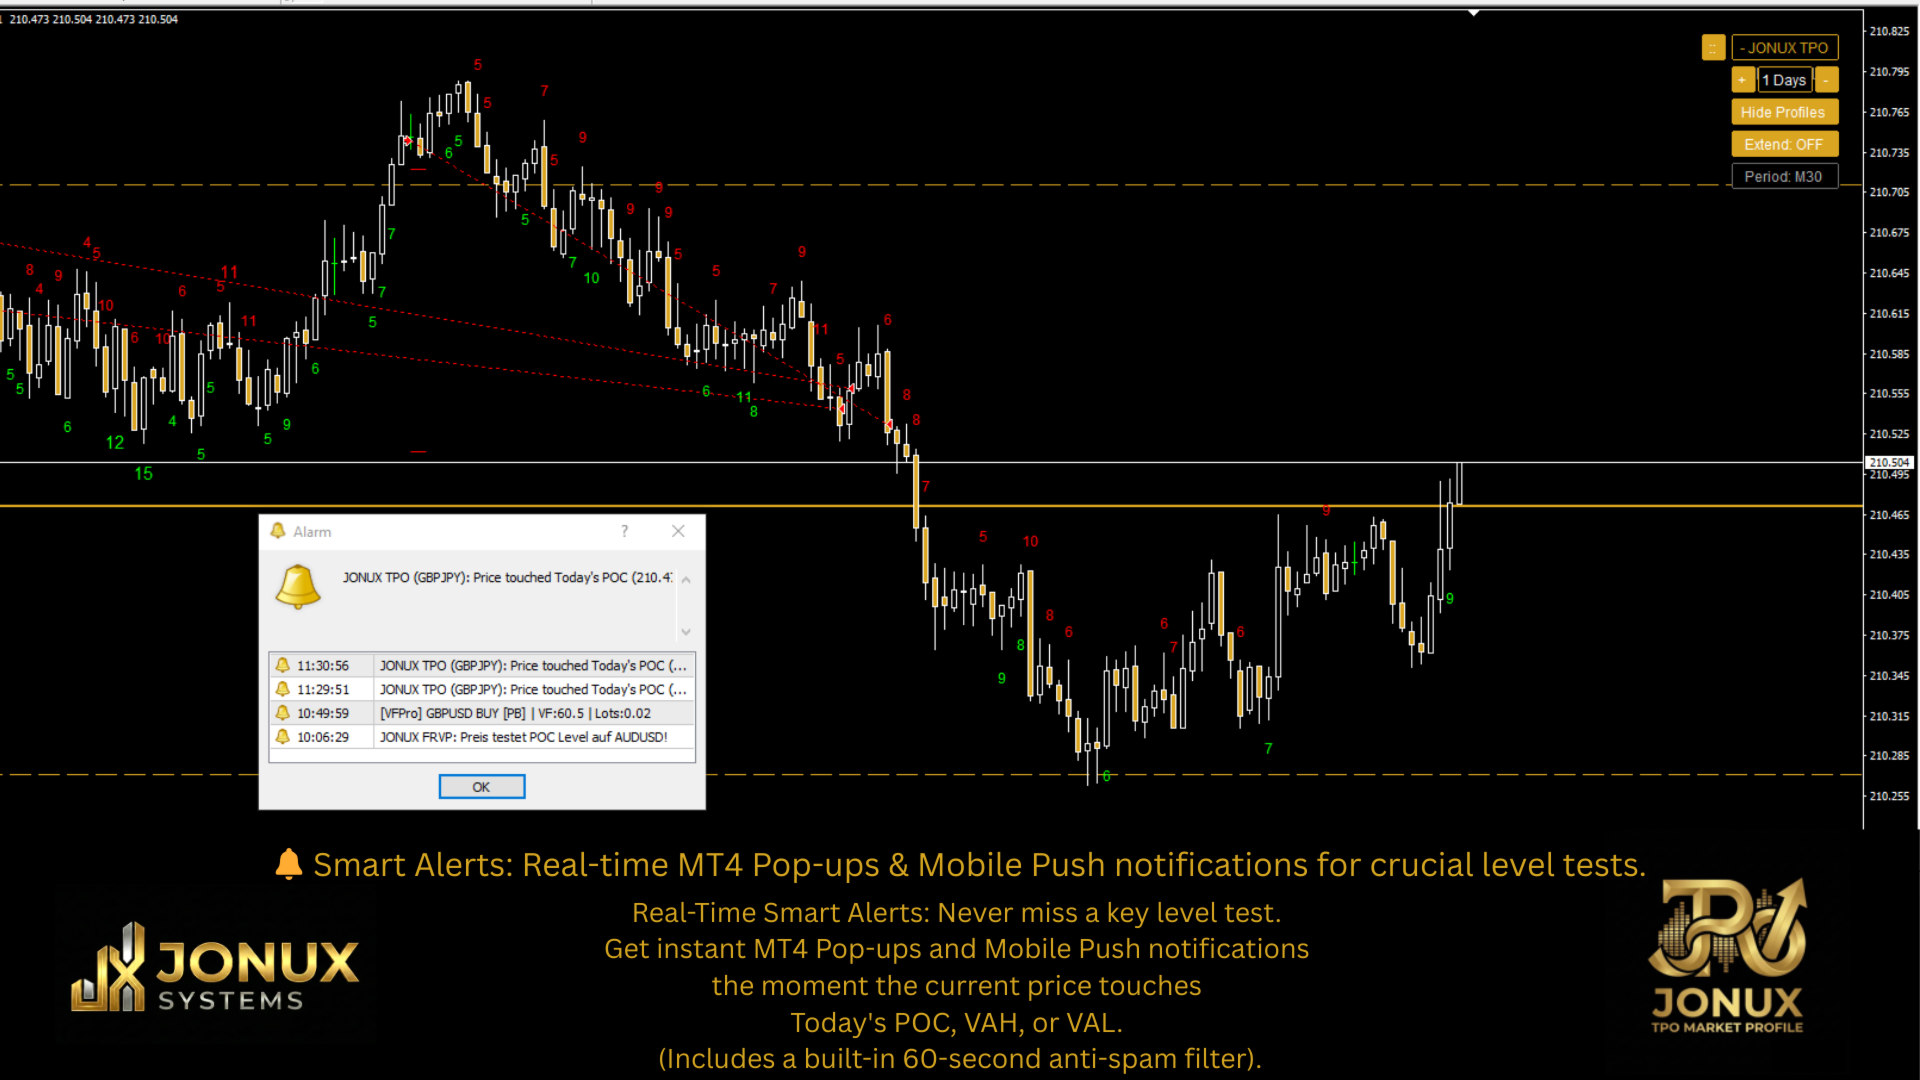
Alert Systems: Integrated notifications for price interaction with key structural levels.
-
No External Dependencies: No DLL imports required.
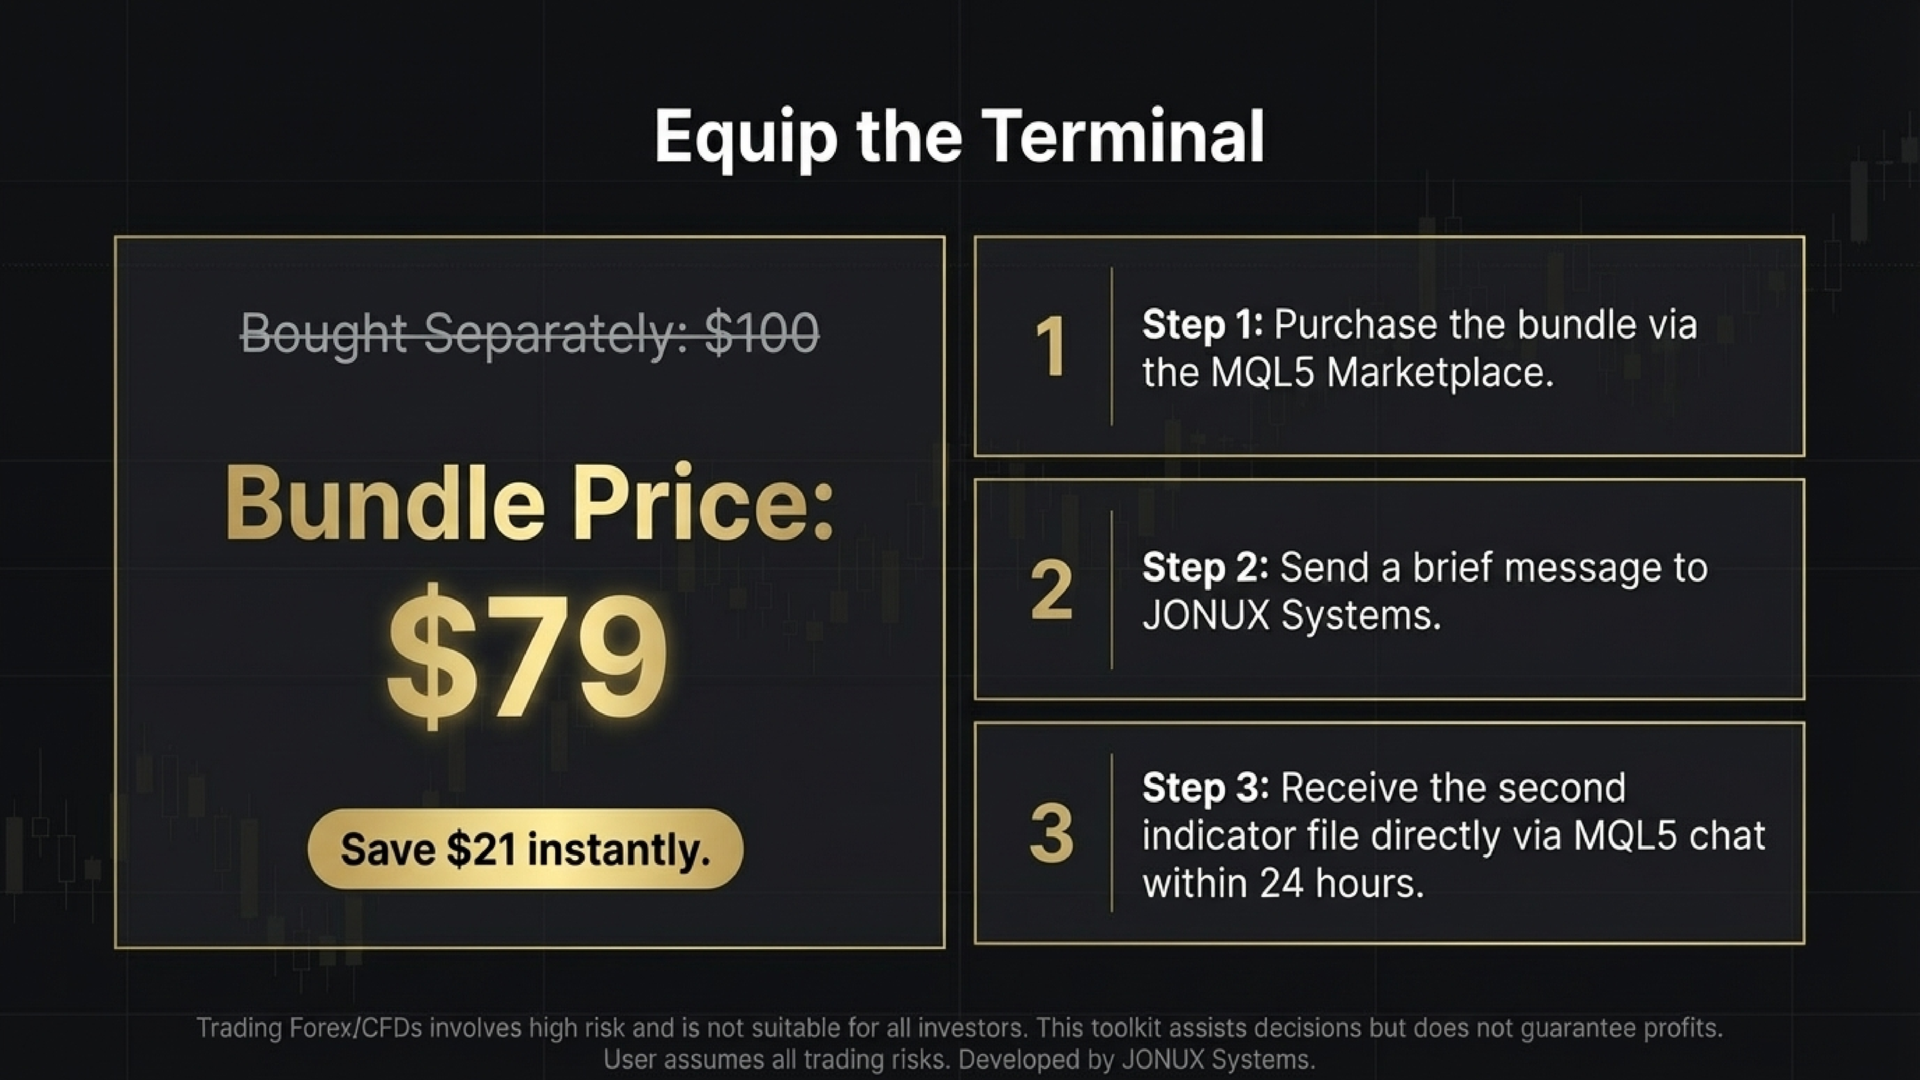
Strategy Tester & Demo Free demo versions are available for both indicators and are restricted to the MetaTrader 5 Strategy Tester. To evaluate the tools, please use the Strategy Tester in "Visual Mode".
Disclaimer Trading Forex, Gold, and CFDs involves a high level of risk. This bundle consists of technical analysis tools and does not provide trade signals or financial advice. Past performance and structural accuracy are not indicative of future market behavior. The user is solely responsible for all trading decisions and risk management.