SMC Engine Premium
- インディケータ
- バージョン: 1.0
- アクティベーション: 5

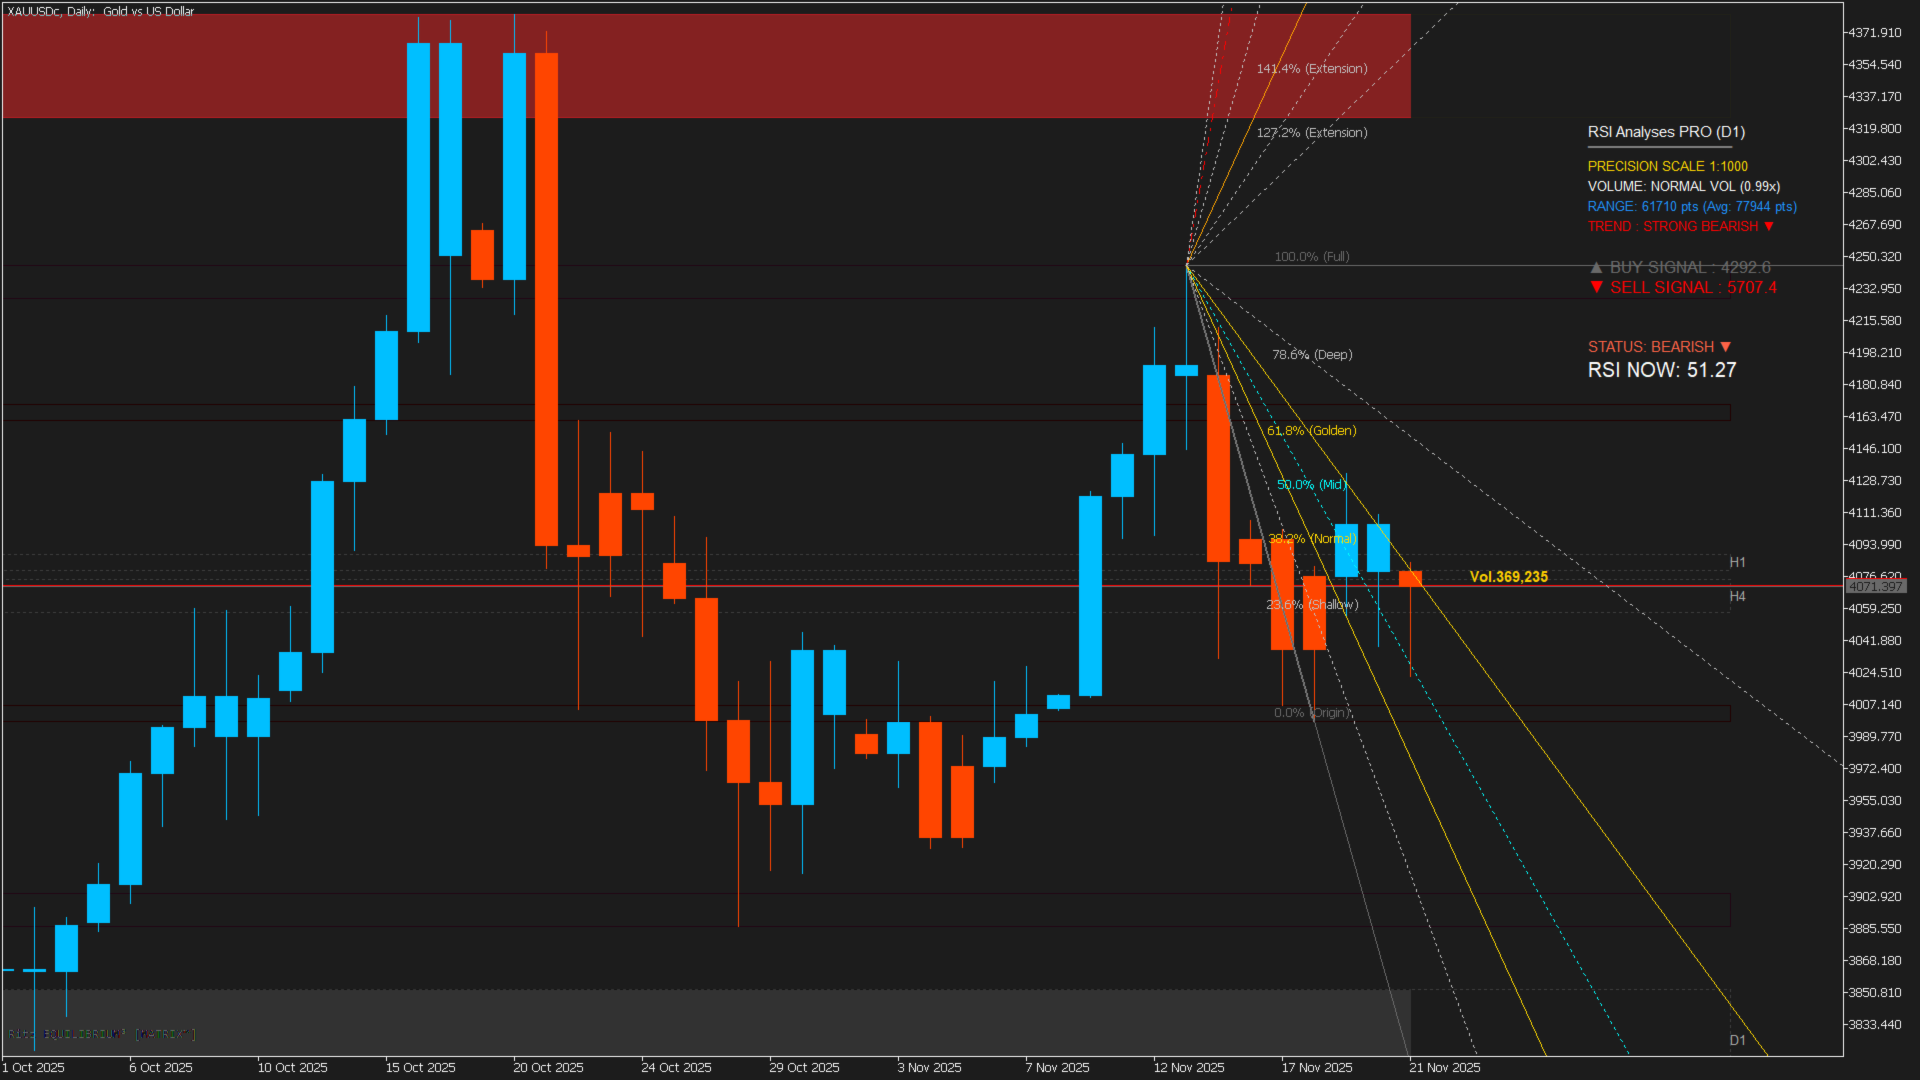
RITZ Quantum Market Structure Detection
Adaptive ZigZag + SMC Engine Gunakan Bersama Indikator : Equilibrium Matrix
RITZ Quantum Market Structure Detection adalah indikator generasi terbaru yang menggabungkan Adaptive ZigZag, Fractal Logic, RSI Strength Panel, dan Smart HH/HL/LH/LL Detection untuk membaca struktur pasar dengan presisi tinggi.
Dirancang untuk trader SMC, scalper, intraday, maupun swing trader yang membutuhkan market mapping yang akurat, ringan, dan real-time.
Indikator ini tidak hanya menggambar swing, tetapi memahami struktur, mendeteksi perubahan karakter (CHOCH), Break of Structure (BOS), equilibrium, hingga zona premium/discount secara otomatis.
Highlight-
Adaptive ZigZag + Fractal Intelligence
Swing tidak lagging dan menyesuaikan volatilitas ATR. -
Smart HH/HL/LH/LL Engine
Deteksi struktur terkonfirmasi, bukan hanya titik swing acak. -
Real-time BOS & CHOCH Detection
Alert presisi tanpa false trigger dari bar yang belum fix. -
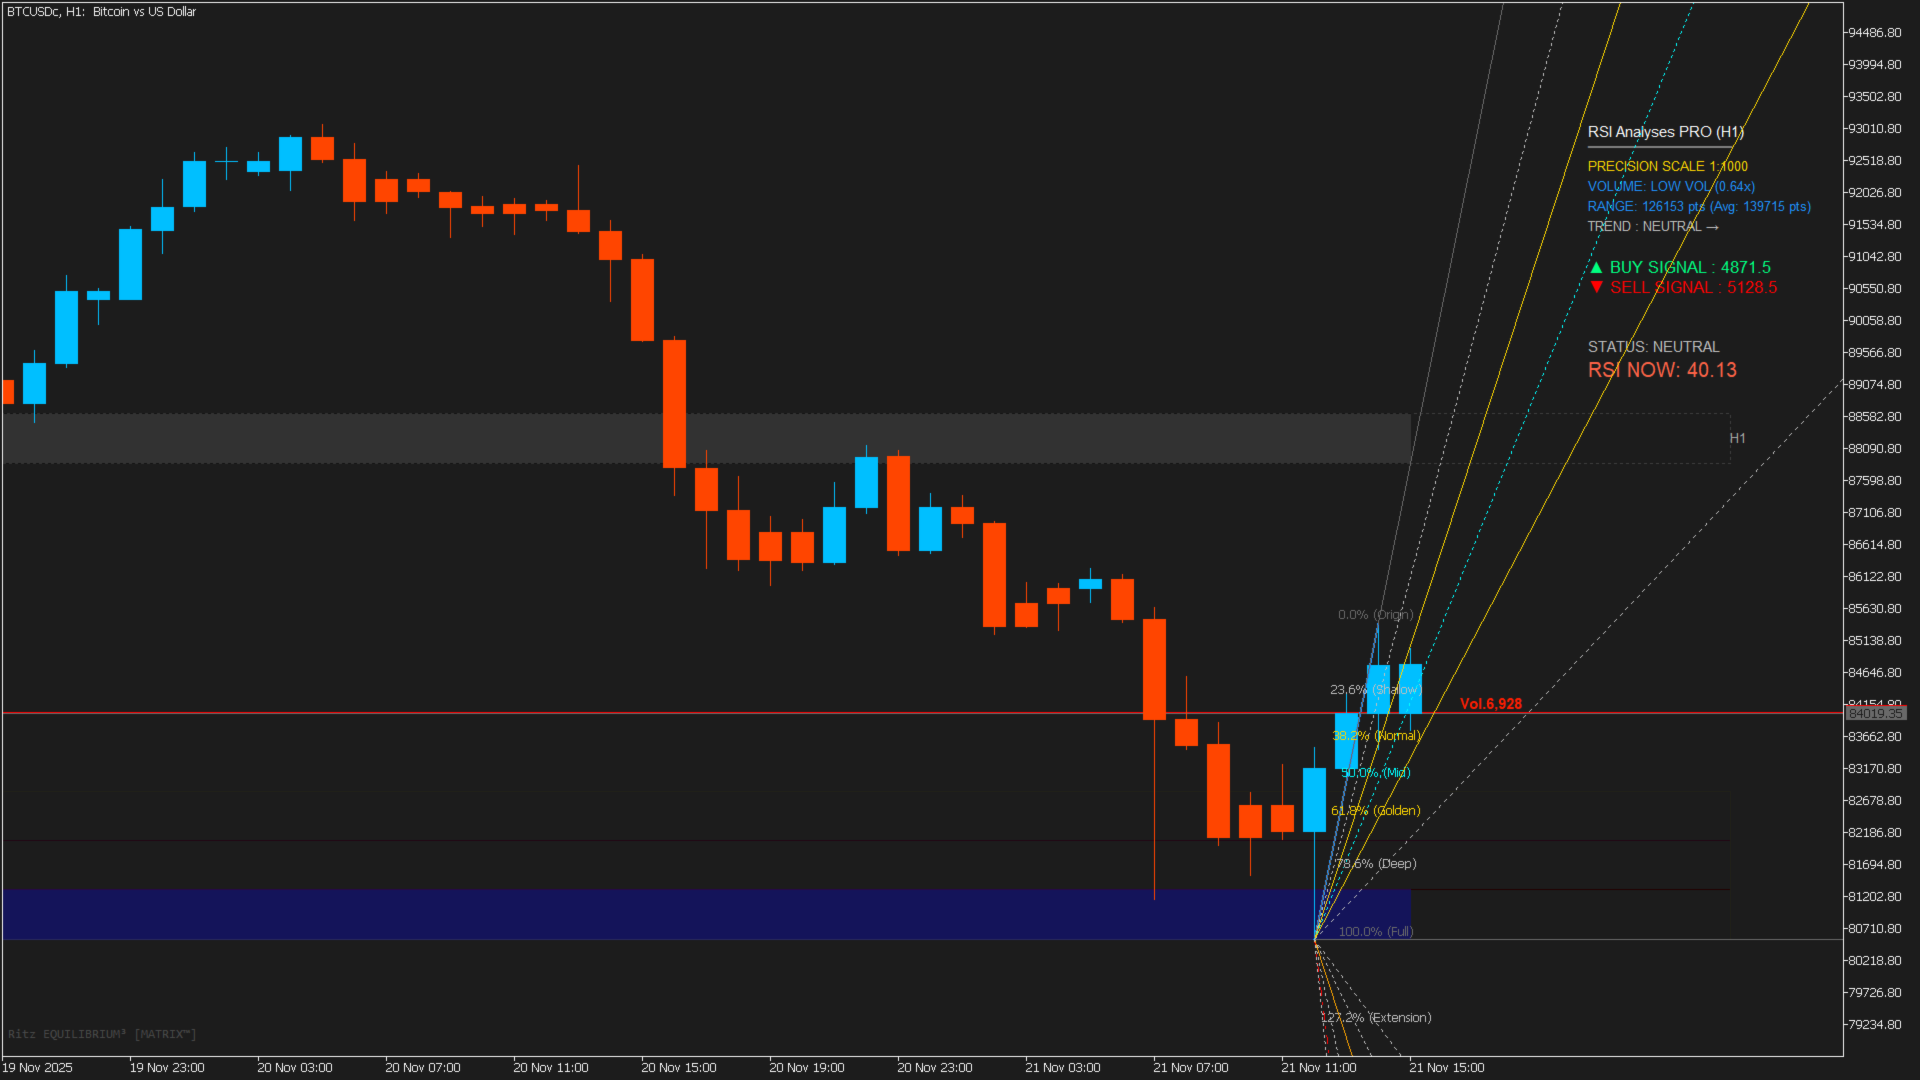
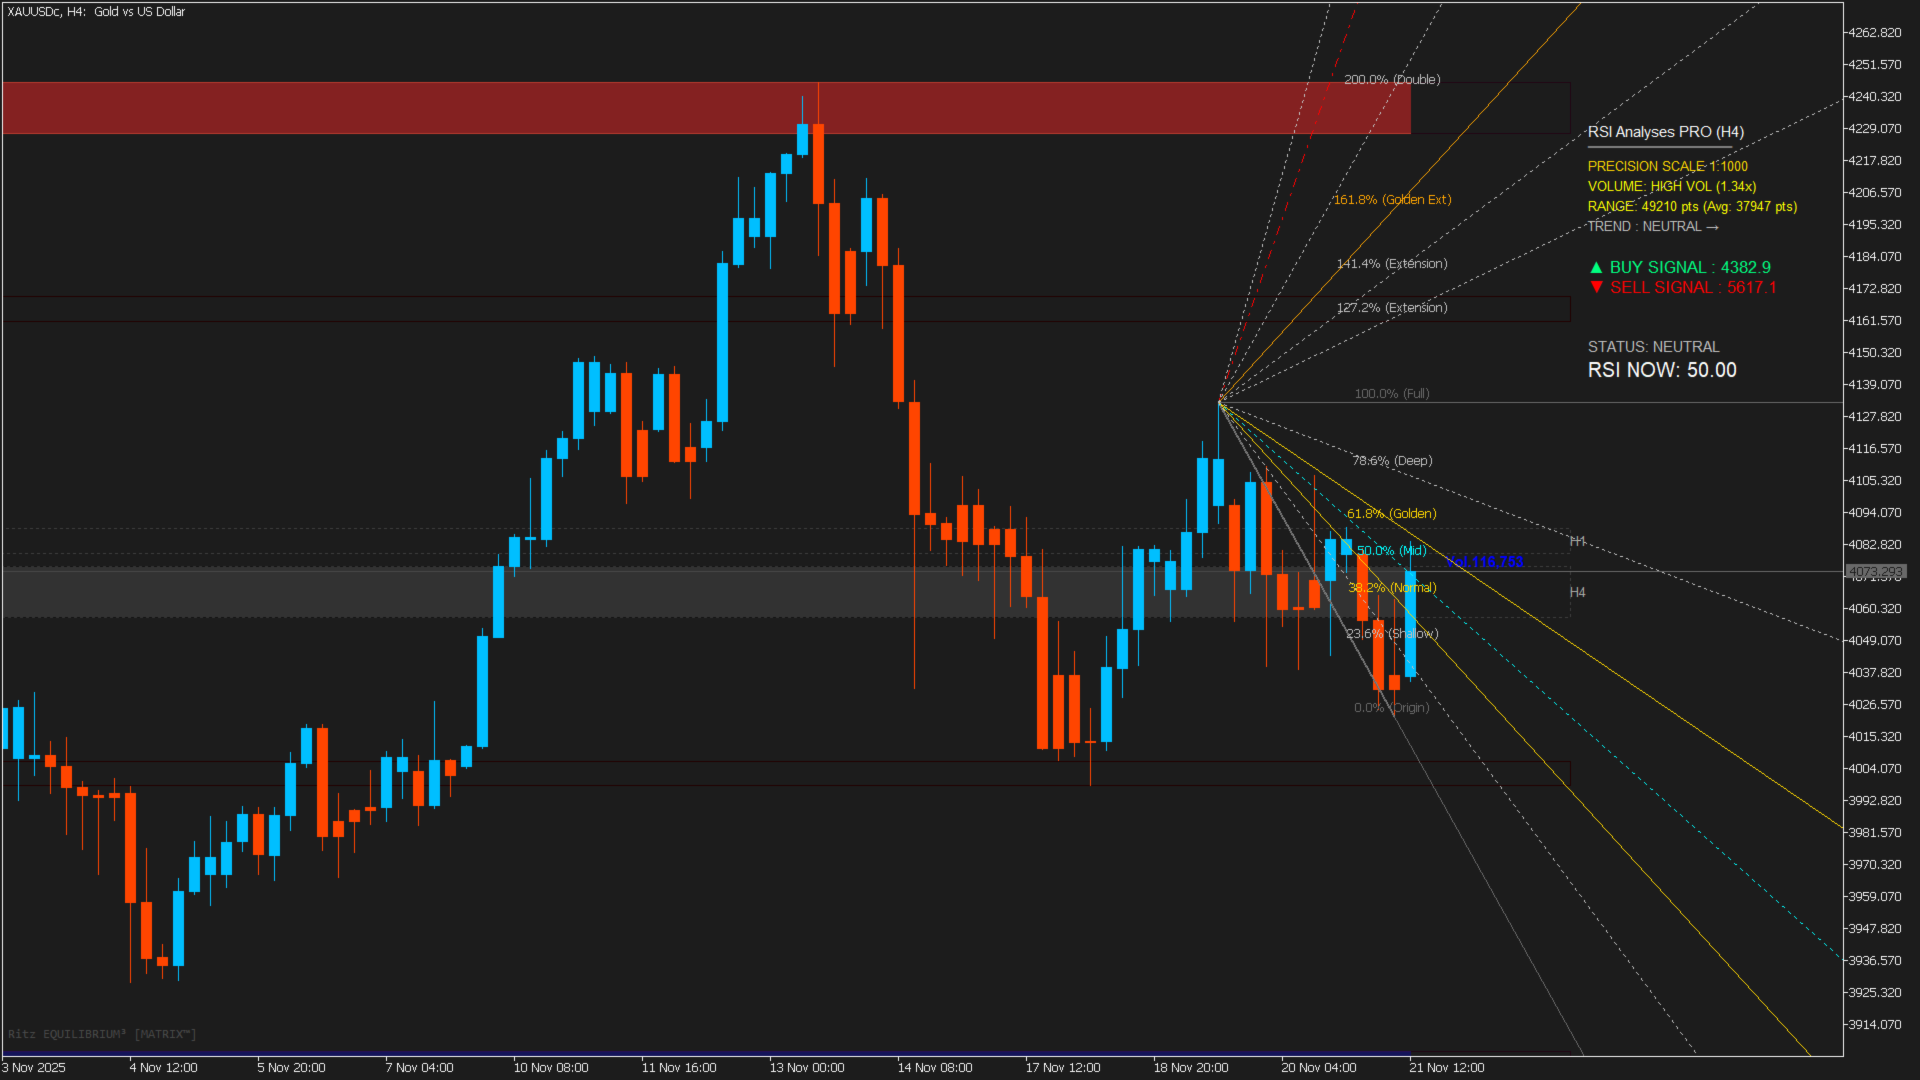
RSI Strength Panel
Menampilkan kekuatan tren, momentum, dan tekanan buyer/seller. -
Zone Transition System
Notifikasi saat harga masuk/keluar Premium, Discount, atau Equilibrium. -
Push Notification, Alert Popup, dan Log Intelligent Filter
Notifikasi tidak spam dan hanya muncul pada event valid. -
Ultra Lightweight & Anti-Flicker Drawing
Stabil untuk M1–H1 meskipun multitimescale aktif.
Membaca Struktur Pasar Secara Otomatis
Indikator mengidentifikasi:
-
Higher High (HH)
-
Higher Low (HL)
-
Lower High (LH)
-
Lower Low (LL)
Struktur ditampilkan jelas sehingga Anda langsung tahu fase:
-
Trend Lanjut
-
Trend Lemah
-
Potensi Reversal
-
Perubahan karakter (CHOCH)
Deteksi BOS / CHOCH Dengan Validasi Candlestick
BOS/CHOCH hanya muncul pada bar yang sudah fixed — bukan saat sedang bergerak.
Hasilnya:
tidak repaint
tidak muncul berulang
tidak men-trigger alert palsu
lebih akurat saat swing berbalik
RSI Strength Engine
Panel RSI memberikan:
-
Tren jangka pendek & menengah
-
Zona ekstrem (OB/OS)
-
Momentum buyer vs seller
-
Strength bar yang mudah dibaca
Cocok dipadukan dengan struktur pasar untuk:
-
Konfirmasi entry
-
Mendeteksi divergence
-
Menilai kekuatan retest
Equilibrium & Premium/Discount Zone
Indikator otomatis mengidentifikasi:
-
Premium Zone (sell zone)
-
Discount Zone (buy zone)
-
Equilibrium (50%)
Sertai dengan notifikasi:
-
Masuk ke zona
-
Keluar dari zona
-
Cross equilibrium
-
Potensi trend lanjutan
Notifikasi Pintar Tanpa Spam
Dengan sistem last alert memory:
-
Notifikasi hanya muncul sekali per event penting
-
Push notif, popup, dan print log bisa diatur terpisah
-
Mode "Zone Transition" untuk alert transisi halus antar zona
✔ Tidak repaint
✔ Tidak berat meski banyak objek
✔ Struktur SMC real-time
✔ Panel RSI built-in
✔ Smart fractal + swing validation
✔ BOS/CHOCH bar valid only
✔ Pengaturan notifikasi lengkap
✔ Cocok untuk Scalper, Day Trader, Swing Trader
General
-
ShowStructure
-
ShowZigZag
-
ShowRSIPanel
-
ShowSwingLabels
Zone Engine
-
EnablePremiumZone
-
EnableDiscountZone
-
ZoneTransitionMode
Notifications
-
EnableAlerts
-
EnablePushNotif
-
EnableZoneNotification
Swing & Fractal Settings
-
Fractal_Period
-
ATR_Filter
-
Min_Swing_Distance
Setiap parameter telah disederhanakan agar tidak membingungkan pengguna baru, namun tetap lengkap untuk pengguna profesional.
Cocok Untuk Strategi-
Smart Money Concept (SMC)
-
Breaker / Mitigation / Liquidity Grab
-
Trend Following
-
Scalping Struktur
-
Power of Three (PO3)
-
Market Mapping
-
Swing Confirmation
-
Momentum + Structure Trading
Gunakan indikator ini sebagai:
-
Market structure map utama
-
Konfirmasi arah pada M1–M15
-
Identifikasi swing utama pada H1
-
Validasi BOS + CHOCH saat retest
-
Pemetaan Premium/Discount sebelum entry
RITZ Quantum Market Structure Detection adalah alat yang Anda perlukan jika Anda ingin:
-
Membaca struktur dengan lebih cepat
-
Entry lebih presisi
-
Menilai arah pasar dengan keyakinan
-
Mengurangi noise dan false signals
QUANTUM MARKET STRUCTURE DETECTION
Where Market Science Meets Trading Artistry
Decode the Market’s DNA.
Trade the Structure.
Master the Quantum Field.