 MetaTrader 5
 エキスパート
 インディケータ
 ライブラリ
ライブラリ
 ユーティリティ
 ウィジェット
 ルール
ルール
YouTubeにあるマーケットチュートリアルビデオをご覧ください
ロボットや指標を購入する
仮想ホスティングで
EAを実行
EAを実行
ロボットや指標を購入前にテストする
マーケットで収入を得る
販売のためにプロダクトをプレゼンテーションする方法
MetaTrader 5のためのテクニカル指標
 テクニカル指標からのシグナルは、株式および外国為替市場での取引の開始と終了に重要な役割を果たします。指標の本質は、将来の価格変動を予測することを目的とした金融銘柄価格の数学的変換です。
テクニカル指標をテストして、市場の動きとそれからの利益をより正確に予測します。
テクニカル指標からのシグナルは、株式および外国為替市場での取引の開始と終了に重要な役割を果たします。指標の本質は、将来の価格変動を予測することを目的とした金融銘柄価格の数学的変換です。
テクニカル指標をテストして、市場の動きとそれからの利益をより正確に予測します。 
Trend Sniper X は、トレードの方向性と潜在的な反転ポイントを明確かつ正確に特定するのに役立つ、MetaTrader 5 用のマルチタイムフレーム・トレンドフォロー指標です。 MT4用: https://www.mql5.com/en/market/product/193245 価格情報: 現在の価格はプロモーション価格であり、今後のアップデートや新機能のリリースに伴い変更される場合があります。
ボーナス特典: このインジケーター用の無料自動売買アシスタントEAを入手するには、購入後に an 著者(開発者)へメッセージをお送りください。 Code2Profit チャンネル マルチタイムフレーム分析で相場をマスターしよう! Trend Sniper X で勝率を最大化する方法:重要なルールとセッションのコツ 技術仕様 プラットフォーム MetaTrader 5 インジケータータイプ マルチタイムフレーム・トレンドインジケーター 操作タイムフレーム あらゆるチャートタイムフレームに対応。個別に選択可能な上位タイムフレーム (M1–MN1) を搭載 主要銘柄 FX、ゴールド (X

Smart Trend Trading System — MetaTrader 5 ご購入後、MQL5で私にメッセージをお送りいただくと、Smart Universal Expert Advisorを無料で受け取れるほか、オンライン講座、PDFマニュアル、非公開グループへのアクセスもご利用いただけます。 STTSは、トレンドの方向、エントリー・決済シグナル、反転ゾーン、重要な価格水準をチャート上にまとめて表示します。システムを参考に手動で取引することも、別の対応EAを接続し、ご自身で選んだ設定に基づいて自動売買することもできます。 ひとつのシステム、4つのトレードアプローチ STTSのトレードアプローチは、大きく4つのカテゴリーに分かれています。 • スキャルピング — 短期的なシグナルや相場の動きを捉えます。
• トレンドトレード — 方向性を評価し、トレンド内の機会を探します。
• 反転トレード — 反転の可能性があるゾーンや方向の変化を見つけます。
• 出来高トレード — 出来高に基づく情報を使い、市場の活発さを評価します。 エントリー・決済の矢印、トレンド情報、サポート・

割引は 24 時間後に終了します — 次の価格は$ 69 ZORYK — MetaTrader 5専用 XAUUSDシグナル・トレードプランニングシステム
このような経験はありませんか。
ゴールドを分析し、エントリーを待ち、ようやくポジションを持った直後に価格が逆方向へ動く。
早すぎる決済をしてしまったり、Stop Lossを動かしたり、数秒迷っている間にチャンスを逃したりする。
その後、相場は自分が最初に予想していた方向へ進み、目標へ到達する。
問題は常に方向判断ではありません。
本当の問題は、明確な計画がなかったことです。
どこでエントリーすべきか。
どこでトレードの前提が無効になるのか。
近い利益を確保すべきか、より大きな値動きを待つべきか。
現在のsetupが本当に強いのか、それとも無理にトレードを探しているだけなのか。
ゴールドは非常に速く動きます。
正しい分析でも、明確なプランがなければ数秒で悪い判断に変わることがあります。
ZORYKは、その問題を解決するために開発されました。
ZORYKとは
ZORYKは、MetaTrader 5とXAU

SuperScalp Pro - Professional Multi-Layer Confluence Scalping System SuperScalp Proは、クラシックなSupertrendに複数のインテリジェントな確認フィルターを追加した、高度なスキャルピングインジケーターです。より高い確率が期待できるBuy/Sellの取引機会を特定し、ダマシのシグナルを大幅に減らすことをサポートします。 明確なBuyとSellの矢印がチャート上に直接表示され、ATRに基づくStop LossとTake Profitのレベルがリアルタイムで自動計算されます。 購入後、設定方法や推奨設定についてのサポートが必要な場合は、私にご連絡ください。 SuperScalp Pro Auto Traderを使用して、シグナルを簡単に自動化できます: [Auto Trader] 推奨設定ファイルをダウンロード: [Set File] 完全なドキュメントは製品ブログでご覧いただけます: [User Guide] 最新情報を受け取るには公式チャンネルに参加してください: [Official Channel]

新たな王者が登場 - インジケーター + 注文管理表示(TP1 + TP2 + TP3)+ オプションのTelegramシグナル送信機能付き(無料) (完全なトレード&シグナルシステム) ゴールド向け最高のEA: Gold Slayer このインジケーターには、高度な戦略、カスタマイズ可能な注文管理システム、そしてエンベロープ拡張を組み合わせた平均回帰システムが搭載されています。さらに、RSIなど複数のインテリジェントな確認フィルターによって、高確率の反転エントリーをBUY・SELLシグナルとして検出します。 単にトレードを学ぶだけでなく、複数ポジションを効果的に管理し、過去に利益を出しているオープンポジションで損失トレードをカバーする方法も学べます。 M5向けに構築・最適化されており、流動性が高くシグナルの精度が安定しているBTCUSDとXAUUSDで優れたパフォーマンスを発揮します。 このインジケーターは、ATRを基に自動計算されたエントリー、ストップロス、テイクプロフィットレベルを備えた明確なLong・Shortシグナルを提供するため、リスク管理が最初から組み込まれています。 マ

まず正直に言いましょう。
どんなインジケーターも、それ単体であなたを利益化させることはできません。もしそう言う人がいるなら、それは夢を売っているだけです。完璧な売買シグナル(矢印)を表示するインジケーターは、いくらでも“完璧に見せる”ことができます。正しい過去の区間を拡大して、勝ちトレードだけを切り取ればいいだけです。私たちはそれをしません。 SMC Intraday Formula はツールです。 市場構造を読み取り、最も高い確率の価格ゾーンを特定し、今この瞬間のスマートマネーの痕跡をシンプルな言葉で正確に示します。最終判断はあなたが行います。トレードを実行するのもあなたです。しかし今は「希望」ではなく「精度」でエントリーできます。 私たちはこのインジケーターを、ゴールド(XAUUSD)および主要FX通貨ペアで約3年間、日々のスキャルピングに使用してきました。M1、M5、M15、M30の主要ツールです。これは未来を予測しようとするのではなく、今まさに形成されている高確率セットアップを示し、その理由を説明します。 他のすべてのインジケーターと何が違うのか? ほとんどのトレーディングイ

伝説が帰ってきました:Entry Points Pro 10。 MQL5 Marketのトップ3に3年間入り続けた伝説的インジケーターの再始動です。 2つのバージョンで合計589件の高評価レビュー、毎日数千人のトレーダーが実際のトレードに使用し、デモのダウンロードは31,000件以上 MT4+MT5 。 私はこの5年間に寄せられたレビューをすべて読み、約束を並べる代わりに、その答えをバージョン10に組み込みました。1999年から相場に携わり、 誠実さ、自らの評判、そして顧客を大切にする 作者による製品です。 Entry Points Proのエントリーシグナルは、リペイント(再描画)を一切行いません。 そして今回初めて、これは作者の言葉ではなく検証可能な事実になりました。確定シグナルはローソク足の終値確定後にのみ表示され、自動テストで リペイントはゼロ と確認されています(EURUSD、XAUUSD、BTCUSDで2,486,568回の不変条件チェック、違反0件)。検証方法は公開されており、ストラテジーテスターでご自身で再現できます。 ご購入後は、必ずすぐにダイレクトメッセージでご

GoldenX Entryは、MT5向けのインジケーターであり、適応型Smart Entry Trendアルゴリズム、シグナルスコアリングシステム、マーケットレジーム検出機能、およびボラティリティフィルターを備えています。各シグナルには、計算されたエントリーレベル、3つのテイクプロフィット(TP1、TP2、TP3)、およびストップロスレベルが含まれます。本インジケーターは、異なる市場環境に適応するために設計された複数の分析レイヤー上に構築されており、マルチレイヤー分析システムと内蔵オプティマイザーおよび統計トラッキングシステムを組み合わせています。リスク・リワード(RR)指標および過去のトレード履歴に基づく定量分析を提供します。 使い始めは簡単です — 選択した時間足でオプティマイザーを実行し、そのままチャート上でインジケーターを使用します。 コア機能
GoldenX Entryは、シグナルエンジンとトレード管理機能、そして過去統計トラッキングを1つのチャートに統合しています: - 内蔵オプティマイザー: オプティマイザーはチャート上でワンクリックで実行できます。200通りのパラメー

Neuro Poseidon is a new indicator by Daria Rezueva. It combines precise trading signals with adaptive TP/SL levels - creating best possible trades as a result!
Message me and get Neuro Poseidon Assistant as a gift to automize your trading process!
What makes it stand out?
1. Proven profitability on all assets and timeframes
2. Only confirmed BUY and SELL signals present on the chart
3. Adaptive TP & SL levels generated by the software for each trade
4. Easy to understand - suitable for al

あなたのトレード優位性を視界に入れよう! M5 Sniper は MeanFX による新しいインジケーターです。 正確なトレードシグナル と 適応型TP/SLレベル を組み合わせることで、結果として可能な限り最高の統計的トレードを実現します!
5回購入されるごとに価格が上昇し、次の価格は69$です 購入後に私にメッセージを送っていただければ、ヒント/ガイドとボーナスEAをお受け取りいただけます 何が他と違うのでしょうか? Gold XAUUSDにおける 実証済みの統計的パフォーマンス ( ほぼすべてのアセットで機能します 。一貫した結果が得られないまま何でも扱おうとするのではなく、1つの時間足をマスターすることに重点を置いています) 1日あたり1~8回のトレード を各シンボルで実行し、高い勝率と、すべての統計的優位性をこちら側に持つことができます チャート上には 確認済みの BUYおよびSELLシグナルのみを表示 適応型TPおよびSLレベル を各トレードごとにインジケーターが生成 平均Winrate 75%+ 平均 Signal Ratio 最低1.1+ アラーム と通知を 携帯電話

Adaptive Price Action Engine インジケーターを購入すると、EAが無料に マルチタイムフレーム対応・自己最適化トレンド&ローソク足パターン分析 市場環境は常に変化しており、すべてのPrice Actionパターンが、あらゆる市場環境で同じ価値を持つわけではありません。 Adaptive Price Action Engine は、変化する市場環境への適応を目的として、 トレンド構造、マルチタイムフレーム分析、ローソク足パターン、統計的最適化 を1つの分析フレームワークに統合しています。 2つのアダプティブモード Dual Alpha Trend Mode
低い時間足と高い時間足のAlpha Trendパラメータを自動的に探索し、直近の市場動向に合わせてトレンド判定を適応させます。 Candlestick + Alpha Mode
Alpha Trendによる市場レジーム判定と、 22種類の強気・弱気ローソク足パターン を組み合わせます。すべてのパターンを同じように扱うのではなく、さまざまなパターンの組み合わせを統計的に評価し、選択された市場環境において過去

Auto Optimized SpeedAngle は、継続的なウォークフォワード最適化(WFO:Walk-Forward Optimization)によりカーブフィッティング(過剰最適化)を排除した、機関投資家レベルのモメンタムベクトルシステムです。市場レジームの変化時に効果が低下する静的な入力に依存せず、アウトオブサンプル(OOS)検証を用いてパラメーターを動的に再キャリブレーションすることで、表示されるシグナルが単なる過去の偶然ではなく、確実な統計的優位性に基づいていることを保証します。 主な機関投資家向けフレームワーク ウォークフォワード最適化エンジン: ルックバック期間やしきい値の数千に及ぶ組み合わせを継続的にスキャンし、データをインサンプルとアウトオブサンプルに厳格に分離します。未検証のデータ環境において数学的優位性が証明された場合にのみ、新しいパラメーター設定を採用します。 定量的目的関数: 単なる純利益の追求ではなく、機関投資家レベルの安定性指標をターゲットとします。システム品質ナンバー(SQN)、期待値(1トレードあたりの平均Rマルチプル)、またはネットRの最適化を選

M1 SNIPER は使いやすいトレーディングインジケーターシステムです。M1時間足向けに設計された矢印インジケーターです。M1時間足でのスキャルピングのためのスタンドアロンシステムとして、また既存のトレーディングシステムの一部としても使用できます。このトレーディングシステムはM1時間足での取引に特化して設計されていますが、他の時間足でも使用できます。元々、この手法はXAUUSDとBTCUSDの取引用に設計しましたが、他の市場においても役立つと考えています。 インジケーターのシグナルは、トレンドの方向と逆方向に取引できます。インジケーターのシグナルを利用して両方向に取引するのに役立つ特別な取引テクニックをご紹介します。この手法は、特別な動的なサポートとレジスタンスの価格帯を利用することに基づいています。 ご購入後、M1 SNIPER矢印インジケーターをすぐにダウンロードできます。さらに、M1 SNIPERツールのすべてのユーザーに、以下のスクリーンショットに表示されているApollo Dynamic SRインジケーターを無料で提供しています。この2つのインジケーターを組み合わせることで

Gann Made Easy は、ミスター・ギャンの理論を使用した取引の最良の原則に基づいた、プロフェッショナルで使いやすい外国為替取引システムです。 W・D・ガン。このインジケーターは、ストップロスとテイクプロフィットレベルを含む正確な買いと売りのシグナルを提供します。 PUSH通知を利用して外出先でも取引可能です。 ご購入後、取引方法の説明と優れた追加インジケーターを無料で入手するには、私にご連絡ください! おそらく、ギャンの取引手法についてはすでに何度も聞いたことがあるでしょう。通常、ギャンの理論は初心者のトレーダーだけでなく、すでにある程度の取引経験がある人にとっても非常に複雑なものです。なぜなら、ギャンの取引手法は理論的にはそれほど簡単に適用できるものではないからです。私はその知識を磨き、最良の原則を私の外国為替インジケーターに組み込むために数年を費やしました。 このインジケーターは非常に簡単に適用できます。必要なのは、それをチャートに添付し、簡単な取引推奨事項に従うだけです。このインジケーターは常に市場分析の仕事を行い、取引の機会を探します。適切なエントリーポイントを検

ARIPoint is a powerful trading companion designed to generate high-probability entry signals with dynamic TP/SL/DP levels based on volatility. Built-in performance tracking shows win/loss stats, PP1/PP2 hits, and success rates all updated live. Key Features: Buy/Sell signals with adaptive volatility bands Real-time TP/SL/DP levels based on ATR Built-in MA Filter with optional ATR/StdDev volatility Performance stats panel (Success, Profit/Loss, PP1/PP2) Alerts via popup, sound, push, or email Cu

Gold Entry Sniper – ゴールドスキャルピング&スイングトレード用プロフェッショナル多時間足ATRダッシュボード Gold Entry Sniper は、XAUUSDや他の銘柄向けに正確な 売買シグナル を提供する、MetaTrader 5用の高度なインジケーターです。 ATRトレーリングストップロジック と 多時間足分析ダッシュボード を搭載し、スキャルピングからスイングトレードまで対応します。 主な特徴と利点 多時間足シグナル分析 – M1、M5、M15 のトレンドを同時表示。 ATRベースのトレーリングストップ – ボラティリティに応じて動的に調整。 プロ仕様のチャートダッシュボード – シグナル状況、ATRレベル、回帰線、売買方向を表示。 明確な売買マーカー – 自動矢印とテキストラベル。 エグジットアラートとトレード管理 – 利益確定のための自動検出。 完全カスタマイズ可能 – パネル位置、色、フォント、ATR/回帰設定を調整可能。 ゴールド(XAUUSD)に最適化 – M1〜M15のスキャルピングに最適、FXや指数、暗号資産にも対応。 Gold Entry

ゴールドで最も精度の高いシグナル設定をご希望の方は、今すぐメッセージをください。推奨設定をお送りします。 VOLURIS — Volume Profile エンジン
あなたはすでにトレードのやり方を知っています。ただ、本来見るべきものが見えていないだけです。 その感覚を、あなたはすでに経験したことがあるはずです。
エントリーする。価格がすぐに逆行する。ストップにかかる。そしてその直後、価格は反転し、あなたが想定していた方向へ正確に進んでいく。あなたの判断は正しかった。ただ、早すぎた。あるいは遅すぎた。もしくはその両方だった。
後からチャートを見返すと、今なら分かります。エントリーのすぐ上に Naked POC があった。前回セッションの Value Area が、まさに価格が止まった場所にあった。VWAP がレジスタンスとして機能していたのに、あなたのチャートには表示されていなかった。コンテキストはすべてを教えていました。ただ、それを読み取るツールがなかっただけです。
これはトレードの問題ではありません。情報の問題です。
VOLURIS は、その問題を解決するために存在しま
FREE

Scalper Vault は、スキャルピングを成功させるために必要なすべてを提供するプロフェッショナルなスキャルピング システムです。このインジケーターは、外国為替およびバイナリー オプションのトレーダーが使用できる完全な取引システムです。推奨される時間枠は M5 です。 システムは、トレンドの方向に正確な矢印シグナルを提供します。また、トップとボトムのシグナルとギャン マーケット レベルも提供します。 インジケーターは、プッシュ通知を含むすべてのタイプのアラートを提供します。 インジケータの購入後にご連絡ください。私の個人的な取引の推奨事項と素晴らしいボーナス指標を無料で共有します! 幸せで有益な取引をお祈りします!

SMC All-in-One: マーケットストラクチャー&リクイディティ(市場構造と流動性) SMC(スマートマネーコンセプト)アナリティックインジケーターは、スマートマネーコンセプトのアプローチに基づいて価格アクションの分析を自動化します。手動でレベルを描画する代わりに、内部およびスイングの市場構造、オーダーブロック、フェアバリューギャップ(FVG)、流動性レベルをリアルタイムでチャート上にラベル付けします。
機関投資家が注文を配置している可能性が高い場所を特定することで、より正確なエントリーとエグジットのための最適な関心領域(POI)を見つけるのに役立ちます。
インジケーターを初めて使用する場合は、MQL5ブログのステップバイステップの[ユーザーマニュアル]で完全なパラメータ設定をご確認ください。 より深い市場構造の分析をご希望ですか?ブレーカーブロック、リジェクションブロック、リクイディティプール、iFVGなどの追加コンセプトをカバーする無料のコンパニオンインジケーター[SMC Advanced Order Block]をダウンロードしてください。 アップデートとコミュニテ
FREE

Gold Trend Coach は MetaTrader 5 用のゴールド(XAUUSD)トレンドインジケーターです。売買シグナル、ストップロス、3 つのテイクプロフィット目標を足の確定時に確定し、マルチタイムフレームのコーチダッシュボードとスマートフォンと Telegram へのアラートを備えています。ロンドンとニューヨークのセッションでの M5 スキャルピングと M15 デイトレード向けに作られています。 Gold Trend Coach:エントリー、ストップ、3 つのターゲット付きの XAUUSD ゴールドトレンドシグナル。発売価格 $39 は最初の 20 本限定、その後 $59。
購入後にメッセージをいただければ、購入者キットをすぐにお送りします。 最悪の連敗をチャート上に表示するゴールド用インジケーター。 このマーケットの XAUUSD インジケーターはどれも勝ちシグナルを見せてくれます。Gold Trend Coach は負けシグナルも見せます。赤で数え、最悪の連敗と純損益を、都合の良いものだけでなくすべてを数えるパネルに表示します。シグナルがストップに達したら、それが

Tokyo Indicatorは、トレンドの方向性、潜在的な取引シグナル、および市場状況を視覚的に分かりやすく表示します。 色分けされた階段状のトレンドラインにより、強気局面(青色)と弱気局面(マゼンタ色)が明確に区別されます。トレンドの変化に合わせて表示される方向矢印は、売買の好機を強調します。 統合されたダッシュボードには、現在のシグナル、市場のバイアス(傾向)、モメンタム、ボラティリティ、シグナルの品質がひと目で分かるようにまとめられています。これにより、トレーダーはパネルを切り替えることなく、価格変動(プライスアクション)とインジケーターの数値を照らし合わせて分析を行うことができます。 すっきりとしたチャート表示と簡潔な市場概要により、Tokyo Indicatorはトレンド分析や取引判断における体系的なアプローチをサポートします。 あらゆる時間足や銘柄に対応しており、特に金(ゴールド)の取引に適しています。 トレンド スキャナーの強力なサポートを利用して、無料のインジケーターを入手し、プライバシーを守ります。あーみー!
設定
ShowHUD - チャート上のパネ
ポジティブなレビューを残してください。
重要な注意 :スクリーンショットに表示されている画像は、私のインジケーターである「Suleiman Levels」インジケーターと「RSI Trend V」インジケーターのものであり、もちろん「Time Candle」も含まれています。これは、高度な分析と独占的なレベルを提供する包括的なインジケーター「Suleiman Levels」の一部です。 気に入ったら、「RSI Trend V」インジケーターを試してみてください:
https://www.mql5.com/en/market/product/132080 また、気に入ったら「Suleiman Levels」インジケーターを試してみてください:
https://www.mql5.com/en/market/product/128183 「Time Candle Suleiman」インジケーターは、現在のキャンドルの残り時間をスムーズかつエレガントに表示するように設計されています。すべての時間軸で、カウントダウンの外観を完全にカスタマイズするオプションを提供しており、フォントの種類、サイズ、
FREE

トレンドキャッチャーインジケーター
トレンドキャッチャーインジケーターは、開発者独自の適応型トレンド分析指標を組み合わせることで、市場価格の動きを分析します。短期的なノイズを除去し、根底にあるモメンタムの強さ、ボラティリティの拡大、価格構造の挙動に焦点を当てることで、真の市場方向性を特定します。また、移動平均線、RSI、ボラティリティフィルターなどの平滑化およびトレンドフィルタリング機能を備えたカスタマイズ指標も使用します。
実際の運用状況のモニタリングやその他の製品については、こちらをご覧ください: https://www.mql5.com/en/users/mechanic/seller
ご注意ください。私はTelegramでEAや設定を販売していません。詐欺です。すべての設定はブログで無料で公開しています。
重要!ご購入後すぐにご連絡ください。手順とボーナスをお送りします!

Entry In The Zone and SMC Multi Timeframe is a real-time market analysis tool based on Smart Money Concepts (SMC), designed to analyze market structure, price direction, and key trading zones. It supports both Single-Timeframe and Multi-Timeframe Analysis, providing a clearer view of overall market structure across multiple timeframes, with real-time BUY / SELL signals designed with a strict focus on No-Repaint principles. The signals are designed to help filter unclear setups and evaluate tradi

トレーダーの皆さん、こんにちは!
多くの個人トレーダーは、動作の遅いウェブスクリプトに頼っています。真の収益性を実現するには、体系化されたフレームワークが必要です。
Astro AIインジケーターは、一般的なチャートオーバーレイではありません。これは、ターミナル上で直接動作する2つのエージェントを含む、コンパイル済みのニューラルネットワークです。
システムの具体的な技術は以下のとおりです。
1. エージェント1:アナリスト(グラフィカルニューラルネットワーク - GNN)
市場は孤立した価格バーではなく、相互に連結されたデータネットワークです。
機能:エージェント1は、グラフィカルニューラルネットワークを使用して、これらの複雑で非線形な関係をマッピングします。
利点:一般的なインジケーターは過去の移動平均しか考慮しませんが、当社のGNNは市場の深い構造的関係をリアルタイムで処理し、個人トレーダーの取引量が大きな影響を与える前に、隠れた相関関係を明らかにします。
2. エージェント2:エグゼキューター(近接戦略最適化 - PPO)
パターン認識は、戦いの半分に過ぎません

このインジケーターを購入された方には、以下の特典を 無料 で提供しています:
各トレードを自動で管理し、ストップロスとテイクプロフィットを設定し、戦略ルールに基づいてポジションを決済する補助ツール 「Bomber Utility」 様々な銘柄に合わせたインジケーターの設定ファイル(セットファイル) 「最小リスク」、「バランスリスク」、「待機戦略」 の3つのモードで使用できる Bomber Utility 用の設定ファイル このトレーディング戦略をすぐに導入・設定・開始できる ステップバイステップのビデオマニュアル ご注意: 上記の特典を受け取るには、MQL5のプライベートメッセージシステムを通じて販売者にご連絡ください。 オリジナルのカスタムインジケーター 「Divergence Bomber(ダイバージェンス・ボンバー)」 をご紹介します。これは、MACDのダイバージェンス(乖離)戦略に基づいた 「オールインワン」型のトレーディングシステム です。
このテクニカルインジケーターの主な目的は、価格とMACDインジケーターの間に発生するダイバージェンスを検出 し、将来の価格の動きを示

Haven Bar Replay — あなた専用のトレード練習シミュレーター ご紹介します。 Haven Bar Replay は、裁量トレードの練習や戦略テストのためのプロフェッショナルなシミュレーターです。MT5チャートを「過去検証プレイヤー」に変え、数ヶ月分の市場の動きをわずか数分で体験できます。 仮想取引ができるトレーディングシミュレーター -> Haven Trading Simulator | その他の製品 -> こちら . 利益を出せるトレーダーになりたいけれど、セットアップが形成されるのを何時間も待ちたくないですか?このツールはそんなあなたのためのものです。リアルタイム市場と同じように、過去データを使って相場観を養い、仮説を検証し、スキルを磨きましょう。 なぜ Haven Bar Replay がトレーダーに不可欠なのか? 「チャートの右端」効果
インジケーターは「未来(本物のローソク足)」を完全に隠し、シミュレーション部分のみを表示します。先の動きをカンニングすることなく、正直に判断を下せます。 時間の完全なコントロール
退屈なレンジ相場は早
FREE

Unix Scalper — MetaTrader 5 ご購入後、MQL5で私にメッセージをお送りいただくと、Smart Universal Expert Advisorを無料で受け取れるほか、オンライン講座、PDFマニュアル、非公開グループへのアクセスもご利用いただけます。 セットアップを見つけ、取引プランを確認し、取引方法を選ぶ。 UNIX Scalperは、市場分析、BUY/SELL/WAITの判断、Entry、Stop Loss、TP1、TP2の水準を、見やすいパネルにまとめています。 シグナルと取引プランを確認 • 明確な判断:BUY、SELL、WAIT。
• 明示された水準:Entry、Stop Loss、TP1、TP2。
• 複数時間足の一覧:パネル上で各時間足のシグナルを比較。
• 判断を支える分析:トレンド、モメンタム、出来高、ボラティリティ、サポートとレジスタンス、市場の質。
• 選べるレイアウト:Minimized、Compact、Standard、Full。 シグナルと各水準を確認し、そのセットアップがご自身の取引ルールに合うか判断してください。 ゴール

あなたが移動平均で取引する場合、この指標はあなたの最高のアシスタントになります。 これは、2つの移動平均が交差するときの信号を示します(たとえば、速い移動平均が下から上への遅い移動平均を突破します-成長が可能です)。 それはすべての方法であなたに通知します:それは端末でビープ音を鳴らし、あなたの電話に通知を送信し、あなたの電子メールに電子メールを送信します—今、あなたは間違いなく取引を見逃すことはありません。 それは柔軟に調整することができます:あなたは(利用可能な10以上のオプションがあります)移動平均を計算する方法を正確に選択し、あなたの戦略 移動平均線が好きな人のためのツール。 画面に座る必要はありません-それは行動する時が来たときにあなたに教えてくれます。 そして、あなたが実験したいのであれば、設定はあなたが長期的な取引のためにさえ、スキャルピングのためにそれを適応させるのを助けるでしょう。 指標は、迅速なコードを持っており、簡単にあなたの取引ロボットに統合することができます。 送信される信号とアラートには2つのタイプがあります。 最初の信号は、条件が満たされる可能性がある場合
FREE

すべての無料商品を見るにはここをクリック
完璧なマーケットチャンスを見極め、正確にブレイクアウトを取引するために、 RangeXpert は市場で最も 効果的なツールの1つ です。初心者やセミプロ向けに特別に開発されており、通常は 銀行、機関投資家、ヘッジファンドが使用するプロフェッショナルツール でしか見られない分析品質を提供します。 このインジケーターは、強い値動きにつながりやすいマーケットゾーンを特定し、それらを非常に明確かつ直感的に表示するため、複雑な構造でも瞬時に視覚化できます。 RangeXpert は誤った判断を減らし、タイミングを改善し、レンジが終わり本物のトレンドが始まる瞬間をリアルタイムで示します。 ボラティリティへの動的な適応、複数ポジションの強さ、利益のインテリジェントな分配によって、これは現在トレーダーが使用する 最も強力なブレイクアウトインジケーターの1つ となっています。
仕様 完璧なエントリーゾーン 完全に最適化されたチャートビュー 視認性の高いテイクプロフィットとストップロスライン シグナル最適化されたトレーリングストップ (pips 表示付
FREE
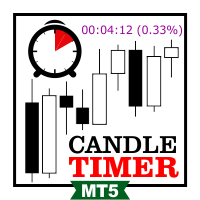
キャンドルタイマーカウントダウンは、現在のバーが閉じて新しいバーが形成されるまでの残り時間を表示します。 時間管理に使用できます。
MT4バージョンはこちら !
機能のハイライト 現地時間ではなくサーバー時間を追跡します 構成可能なテキストの色とフォントサイズ シンボルの日次変動のオプションの視覚化 CPU使用率を削減するために最適化
入力パラメータ
毎日の変化を表示:true / false テキストフォントサイズ テキストの色
それでも質問がある場合は、直接メッセージで私に連絡してください。 https://www.mql5.com/ja/users/robsjunqueira/
これが私たちが継続的に進化することができる唯一の方法であるため、改善のための提案に気軽に連絡してください。
FREE

Volatility Master for MetaTrader is a real-time dashboard tool that scans up to 50 symbols to identify high-volatility , trending markets instantly. With bullish/bearish signals, customizable alerts, and a user-friendly interface, it helps you avoid range-bound conditions and focus on high-probability trades. Clarity leads to confidence. Trade confidently and protect your capital effectively with this powerful dashboard. We don't offer free or bonus indicators in exchange of reviews from you.

Quantum TrendPulse を ご紹介します。これは、 SuperTrend 、 RSI 、および Stochastic のパワーを 1 つの包括的なインジケーターに組み合わせて、取引の可能性を最大限に引き出す究極の取引ツールです。精度と効率を求めるトレーダー向けに設計されたこのインジケーターは、市場のトレンド、勢いの変化、最適なエントリー ポイントとエグジット ポイントを自信を持って特定するのに役立ちます。 主な特徴: SuperTrend 統合: 現在の市場動向に簡単に追従し、収益性の波に乗ることができます。 RSI精度: 買われすぎと売られすぎのレベルを検出し、市場の反転のタイミングに最適で、SuperTrendのフィルターとして使用されます。 確率的精度: 確率的振動を活用して、変動の激しい市場で隠れたチャンスを見つけます。SuperTrend のフィルターとして使用されます。 マルチタイムフレーム分析: M5 から H1 または H4 まで、さまざまなタイムフレームで市場を常に把握します。 カスタマイズ可能なアラート: カスタム取引条件が満たされ

Market Structure Order Block Dashboard MT5 は、市場構造と主要な価格反応ゾーンをチャート上で直接読み取りたいトレーダー向けに設計された MT5 インジケーターです。BOS、ChoCH、オーダーブロック、Fair Value Gap (FVG)、流動性、Kill Zones、Volume Profile、そして素早い分析のためのコンパクトなダッシュボードを組み合わせています。 本インジケーターは、市場構造、ICT、Smart Money の概念を意思決定の枠組みとして使用するトレーダーを対象としています。トレンド継続、反転の可能性、価格の不均衡、流動性ターゲット、注目ゾーンをより構造的に特定する助けとなります。 購入者向けの付属リソース 購入後、MQL5 のプライベートメッセージにてご依頼いただくと、完全な PDF ユーザーガイドとパラメータ設定のヒントを提供いたします。MQL5 のプライベートメッセージによる直接的な技術サポート。 バージョン 1.20 では 2 つの重要な追加機能があります: Pending BOS / Pending Cho

Trading Session ICT KillZone は、主要な取引セッションをチャート上に直接表示するための無料 MT5 インジケーターです。 アジア、ロンドン、ニューヨークの KillZone をハイライトし、より見やすい視覚環境で市場の時間帯を把握できるようにします。このツールは、ICT トレーダー、プライスアクショントレーダー、またチャートを必要以上に複雑にせずに各市場セッションを区別したいトレーダーに役立ちます。 主な機能 アジア、ロンドン、ニューヨークのセッションゾーン チャート上に見やすい背景表示 セッション表示のカスタマイズ 色とラベルのカスタマイズ 表示する KillZone 数の調整 ICT、セッションタイミング、プライスアクション分析に有用 対象ユーザー
このインジケーターは、市場セッションをチャート分析の一部として使用するトレーダー向けに設計されています。アジア、ロンドン、ニューヨークの取引時間帯における価格の動きを観察するのに役立ちます。 使用方法
MT5 チャートにインジケーターを読み込み、セッションゾーンを時間帯の参考として使用します。このインジケータ
FREE

FiboSniper Pro – Multi-Filter Fibonacci System with Auto SL/TP and Control Panel FiboSniper Proは、動的なFibonacci Envelopesと複数の確認フィルターを組み合わせ、選別されたBuyおよびSellシグナルを生成するテクニカルインジケーターです。FibonacciレベルはMoving AverageとATRを基に計算され、その後ADX、EMA、RSI、ATR、Volume、Time、Candle構造によってフィルタリングされます。インジケーターは、ATRに基づく自動Stop LossおよびTake Profitレベルをチャート上に直接表示し、さらに迅速な調整が可能なインタラクティブControl Panelを提供します。 購入後、推奨設定ファイルと詳細な使用方法については、私にご連絡ください。 Auto Trader Xを使用してFiboSniper Proのシグナルを自動化できます: [Auto Trader X] User GuideとSet Files: [Click her

ご紹介 Quantum Breakout PRO は 、ブレイクアウト ゾーンの取引方法を変革する画期的な MQL5 インジケーターです。 13年以上の取引経験を持つ経験豊富なトレーダーのチームによって開発されました。 クォンタム ブレイクアウト プロ は、革新的でダイナミックなブレイクアウト ゾーン戦略により、あなたのトレーディングの旅を新たな高みに押し上げるように設計されています。
クォンタム ブレイクアウト インジケーターは、5 つの利益ターゲット ゾーンを備えたブレイクアウト ゾーン上のシグナル矢印と、ブレイクアウト ボックスに基づいたストップロスの提案を提供します。
初心者トレーダーにもプロのトレーダーにも適しています。
量子EAチャネル: ここをクリック
重要!購入後、インストールマニュアルを受け取るためにプライベートメッセージを送ってください。
推奨事項:
時間枠: M15 通貨ペア: GBPJPY、EURJPY、USDJPY、NZDUSD、XAUUSD アカウントの種類: ECN、Raw、またはスプレッドが非常に低い R

Atomic Analyst — MetaTrader 5 ご購入後、MQL5で私にメッセージをお送りいただくと、Smart Universal Expert Advisorを無料で受け取れるほか、オンライン講座、PDFマニュアル、非公開グループへのアクセスもご利用いただけます。 Atomic Analystは、プライスアクション、トレンドの方向、エントリー・決済シグナル、損切り水準、複数の利確水準をチャート上にまとめて表示します。 シグナルを確認し、取引の状況を理解する Atomic Analystは、分析結果をわかりやすい視覚情報として表示します。 • エントリーの候補を見つけるための買い・売りの矢印。
• 取引計画に役立つ損切り水準と複数の利確水準。
• 市場の方向性を評価するトレンド、強さ、モメンタムの指標。
• より広い市場背景を比較する複数時間足の分析。
• 変化する状況を追うための色分けされたローソク足とアラート。 シグナルと補助分析を併せて確認し、その取引機会がご自身のルールに合うかを判断してください。 短期の取引機会から、より大きな値動きまで Atomic A

Smart Volume Profile は、2 本の縦線の間で出来高分布をリアルタイムに計算・表示するプロフェッショナルなインジケーターです。買いと売りを分割表示し、POC・VAH・VAL レベルも描画します。裁量取引にもシステム取引にも対応し、市場がどの価格帯で最も多く取引されたか、そして買い手と売り手の力関係がどのように分布しているかを確認できます。 このインジケーターを選ぶ理由 分析期間を完全にコントロール — 2 本のドラッグ可能な VLINE で範囲を定義。
買いと売りの分割表示 — 専用カラーでどちらが主導しているか一目で把握。
POC・VAH・VAL の機関投資家レベル — 明確に描画され常に更新。
最適化されたパフォーマンス — ティックデータを使用し、利用できない場合はスマートな代替処理。
アダプティブ表示 — プロファイル幅をチャートサイズに比例させて高い可読性を維持。 動作方法 VP begin と VP finish という 2 本の VLINE を描画して時間範囲を設定します。インジケーターは価格レベルごとの出来高を、設定可能な数のバケットに集計します。取引
FREE
CRYSTAL AI PRO v7.21 — MT5 エキスパートアドバイザー 概要
XAUUSD(ゴールド)および主要FXペア向けの自動売買システム。エントリー、SL/TP、トレーリング、ドローダウン管理をルールベースで実行。利益は保証されません。リスク告知をご確認ください。 要件 プラットフォーム:MetaTrader 5 口座タイプ:ECN/RAW 推奨 接続:24/7(VPS 推奨) 時間足:M1〜H4 初期設定 Algo Trading を有効化。 チャートにEAを適用(1シンボル=1チャート)。 Inputs の AI_Access_Mode = ON を設定し、再読み込み。 資金・レバレッジに合わせてリスク調整。 推奨条件 十分な証拠金と安定した約定(低スプレッド/低レイテンシ)。 ゴールドは $5,000+ / 1:500 が目安。複数シンボル時はリスク縮小。 まず デモ で検証。 主な機能 SL/TP 、 ブレークイーブン 、 トレーリング を伴うエントリー/エグジット。 ドローダウン抑制 :環境悪化時に取引頻度を低下。 マルチシンボル対応(シンボルごとにチャート)
FREE

PainX GainX Blue Spike Fusion AI Advanced Synthetic Index Spike Detection Indicator for MetaTrader 5 Discover potential spike setups with a clear, organized, and professional trading interface. PainX GainX Blue Spike Fusion AI is a specialized indicator designed for traders who monitor synthetic indices and want a structured way to observe potential price spike opportunities. The indicator combines signal monitoring, market-condition analysis, visual alerts, and event tracking in one convenient

Haven Candle Timer Countdown — 便利なマルチタイムフレーム・ローソク足タイマー Haven Candle Timer Countdown は、複数の時間足(タイムフレーム)のローソク足が確定(クローズ)するまでの残り時間を同時に、正確に追跡するために設計された実用的な補助インジケーターです。ローソク足の確定直前の不適切なタイミングでのエントリーを防ぎ、チャート上に現在のサーバー時間を常に分かりやすく表示します。 その他の製品はこちら -> こちらをクリック 。 ローソク足のクローズ時間を正確に把握することは、多くの取引システムにおいて意思決定を行う上で非常に有益です。本インジケーターは、このプロセスを自動化し、ワークスペースを乱すことなく、チャート上に直接残り時間を表示します。 主な特徴 現在足のタイマー(Bid価格に追従) — 現在の価格線のすぐ横に残り時間を表示します。タイマーの色は、ローソク足の方向(陽線または陰線)に応じて自動的に変化するため、市場の勢いを視覚的に素早く把握することができます。 設定可能な3つのコーナータイマー — 選択した最大3
FREE


発見が困難で頻度が少ないため、分岐は最も信頼できる取引シナリオの1つです。このインジケーターは、お気に入りのオシレーターを使用して、通常の隠れた分岐点を自動的に見つけてスキャンします。 [ インストールガイド | 更新ガイド | トラブルシューティング | よくある質問 | すべての製品 ]
取引が簡単
通常の隠れた発散を見つけます 多くのよく知られている発振器をサポート ブレイクアウトに基づいて取引シグナルを実装します 適切なストップロスおよび利益レベルを表示します
設定可能なオシレーターパラメーター カスタマイズ可能な色とサイズ バー単位でサイズ別に分岐をフィルタリング パフォーマンス統計を実装します 電子メール/音声/視覚アラートを実装します 幅広い市場の見通しを提供するために、異なるオシレーターを使用して、干渉なしで同じチャートにインジケーターを何度もロードできます。このインジケーターは、次のオシレーターをサポートしています。 RSI CCI MACD オスマ 確率的 勢い 素晴らしい発振器 加速器発振器 ウィリアムズパーセントレンジ 相対活力指数 特に外国為替市場では、

ご購入後、MQL5で私にメッセージをお送りいただくと、Smart Universal Expert Advisorを無料で受け取れるほか、オンライン講座、PDFマニュアル、非公開グループへのアクセスもご利用いただけます。 市場をスキャン。セットアップを比較。次のチャートを選ぶ。 Axiom Matrix (MetaTrader 5) は複数銘柄・複数時間足の分析を一つのダッシュボードに集約します。チャートを一つずつ開かずに注目する市場を探せます。 気配値表示または選択した銘柄を複数の時間足でスキャン。 トレンド、モメンタム、出来高、ボラティリティ、市場環境の質を比較。 Best Axiom Pick、シグナルの状態、クリックできるセルでセットアップを確認。 Axiom Matrix は分析用ダッシュボードです。取引は実行しません。 スクリーンショットで画面を確認し、購入者のレビューをご覧ください。 製品に関するご質問、設定方法、技術サポートについては、MQL5で直接メッセージをお送りください。 — Issam 取引にはリスクがあります。過去の結果は将来の成果を保証しません。まずデモ口座

供給と需要のオーダーブロック:
「供給と需要のオーダーブロック」インジケーターは、外国為替のテクニカル分析において重要なスマートマネーの概念に基づいた洗練されたツールです。このツールは供給と需要ゾーンを特定し、機関投資家が重要な足跡を残す重要な領域に焦点を当てています。売り注文を示す供給ゾーンと買い注文を示す需要ゾーンは、トレーダーが価格の逆転や減速を予測するのに役立ちます。このインジケーターは、ブレイクアウト・オブ・ストラクチャー(BoS)およびフェアバリューギャップ(FVG)のコンポーネントを組み合わせた賢明なアルゴリズムを採用しています。BoSは市場の混乱を検出し、潜在的なオーダーブロックを特定し、FVGは精度を向上させるためにフェアバリューギャップを考慮しています。このツールはこれらの条件の視覚的表現を提供し、潜在的なオーダーブロックを強調し、市場のダイナミクスや転換点に関する洞察を提供することで、トレーダーの意思決定を支援します。使いやすいデザインは、さまざまな技術的な専門知識レベルのトレーダーにアクセスしやすく、高度な分析の包括的なソリューションを提供します。
特徴:
FREE

もう勘でトレードしなくていい。 エントリーのタイミング、決済の場所、相場がどちらに傾いているか、そのすべてが1つのチャートで分かります。 RelicusRoad Proは、20種類近くのツールを1つのインジケーターにまとめました。自分のトレードスタイルに合うツールだけをオンにできます。 エントリーは明確に。決済も明確に。すべてのチャートに計画を。 心当たりはありませんか? 買った途端、1分もしないうちに価格が逆行する。 早めに決済してしまい、その後も値動きが続くのを眺めている。 チャートにインジケーターを5つ並べても、答えは5通りある。 ストップロスの位置は、なんとなく決めている。 開発した理由 私たちは18年間、FXを取引してきました。RelicusRoadの中核となるアルゴリズムは、最初は非公開で、私たちプロのトレーダー仲間のために作られました。 きっかけは個人的なものでした。毎回同じラインを手で引き、自分たちで決めたルールを破り、チャート上の重要な一点を見落とすことに、私たちは疲れていたのです。 私たちにとって効いたのは一貫性です。毎日同じ方法で相場を読み続け、それが体に染みつく

Quantum Direction は、市場の方向性を把握し、トレンドの初期変化を検出し、フィルタリングされたエントリーおよび決済シグナルを提供するために設計された、プロフェッショナルなトレンドフォロー型インジケーターです。 このインジケーターには、MQL5 Marketで無料提供されているプロフェッショナルな取引管理ツール Quantum Trade Assistant が含まれています。 Quantum Direction に直接接続し、有効なシグナルが表示されたときに自動的に取引を開始したり、設定された決済条件を満たしたときに取引を自動的に決済したりできます。 無料の Quantum Trade Assistant をこちらからダウンロード このインジケーターの主な特徴: マルチロジック・トレンド検出 — 複数の市場分析条件を組み合わせ、トレンドの始まりや方向転換の可能性を検出します。 セッションフィルター — 選択した取引セッションにシグナルを集中させ、市場の活動性とボラティリティが高い時間帯の取引機会を分析しやすくします。 上位時間足フィルター — 上位時間足を使用して市場の

Haven FVG Indicator 2.0 - 市場の不均衡分析の新次元 大幅なアップデート、 Haven FVG Indicator 2.0 の登場です!これはフェアバリューギャップ(FVG)を扱うためのプロフェッショナルなツールであり、これまで以上に強力になりました。今回のバージョンでは、本格的なマルチタイムフレーム(MTF)分析と高度な通知システムを実装しました。これにより、チャートを切り替える時間を無駄にすることなく、スマートマネーコンセプト(SMC)に基づいたトレードを最高精度で行うことが可能になります。 他の商品もご覧ください — > こちら | Market Structure PRO — > こちら . フェアバリューギャップ(FVG)は、市場が効率的でなかった場所、つまり「スマートマネーの痕跡」を表しています。バージョン2.0では、これらの痕跡を現在のチャート上だけでなく、上位足(H1、H4、D1)でも同時に確認できるため、市場のコンテキストをグローバルに把握することができます。 バージョン2.0の新機能 マルチタイムフレーム(MTF)分析 — 上位足のFVGを
FREE

OrderFlux – MetaTrader 5用 オーダーフロー & フットプリント インジケーター OrderFlux は、MetaTrader 5向けのプロフェッショナルなオーダーフローおよびフットプリントインジケーターです。個々のローソク足を展開し、その内部で何が起こっているかを明らかにします:各価格レベルでの取引量を、アグレッシブな買い手と売り手に分けて表示します。これらのティックデータから、 Delta、Imbalance、Volume Profile、および Market Profile を含む完全なフットプリントチャートがリアルタイムで構築されます。 標準的なチャートには、始値、高値、安値、終値のみが表示されます。それは動きの結果であり、原因ではありません。OrderFluxはすべてのローソク足の微細構造を可視化し、最も重要な1つの質問に答えます: 「誰が実際にその動きを主導したのか?」 これにより、ローソク足の形状だけで推測するのではなく、実際の取引量からサポートとレジスタンスを読み取ることが可能になります。 フットプリントの表示内容 すべての価格レベルで、2つの数字

Power Candles V3 - 自己最適化型強弱インジケーター Power Candles V3は 、通貨や銘柄の強さを、適用されたすべてのチャート上で実行可能なトレードプランに変換します。単にローソク足を色分けするだけでなく、バックグラウンドでリアルタイムの自動最適化を実行し、目の前の銘柄に対して最適なストップロス、テイクプロフィット、およびシグナルの閾値を提示します。ワンクリックで実取引に適用でき、エントリーポイント、ストップロス、テイクプロフィットのラインが正確な価格位置にチャート上に表示され、方向性を示すアラートがリアルタイムで発動します。 このツールは、Stein Investmentsのエコシステムの一部です。
18種類以上のツールをすべて閲覧し、AIを活用したセットアップの推奨事項を入手し、 https://stein.investments でコミュニティに参加しましょう
クローズしたバーごとに3,000回以上のトレードシミュレーション。9つの強さの状態。2つの戦略を並行してテスト。勝率の高い設定をワンクリックで適用。
なぜこれが必要なのか ほとんどの強

Smart Price Action Concepts — MetaTrader 5 ご購入後、MQL5で私にメッセージをお送りいただくと、Smart Universal Expert Advisorを無料で受け取れるほか、オンライン講座、PDFマニュアル、非公開グループへのアクセスもご利用いただけます。 構造を確認し、ゾーンを見つけ、取引プランを立てる。 Smart Money Concepts(SMC)、ICTスタイルの分析、プライスアクションを、見やすいチャートにまとめます。市場構造、オーダーブロック、流動性の参考水準、インバランスを確認し、Smart Panelで表示する要素を選択できます。 市場をより体系的に分析 • 市場構造:内部構造とスイング構造、HH/HL/LL/LH、BOSとCHoCH、上位時間足分析、複数時間足ダッシュボード。
• 主要ゾーン:内部およびスイングのオーダーブロック、需給ゾーン、Fair Value Gaps、プレミアム・均衡・ディスカウントゾーン。
• 流動性の参考水準:同値高値・安値、強い・弱いスイングポイント、前日・前週・前月の高値と安値。

Neuro Athena is an absolutely new way to get precise entry and exit trading signals. It uses the Fibonacci sequence as the basis for the calculation of its levels. With Neuro Athena you will always know when to open and close your trades with profit. Message me and get Neuro Athena Assistant as a gift to automize your trading process! Why should you choose Neuro Athena? 1. Reliable Algorithm. Fibonacci sequence is not a new-age marketing slop that feels the Internet nowadays - it is one of the m
FREE
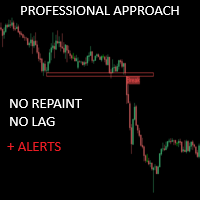
クリティカルゾーンは、より正確なマーケットエントリーを求める手動トレーダーのために特別に作成されました。このインディケータは、チャート上の最も関連性の高いサポートとレジスタンス、 およびそれらのブレイクアウトとリテストを計算することで、高度なアルゴリズ ムを使用して関心領域を検出します。このインディケータは、潜在的に有利な買い/売りの機会が検出された場 合にアラートと通知を送信するように設定でき、トレーダーが画面/ MT4 バージョンの前にいないときでも取引機会を把握することができます。
特徴 リペイントなし このインディケータは、新しいデータが到着してもその値を変更しません 取引ペア すべてのFXペア 季節性 すべての季節性
パラメータ ===== サポートとレジスタンスの設定
計算のために参照するバー // サポートとレジスタンスのレベルを計算するために、現在のバーから 逆方向のバーの範囲。
===== 条件
ブレイクアウト // ブレイクアウト検出のオン/オフ
再試行 // 再試行の検出を有効または無効にする
===== サポートとレジスタンスのス
FREE

FX Trend NG:次世代マルチマーケット・トレンドインテリジェンス 概要
FX Trend NG は、複数の時間足に対応したプロフェッショナル向けトレンド分析およびマーケット監視ツールです。 市場全体の構造を数秒で把握することができます。 複数のチャートを切り替える必要はありません。どの銘柄がトレンド中なのか、どこでモメンタムが弱まっているのか、そしてどの時間足で強い整合性があるのかを瞬時に確認できます。 ローンチ特別オファー – FX Trend NG を $30(6ヶ月) または $80 永久ライセンス でご利用いただけます。 すでに Stein Investments のユーザーですか? -> メッセージを送信 して、プライベートグループへアクセスしてください。 セットアップや詳細情報が必要ですか? -> Stein Investments 公式ページ をご覧ください。 1. FX Trend NG が他と異なる理由 3ステート・トレンドロジック ― Buy と Sell だけではない
• 多くのインジケーターは Buy または Sell の2状態のみを表示します。

IX Power: 指数、商品、暗号資産、外国為替市場の洞察を発見 概要
IX Power は、指数、商品、暗号資産、外国為替市場の強弱を分析するための多用途ツールです。 FX Power が全ての利用可能な通貨ペアデータを活用して外為ペアで最高の精度を提供する一方、 IX Power は基礎資産の市場データにのみ焦点を当てています。この特性により、 IX Power は非外為市場に最適であり、単純な外為分析にも信頼性の高いツールです。どのチャートでもスムーズに機能し、取引判断を向上させるための明確で実行可能な洞察を提供します。
1. IX Power がトレーダーにとって価値がある理由 複数市場での強弱分析
• IX Power は指数、商品、暗号資産、外為シンボルの強弱を計算し、それぞれの市場に合わせた洞察を提供します。
• US30、WTI、ゴールド、ビットコイン、または通貨ペアなどの資産を監視して取引機会を発見できます。 幅広い市場に適応
• 外為取引では、 FX Power が関連する全ての通貨ペアを分析することで比類のない精度を提供します。
• IX Power

M1 Quantum を使用したライブトレードシグナル : シグナル (取引は 自動的に Quantum Trade Assistant によって実行され、この製品に 無料 で含まれています。) 最新ニュース: バージョン1.64がリリースされました。現在、すべての取引で、関連するサポート/レジスタンスゾーンの後ろにStop Lossが設定されます。今回のバージョンでは、EAのパフォーマンスを向上させるためにSmart Close機能も改善されました。
8月9日から、ライブシグナルはバージョン1.64で稼働しています。 価格プラン: 現在価格: $169 (早期購入者向けオファー) 次回予定価格: $189 予定小売価格: $299 開発者からのお知らせ: ご購入後、 最新の推奨設定ファイル(Set File) 、運用アドバイス、および他の M1 Quantum ユーザーと交流できる VIPサポートグループ への招待をご希望の場合は、お気軽にご連絡ください。 よくある質問 - 設定ファイル - インストールガイド
M1 Quantum は、M1専用のプロフェッショナルトレーディング

Break and Retest Hunter is a powerful MetaTrader 5 indicator designed to automatically identify support and resistance levels, breakout structures, and potential retest opportunities in real time. Bonus Indicator: After purchasing Break and Retest Hunter , contact me to receive Trade Indicator Assistant EA completely free as a bonus utility.
$65 for the next 10 copies . Next price is $120.
Combining adaptive market analysis, clear BUY/SELL signals, Fibonacci-based profit targets, and a premiu

Free SMC indicator for MetaTrader 5. SMC Nexus Market Structure draws the two things every Smart Money Concepts (SMC) trader reads first: market structure (BOS / CHoCH) and order blocks. Nothing else on the chart — no clutter, no lag, no repainting. Structure breaks are confirmed on closed bars only. A level that printed yesterday still sits exactly where it printed. What you get Market Structure — dual level (internal + external) BOS and CHoCH, labelled and colour-coded. Read the minor swing st
FREE

SMC Buy Sell KPG - ユーザーガイド (MT5)
SMC Buy Sell KPGは、スマートマネーコンセプト(SMC)に基づくMetaTrader 5用インジケーターです。チャート上に買いシグナルと売りシグナルを表示し、多くのトレーダーが価格行動の分析に使用する市場構造の要素を可視化します。
本インジケーターは、重要な構造的特徴をチャート上に直接表示することで意思決定を支援するよう設計されており、市場構造のブレイクとキャラクターの変化(CHoCH)、オーダーブロック、フェアバリューギャップ(FVG)、イーブンハイ・イーブンローのレベル、プレミアムゾーンとディスカウントゾーン、直近のスイングポイントなどが含まれます。
買いシグナルと売りシグナルは色付きの矢印で表示されます。各矢印には、現在の市場状況に基づいた推定精度を反映したパーセンテージ数値が含まれています。新しいシグナルが確定足に現れると、本ツールは音声アラーム、画面上のポップアップ、スマートフォン通知も作動させます。
日足・週足・月足チャートの上位時間足の高低点レベルを現在のチャートに描画し、追加の状況
FREE

CRT Pro is a complete Candle Range Theory toolkit for MetaTrader 5. It finds the CRT model on up to three timeframes and adds the tools needed to read it: higher-timeframe candles, structure shifts, fair value gaps, liquidity sweeps, a bias table and SSMT divergence. Every module can be switched on or off.
1. CRT Model
A CRT model is built from two candles of the chosen CRT timeframe. C1 is the range candle. C2 is the sweep candle: it takes the high or the low of C1 and closes back inside the

Over 100,000 users on MT4 and MT5 Blahtech Candle Timer displays the remaining time before the current bar closes and a new bar forms. It can be used for time management Links [ Install | Update | Training ] Feature Highlights
The only candle timer on MT5 with no stutter and no lag S electable Location Tracks server time not local time Multiple colour Schemes Configurable Text Customisable alerts and messages Optimised to reduce CPU usage Input Parameters Text Location - Beside / Upper Le
FREE

CRYSTAL QUANTUM PRO Institutional Signal & Trade Intelligence for MetaTrader 5 Final Price: 199 USD ----> Price goes up 10 USD after every 10 sales. Limited launch slots available, act fast. Most indicators give you an arrow and leave you alone. A naked arrow is a gamble. Winning consistently requires CONFLUENCE , a clear STOP and TARGET , and honest PROOF that the system works. Crystal Quantum Pro delivers all three in one clean, no-repaint package. Crystal Quantum Pro is a complete decision sy

通貨強さウィザードは、取引を成功させるためのオールインワン ソリューションを提供する非常に強力な指標です。このインジケーターは、複数の時間枠のすべての通貨のデータを使用して、このまたはその外国為替ペアのパワーを計算します。このデータは、使いやすい通貨インデックスと通貨パワーラインの形式で表され、特定の通貨のパワーを確認するために使用できます。 必要なのは、取引したいチャートにインジケーターを接続することだけです。インジケーターは、取引する通貨の実際の強さを示します。このインジケーターは、トレンドに合わせて取引するときに有利に利用できる売買高の圧力の極値も示します。このインジケーターには、フィボナッチに基づく可能なターゲットも表示されます。 このインジケーターは、PUSH 通知を含むあらゆるタイプのアラートを提供します。 購入後ご連絡下さい。私の取引のヒントをあなたと共有し、素晴らしいボーナスインジケーターを無料で提供します! 幸せで有益な取引をお祈りします。

ICT PO3 (Power of 3) AMD Protocol Framework Indicator
True Time & Structure Integration | Non-Repainting | Real-Time | Multi-Asset | MT4 Version Available
Full Setup Guide & Strategy Playbook: https://www.mql5.com/en/blogs/post/768683
The ICT Power of Three (PO3): The Complete Guide to Accumulation, Manipulation, and Distribution
https://www.mql5.com/en/blogs/post/771729
MT4 Version: https://www.mql5.com/en/market/product/171742
Indicator Overview
The ICT PO3 AMD Protocol Framework i
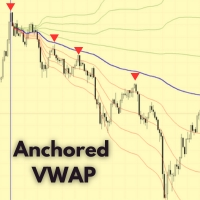
MetaTrader 5 向け Anchored VWAP インジケーター – プロ仕様の出来高加重平均価格ツール Anchored VWAP インジケーター は、任意のローソク足やイベントポイントから 出来高加重平均価格 (VWAP) を計算できます。標準VWAPのように毎日リセットされることはなく、 任意の時点にアンカーを設定できるため、機関投資家の価格帯や公正価値の分析に最適です。 主な特徴 柔軟なアンカーポイント設定。 誤操作を防ぐロック機能付き。 全てのMT5タイムフレームに対応。 価格と出来高の変化に応じて自動更新。 色・スタイル・線の太さを自由にカスタマイズ可能。 オプションのVWAP偏差バンドで価値ゾーンを表示。 使用方法 インジケーターをチャートに適用します。 任意のローソク足をダブルクリックしてアンカーを設定します。 VWAPが市場の変化にどのように反応するか観察します。 サポートと更新 無料のアップデートと迅速なサポートが含まれています。 今すぐダウンロード Anchored VWAP for MetaTrader 5 を今すぐダウンロードして、プロフェッショナル
FREE

SMC PRO TOOLKIT — SMART MONEY ANALYSIS & STRUCTURED TRADE PLANNING SMC Pro ToolKit is a professional Smart Money Concepts analysis workspace for MetaTrader 5. It combines market structure, multi-timeframe analysis, institutional price zones, setup evaluation, confirmation tools, volume context, alerts, and risk planning inside one organized chart environment. One workspace. Multiple layers of confirmation. One structured trading plan.
OPEN COMPLETE USER GUIDE
MULTI-CONDITION SETUP ENGINE At

Bill Williams Advanced is designed for automatic chart analysis using Bill Williams' "Profitunity" system. The indicator analyzes four timeframes at once.
Manual (Be sure to read before purchasing)
Advantages
1. Analyzes the chart using Bill Williams' "Profitunity" system. Signals are displayed in a table in the corner of the screen and on the price chart. 2. Finds all known AO and AC signals, as well as zone signals. Equipped with a trend filter based on the Alligator. 3. Finds "Divergence Bar

現在33%オフ 初心者にもエキスパートトレーダーにも最適なソリューション このインジケーターは独自の機能と新しい公式を多数内蔵しており、ユニークで高品質かつ手頃な取引ツールです。このアップデートでは、2つの時間枠ゾーンを表示できるようになります。より長いTFだけでなく、チャートTFとより長いTF(ネストゾーンを表示)の両方を表示できます。すべてのSupply Demandトレーダーの皆さんのお気に召すはずです。:)
重要情報の公開 Advanced Supply Demandの可能性を最大化するには、 https://www.mql5.com/ja/blogs/post/720245 にアクセスしてください。 エントリーまたはターゲットの正確なトリガーポイントを正確に特定できれば取引がどのように改善されるか想像してみてください。新しい基盤となるアルゴリズムに基づいて構築されているため、買い手と売り手の間の潜在的な不均衡をさらに簡単に特定できます。これは、最も強い需要と供給のゾーンと、過去のパフォーマンス(古いゾーンを表示)がグラフィカルに表現されるためです。これらの機能は、最適な

The Premium RangeXpert Extension with Multi-Timeframe Trading Signals for Forex, Gold & Bitcoin
RangeXpert+ is the premium extension of the well-known RangeXpert — one of the Top-10 free indicators on the market, with over 10,000 downloads and an extremely active community. While the free version delivers precise breakout signals on a single chart, RangeXpert+ provides exactly what professional traders demand: a complete multi-timeframe cockpit directly in your chart, perfectly optimized for h
123456789101112131415161718192021222324252627282930313233343536373839404142434445464748495051525354555657585960616263646566676869707172737475767778798081828384858687888990919293949596979899100101102103104105106107108109110111112113114115116117118119120121122123124125126127128129130131132133134135136137138139140141142143144145146147148149150151152153154155156157158159160161162163164165166167168169170171172173174175176177178179180181182183184185186187188189190191192193194195196197198199200201202203204205206207208209210211212213214215216217218219
MetaTraderマーケットが取引戦略とテクニカル指標を販売するための最適な場所である理由をご存じですか?宣伝もソフトウェア保護も必要なく、支払いのトラブルもないことです。これらはすべて、MetaTraderマーケットで提供されます。

取引の機会を逃しています。
- 無料取引アプリ
- 8千を超えるシグナルをコピー
- 金融ニュースで金融マーケットを探索