Hammer Shooting Star
- インディケータ
- バージョン: 1.5
- アップデート済み: 2 7月 2026
- アクティベーション: 5

Hammer Shooting Star v1.5 – Multi-Timeframe Background Pattern Scanner & Pivot Points
Author: LIANG1990
Are you searching for a reliable tool to identify high-probability market reversals without cluttering your workspace with dozens of open charts?
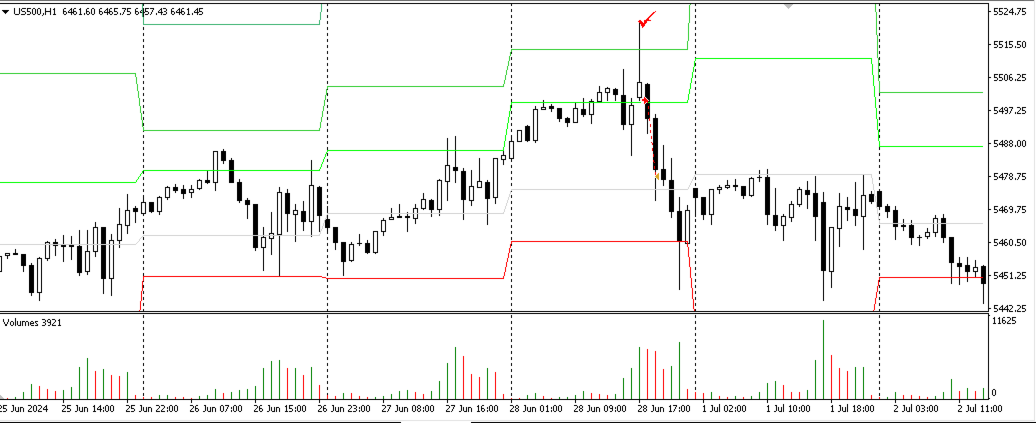
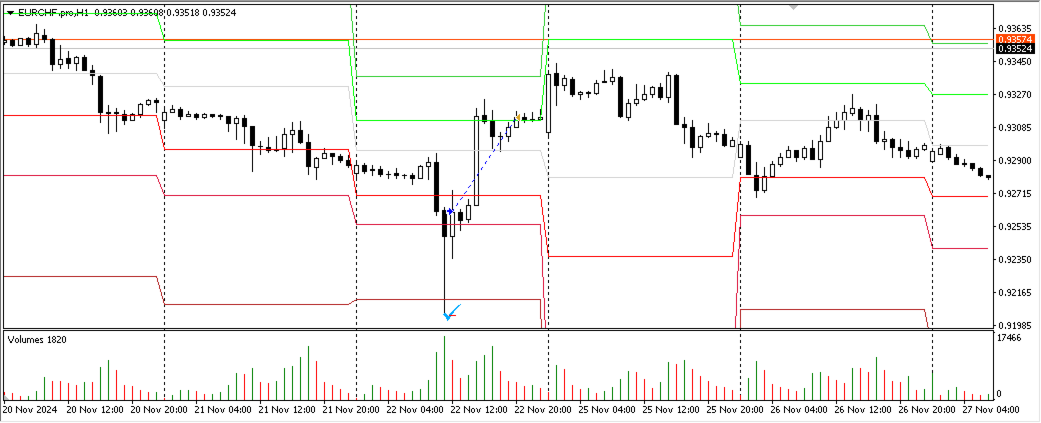
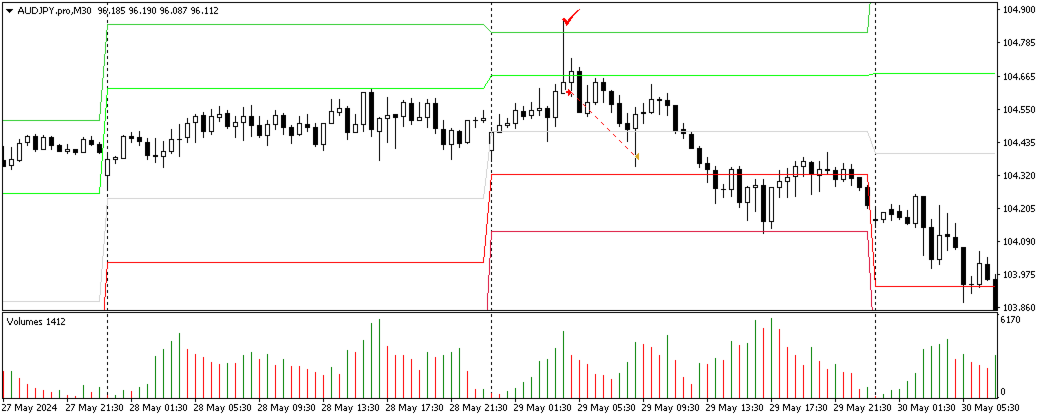
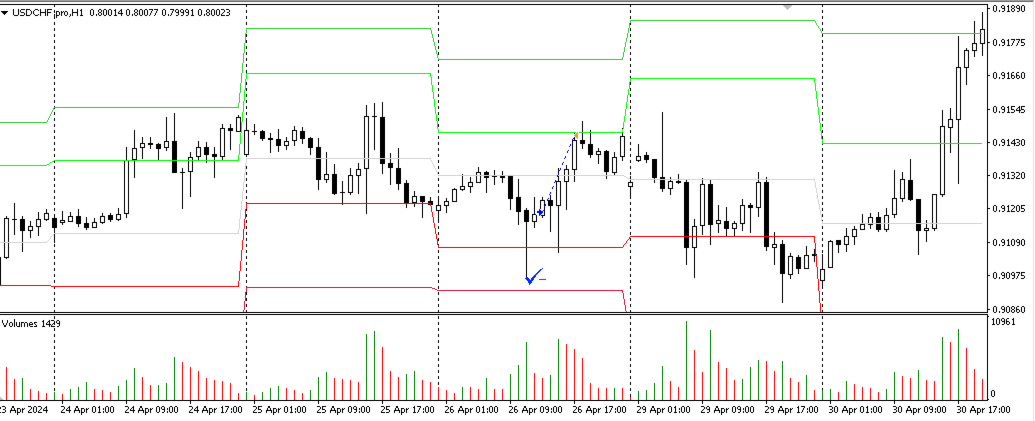
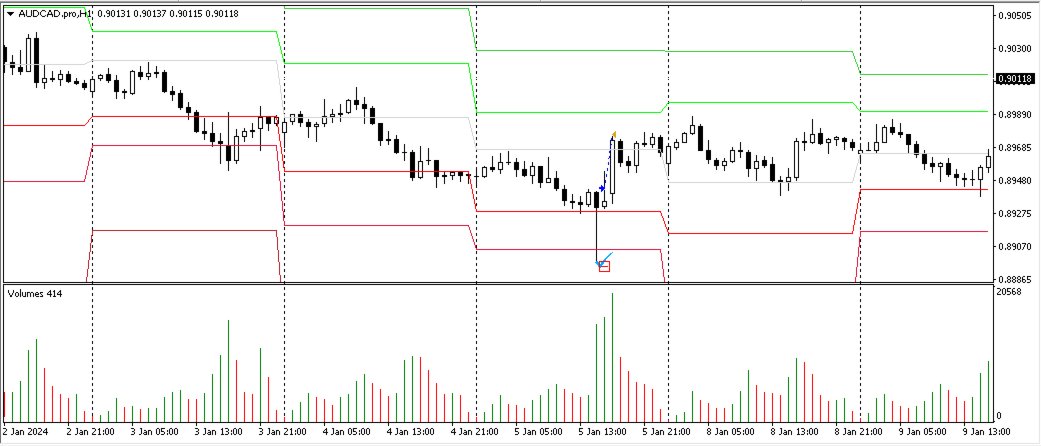
Hammer Shooting Star v1.5 is a professional, high-performance MT4 indicator designed to automatically scan and detect premium Hammer and Shooting Star candlestick formations. Powered by a brand-new multi-timeframe core, it monitors M15, M30, H1, and H4 simultaneously in the background—allowing you to fully track an instrument using just one single chart.
Unlike basic pattern indicators that alert on every single candle structure, this institutional-grade tool applies strict proprietary filters (shape, body-to-wick ratio, trend alignment, moving averages, and volatility structures) to filter out market noise and highlight only the highest-probability setups.
🔑 Key Features
-
🚀 Advanced Multi-Timeframe Background Engine: Automatically scans and monitors M15, M30, H1, and H4 timeframes completely in the background. You only need to open 1 single chart per symbol!
-
🎯 Intelligent Signal Display Logic: Candlestick arrows are dynamically filtered to display ONLY on your current chart timeframe, keeping your analysis workspace exceptionally clean and professional.
-
📢 Omnipresent Universal Alerts: Real-time alert notifications trigger for ALL 4 scanned timeframes simultaneously, no matter which timeframe you are currently viewing on your screen.
-
📊 Integrated Classic Pivot Points: Fully built-in Classic Pivot Points system (PP, S1-S4, R1-R4) with customizable calculation baselines (Default: D1). Instantly plots key institutional support and resistance reversal zones.
-
🛡️ Smart History Scan & Anti-Duplicate Alert Logic: Features an advanced initialization safeguard using a global flag. It accurately loads historical arrows without throwing annoying, duplicated audio or popup alerts upon chart load or timeframe switching.
-
📱 Full Notification Suite: Instant alerts delivered via MT4 Popups, Sound alerts, Email notifications, and Mobile Push Notifications.
-
🌍 Universal Market Compatibility: Works seamlessly across Forex, Spot Metals (Gold/Silver), Indices, Commodities, and Crypto.
📈 Advanced Trading Strategy & Workflow (Recommended)
To maximize your trading efficiency and keep your execution terminal lightning-fast, we highly recommend implementing a professional Dual-MT4 Terminal Setup:
💡 Pro-Tip: Many advanced traders prefer installing a second, lightweight MT4 terminal instance (or running it on a VPS) dedicated exclusively to background scanning and alert generation.
🖥️ 1. The Scanning MT4 (Your Pattern Center)
-
Open exactly ONE chart for each financial instrument you wish to monitor (e.g., 1 chart for EURUSD, 1 chart for XAUUSD, 1 chart for BTCUSD).
-
Attach this indicator to that single chart.
-
The indicator will immediately begin scanning M15, M30, H1, and H4 simultaneously in the background for that specific asset. You no longer need to waste system resources by opening 4 separate charts per symbol!
📉 2. The Trading MT4 (Your Execution Space)
-
Keep your primary trading terminal completely clean, dedicated solely to precise order execution, manual chart mapping, and active position management.
-
When your Scanning MT4 fires an instant Push or Popup alert for a specific symbol and timeframe, simply bring up that asset on your Trading MT4 to evaluate the structure and place your trade.
💡 Personal Trading Tips (Optional)
For improved reliability, consider combining this indicator with:
-
Classic Pivot Points (to locate potential reversal zones).
-
Volume indicators (to confirm market participation).
-
Support/Resistance tools of your choice (to filter out weak signals).
-
For higher accuracy, focus on instruments with continuous 24-hour trading (Forex, Crypto) or long-session markets (Gold, Major Indices).
-
If the previous day was a market holiday, signals on the next day may be less reliable.
-
Always confirm signals with your own analysis (volume, pivot points, support/resistance).
-
This way, Hammer/Shooting Star signals can become part of a more complete strategy.
📘 Example Entry Rules (Optional Use)
These are suggested guidelines on how traders may choose to use the signals.
They are provided for educational purposes only — always confirm with your own strategy.
Hammer Pattern:
-
Entry: Place a buy order when price breaks above the Hammer’s high.
-
Stop Loss: Set below the Hammer’s low.
-
Take Profit 1: Close 80% of the position at Entry + (Hammer candle size).
-
Remainder: Trail the stop loss on the remaining 20% to capture potential longer-term profits.
Shooting Star Pattern:
-
Entry: Place a sell order when price breaks below the Shooting Star’s low.
-
Stop Loss: Set above the Shooting Star’s high.
-
Take Profit 1: Close 80% of the position at Entry – (Shooting Star candle size).
-
Remainder: Trail the stop loss on the remaining 20% for possible extended downside moves.
Additional Rule:
-
If price does not reach TP1 within 3 bars after the pattern forms, and fails to break the trigger level (Hammer high / Shooting Star low), cancel the order.
-
This avoids taking signals that lose reliability after too much delay.
⚠️ Technical Limitations & Vital Notes
-
🚫 Not Recommended for M1 / M5: The scanning parameters are strictly mathematically tuned for structural swings. Operating on 1-Minute or 5-Minute charts introduces excessive market noise and significantly lowers institutional accuracy.
-
❌ Higher Timeframe Limitations: Daily (D1), Weekly, and Monthly timeframes are not supported within this background scanning matrix. Please focus your strategies on the heavily optimized M15, M30, H1, and H4 environments.
-
🌌 Best Market Environments: For ultimate performance, run the scanner on high-liquidity, 24-hour markets (e.g., Major Forex Pairs, Major Cryptocurrencies) or instruments with prolonged, continuous trading sessions (e.g., XAUUSD/Gold, Major Stock Indices).
-
📅 Avoid Post-Holiday Sessions: Avoid relying heavily on signals generated immediately following major market holidays. Because the built-in trend filters and Pivot Points systems rely heavily on previous Daily (D1) candle metrics, distorted or incomplete daily candles produced during short holiday sessions can reduce scanner accuracy.
❓ FAQ
-
Q: Does this indicator incorporate volume analysis?
-
A: No. Volume confirmation is omitted from the core code to keep execution fast. Volume or order flow filtering is left entirely to the trader's discretion.
-
Q: How many terminal activations are provided?
-
A: Each purchase includes 5 activations, standard under the MQL5 Market policy.
-
Q: Can I combine this with other trading indicators?
-
A: Absolutely! While Pivot Points are already built directly into the software, combining these candle alerts with your own structural Support/Resistance zones, Moving Averages, or Order Blocks creates an incredibly robust trading system.
⚖️ Disclaimer
This indicator is a technical analysis software tool and does not guarantee financial profitability. Trading financial markets involves substantial risk. Always test thoroughly on a demo account before applying this tool to live trading environments. Use entirely at your own risk.