Channel Arg Control

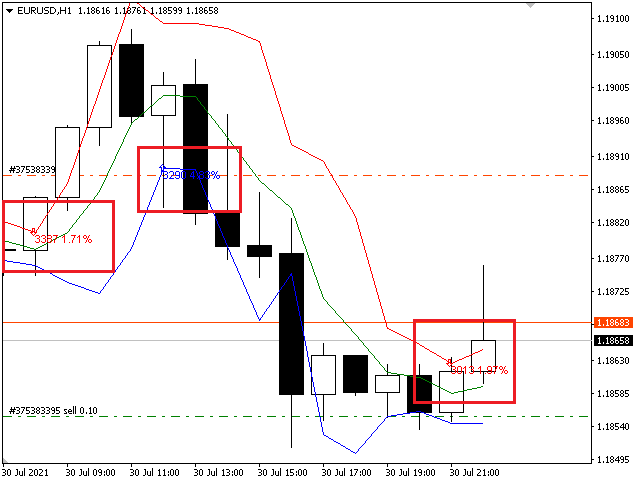
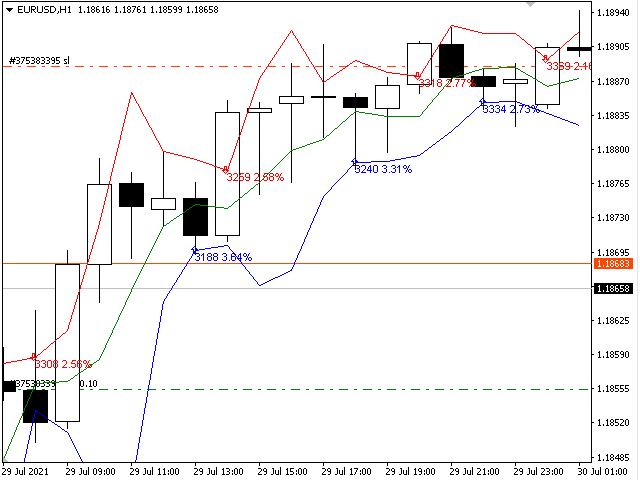
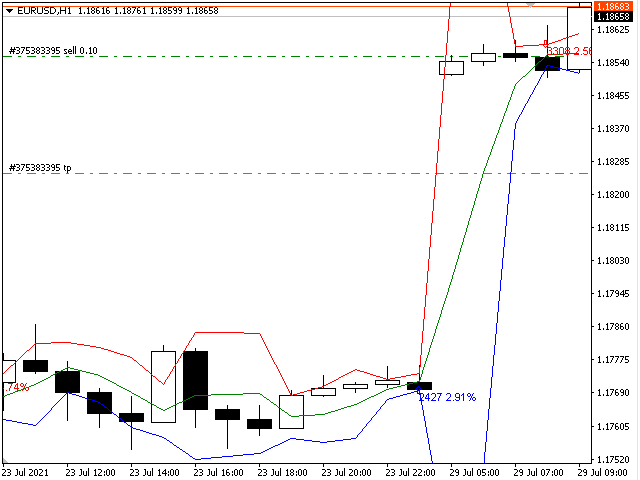
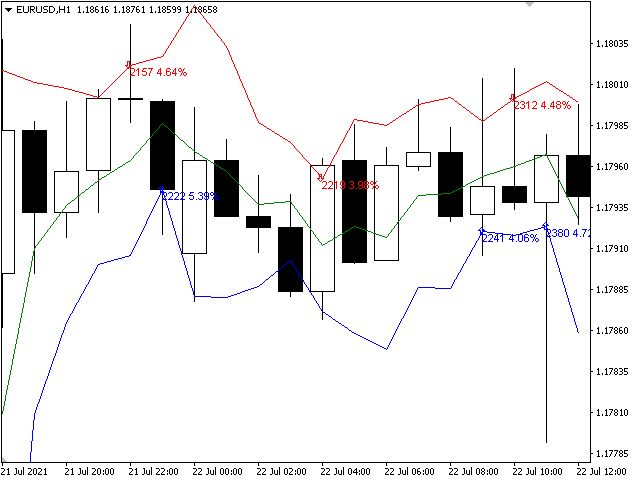
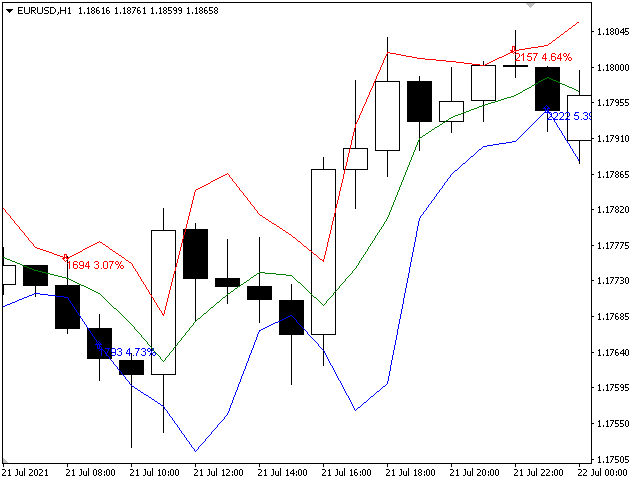
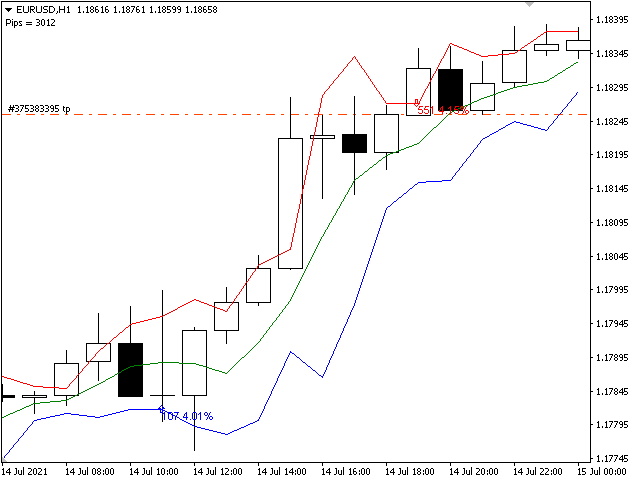
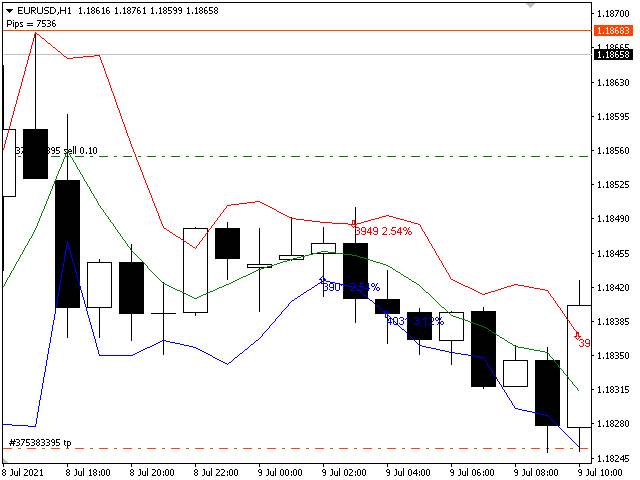
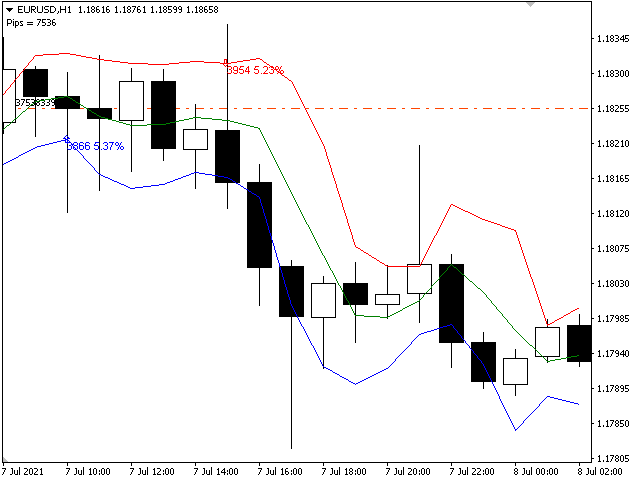
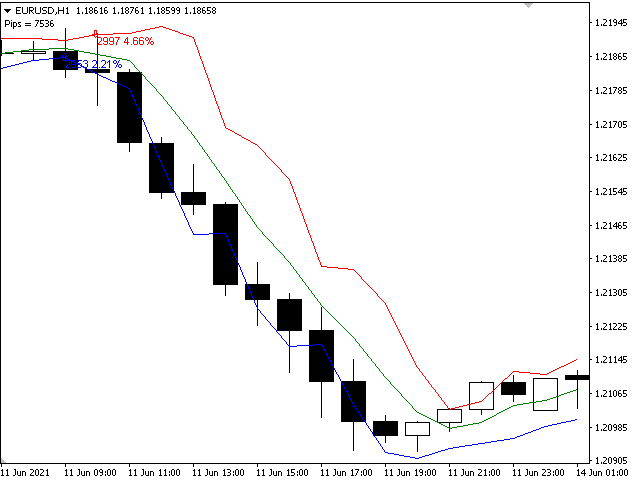
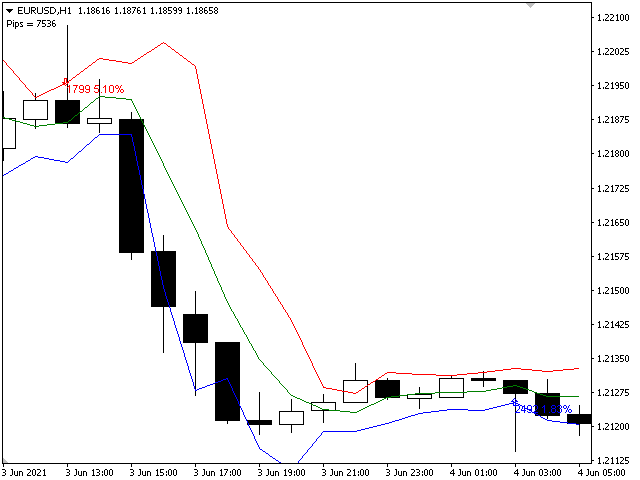
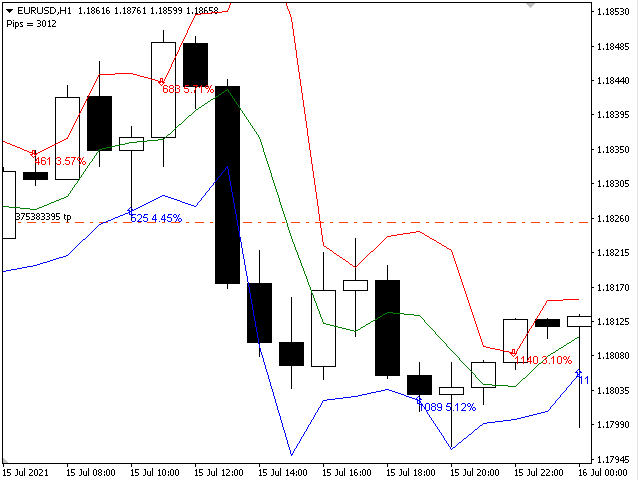
The Channel Arg Control indicator, in addition to lines, reflects entry signals in the form of arrows. But how to do that? At first glance, this is not an easy task. But not for the Channel Arg Control indicator, this indicator will tell you whether you have configured the indicator correctly, while you can specify the history interval in the bars that interests you. And yet, how does the indicator tell you? Look at the numbers on the chart near the arrows! This is exactly what you thought, these are profit pips from a series of entries on the indicator. Profit pips are calculated for the specified interval, the interval for calculation is set in the indicator, as a rule, 1000 bars are enough for this.

By default the indicator is EURUSD and H1, the indicator needs to be configured for each period and symbol.

All calculations are based on opening prices, there is no delay for any bar! If the arrow is opened, it will not disappear. It opens when the price touches the channel line, if the filter allows it. The signal can be read without any problems by any bot. The cxbn signal is used not only for the lines, but also for the arrows directly, from the zero bar. Siglals are easy to read and without a catch. All work is as transparent as possible.

An example of reading by a bot:

double iBuy = iCustom (0, 0, ":: Indicators \ Channel Agr Control.ex4", FullReCalc, LimitCalcHistory, Spread, Length, Deviation, VolatilityAVG, Volatility, VolatilityPercentageLimit, 3, 0);

double iSell = iCustom (0, 0, ":: Indicators \ Channel Agr Control.ex4", FullReCalc, LimitCalcHistory, Spread, Length, Deviation, VolatilityAVG, Volatility, VolatilityPercentageLimit, 4, 0);

if (iBuy> 0)

{

...

}

if (iSell> 0)

{

...

}


You can adjust the channel settings for any symbol and timeframe. The trading system is ready! The indicator takes into account spread losses, which you can set in the settings. The indicator filters signals using volatility control. At a certain interval, you can choose the optimal settings for any symbol and timeframe and work with them calmly.

Parameters:
  • FullReCalc - forces the pips of profit to be recalculated on each bar (a specified amount of LimitCalcHistory).
  • LimitCalcHistory - Limits the amount of history to recalculate the profit chin.
  • Spread - Specify the spread that is lost on each bar when calculating the pro-fit.
  • Length - The length of the channel.
  • Deviation - Channel width.
  • VolatilityAVG - The number of bars for calculating the momentary volatility.
  • Volatility - The number of bars to calculate the total volatility.
  • VolatilityPercentageLimit - The limit of volatility, here you need to choose a good one, it greatly affects profitability.

American traders say: “Trend is your friend”, which means “Trend is your friend”. And indeed it is! By trading with the trend, you reduce your risks and gain an advantage, as you increase the mathematical expectation of completed trades and, therefore, earn more profit. Together with the Channel Arg Control indicator, you will trade with the trend with ease! This is one of the most effective ways to work with market trends, which has helped to increase the number of transactions for more than one hundred traders.
おすすめのプロダクト
This Indicator is use the ZigZag to calculate the Upper and  Lower Bound and the uptrend and the downtrned. Red for downtrend, Green for uptrend and Yellow is for the horizontal trend this horizontal trend also bookmarked the upper limited and the lower limited the the price swings.  Or in simple the Support and the Resistance level. However, You may use the Heikin Ashi to confirm the trend of the buy sell signal above. I cannot guarantee the win rate, Nevertheless, you must study well the timef
Automatic, live & interactive picture of all trendlines. Assign push, email and sound alerts to the lines of your choice and be informed about price rollback, breakout, rollback after breakout, number of rollbacks, line expiration by double breakout. Correct, drag or delete the lines and interactively tune the line system. https://youtu.be/EJUo9pYiHFA . Chart examples https: //www.mql5.com/en/users/efficientforex Price Interaction Events All events are effective immediately and only after one
Price Action Scanner Pro is an indicator that identifies price behaviors and provides alerts, offering more features and customization compared to Price Action Scanner   (  https://www.mql5.com/zh/market/product/118937?source=Site+Profile+Seller   )   . This indicator can simultaneously detect signals for up to 15 symbols across different timeframes. You can configure it to detect signals during specific trading sessions such as Asian, European, and US sessions, using different timeframes. This
Трендовый индикатор МТ4, дающий точные сигналы для входа в сделки. Работает без перерисовки и запаздываний! Только покупателем данного индикатора прилагается основной фильтр,обращайтесь в личку.   Идеальные точки входа в сделки для     валют, крипты, металлов, акций, индексов . Наилучшие результаты на таймфрейме M30 и выше! Наш канал в Telegram  |   Версия индикатора для MT5 Скоро   видео  for indicator Большинство трейдеров улучшают торговые результаты в первую неделю торговли с инд
PTW NON REPAINT TRADING SYSTEM + HISTOGRAM Non-Repainting ,   Non-Redrawing   and   Non-Lagging  Trading System. Does the following: - Gives Accurate Entry and Exit Points - Scalping, Day and Swing Trading  - 95% Accuracy  - Targets, where to take profits. - Shows Trends, Support and resistance levels - Works on All Brokers - Works on All Currencies, CFDs and Stocks - It does not place trades for you, it only shows you what trades to place. - It works on All Timeframes - It is for Trend or ran
Yawabeh SD Pro –  Professional Supply and Demand Indicator Trade Smarter with Volume-Confirmed Supply/Demand Zones Our institutional-grade algorithm identifies high-probability reversal zones before price reacts, giving you the edge in Forex, Crypto, and Stocks. Key Features Multi-Timeframe Confirmation – View trend strength across multiple timeframes simultaneously – Align your trades with higher timeframe momentum Smart Alert System – Real-time notifications for: – Strong demand/supply zone
Hammer Shooting Star v1.1 – Advanced Candlestick Pattern Scanner Author: LIANG1990 Are you searching for a reliable tool to identify market reversals with precision? Hammer Shooting Star v1.1  is a professional MT4 indicator designed to scan and detect high-quality Hammer and Shooting Star candlestick formations. Unlike basic pattern indicators, this tool applies multiple built-in filters (shape, size, trend alignment, and contextual conditions) to reduce false signals and highlight only the cle
Limitless MT4は、すべての初心者と経験豊富なトレーダーに適したユニバーサルインジケーターです。 すべての通貨ペア、暗号通貨、生の株式で動作します 無制限のMT4-構成済みで、追加の構成は不要 そして今、主なもの なぜ無制限のMT4なのか? 1再描画の完全な欠如 2トレーディングの最高のスペシャリストによる2年間のテスト 3正しい信号の精度が80%を超える 4ニュースリリース中の取引で好調 取引ルール 1買いシグナル-青い上向き矢印の出現 下向きの赤い矢印の外観を販売するシグナル シグナル後の次のローソク足で取引を開始するには2 3テイクプロフィット チャート上 М1-40ピップ М5-50ピップ М15-55-60ピップ 4ストップロスは利益をとる 5誤った信号をフィルタリングするために、 パラボリックSAR-トレンドとのトレードへの参入を除外する移動平均または同様のトレンドインジケーター。 
PairMaster Buy Sell Arrow Indicator for MT4 Trade Reversals Like a Pro — Catch Every Swing Point with Precision The PairMaster Buy Sell Arrow Indicator is a powerful MetaTrader 4 tool built to identify high-probability swing trading opportunities . Designed for traders who value accuracy, clarity, and simplicity, PairMaster detects key market turning points and plots intuitive buy and sell arrows directly on your chart. Key Features Accurate Swing Point Detection – Automatically identifies ma
Product Description: Buy Sell Arrow Indicator for MT4 Elevate your trading to new heights with the Buy Sell Arrow Indicator for MT4 , a cutting-edge tool crafted to pinpoint high-probability trading opportunities based on advanced candlestick patterns. Tailored for forex traders, especially those targeting GOLD on the 5-minute chart, this MT4 indicator delivers exceptional accuracy with an impressive 85% win rate , empowering you to seize profitable trades with unwavering confidence. Key Fea
The 10PIPS Dynamite is a semi-automated  cutting-edge Forex indicator designed to    automatically revolutionize your trading skills from a being a losing trader to becoming a profitable trader simply by Scalping   10 pips per Trade setup generated by the software. 10PIPS Dynamite Indicator once attached on the main chart it starts an in-depth market analysis based on its unique in-built advanced algorithm which seamlessly combines powerful indicators, statistical analysis, and trend recognition
After Purchase, Please Contact  t.me/hakimsann These Indicator are Mixed on All Logical Value Such As Trend Support and Resistance Candle Pattern Price Action we Combine 2 Bollinger Band  6 Zigzag Periods 4 Relative Strength Index Period 1 MACD Trend Support and Resistance Price Action Pattern Candle Avoiding Doji On Market Can Be Applied On Every Market  24-7 Maksimum Martingale lv 5. First stake 0.4% Balance
**Binary Smart Systemのご紹介:究極のトレードパートナー** Binary Smart Systemは単なるインジケーターではありません。様々な市場で的確なシグナルを提供し、洗練されたアルゴリズムと豊富なテクニカルインジケーターの集合をベースにした、トレーダーを的確さとタイムリーなシグナルで装備するための厳選されたトレードツールです。 **インジケーターコンポーネント:** 1. **移動平均パーセンテージ(MAP):** このコンポーネントは複数の移動平均の加重平均を計算し、トレンドの特定の強力な基盤を形成します。MAPは市場の状況に動的に適応し、現在のトレンド方向に対する洞察を提供します。 2. **商品チャネル指数(CCI):** 平均価格からの偏差を分析することで、CCIは買われすぎと売られすぎの状態を評価します。Binary Smart SystemのCCI統合は、ポテンシャルな反転ポイントを特定する包括的なアプローチを保証します。 3. **移動平均収束拡散法(MACD):** シンプルなクロスオーバーを超えるMACDコンポーネント。MACD
Revolutionize Your Trading with This Powerful Indicator-Based System Are you struggling to find accurate entry and exit points in trading? Do you want a proven, indicator-driven system that helps you maximize profits and minimize risks ? Introducing our Advanced Trading System —a powerful, easy-to-use technical analysis tool designed for forex, stocks, and crypto traders . Key Features & Benefits: Precision Buy & Sell Signals – Our system generates crystal-clear buy (green) and sell (red
Moving Pivot Average    The pivot indicator compares the selected period with its counterpart from the previous period. The indicator uses very flexible algorithm for pivot value calculating. It allows you to allocate in days a certain time intervals (custom bars) and calculate the average pivot value based on High, Low and Close prices of these bars. How many custom bars will be taken into account is determined by the "Days" setting. The pivot line can be considered an average trend line and us
BSA indicator is a ZigZag based indicator. This indicator is used to find the reversal level of the price. You can use the existing risk ratio and calculation timeframe in the entries by optimizing them according to your usage preference.  In lower time frames, the indicator can repaint. For healthier results, you can detect the least repainting by observing for a while according to the graphic you will apply.
Bomb Bank Signal
Igor Pereira Calil
5 (1)
Bomb Bank シグナル: MetaTrader 4 の信頼度インジケーター Bomb Bank Signal は、金融市場で最も関連性の高いトレンドを特定するように設計された MetaTrader 4 の強力なインジケーターです。動きを正確に予測するツールをお探しなら、Bomb Bank が最適です。 仕組み: このインジケーターは、出来高分析、ローソク足終値、対称トレンドという 3 つの異なる方法を組み合わせて、売買の機会を検出してシグナルを送ります。 Bomb Bank は、買いの機会を特定するときは「爆弾」のようなものであり、売りシグナルを検出するときは「ドクロ」のようなものです。 ボムバンクはなぜ違うのですか? 完全な信頼性: Bomb Bank Signal は信号を削除しません。一度シグナルが発せられると、シグナルは残り続けるので、チャンスを逃すことはありません。 極めて高い精度: Bomb Bank は誤った信号を送信しません。リアルタイムで最新情報を更新し、市場の進化に合わせて調整しながら、以前のシグナルの透明性を維持します。 ライブアップデート: シ
Expert's signal link has been working on 25 different instruments since 09.07.2019. It will be stopped after a while. https://www.mql5.com/en/signals/605823 This expert advisor works well on daily charts. Opens a pending order based on daily price movements and may revise this pending order based on price movements during the day.  It can keep the current order by following the price movements and can open two different types of additional orders as soon as it sees the opportunity. If he sees t
Reversal Overlap Bot is an automated trading strategy. No technical indicators are used in the work. At the beginning of trading, the first order is placed in a certain direction (at your option). When you open a new candle, this order is closed if it is in profit. Otherwise, the next order opens in the opposite direction. Orders are closed when profit is reached. If there are unprofitable orders on the chart, the robot will close one of them. When closing loss-making orders, the profit covers t
The Tradonator nextGen! trades not primarily on indicators or prices, but at the beginning of every new candle (controlled by Timeframe). determines the trading direction due to the integrated indicator, which can measure trend and volatility. creates a Sell- and a Buypool and manages them isolated. calculates with every trade for each of the pools a previously defined profit target and closes the pool only with a total profit once this goal has been achieved. basically works with any currency
Dear Traders this is my another tool called " Swing Master Indicator ". As the name above the indicator is designed to help you in swing trading by capturing the low and highs of the price. You may us this tool with any trading strategy and style from scalping to position trading. It is made for level of traders including newbies and advanced traders even prop-firms, hedge funds and banks to help them make sold market analysis. I create tools for serious traders who want to make a difference in
RegLin Polinómico – 多項式回帰バンドとインテリジェント・フィルター RegLin Polinómico は、価格のローリングウィンドウに 多項式 ( 1 , 2 , 3 次のいずれか)を当てはめ、その 回帰残差の標準偏差 を基に 動的バンド を描画するプロ仕様インジケーターです。 RSI (タイムフレーム選択可)と**「トレンド時のみ」 オプションにより、質の低いブレイクアウトをフィルタリング。シグナル矢印の生成時に サウンドのオン/オフ**も選べます。 仕組み RegPeriod 本のバーに対して、 任意の次数 の多項式をフィット。 中心曲線 (回帰)と、 StdDevFactor 個分の標準偏差で離れた 上下 2 本のバンド を描画。 目安となるシグナル 買い: バーの 安値 が 下側バンドを下抜け し、RSI が 売られ過ぎ を確認したとき。 売り: バーの 高値 が 上側バンドを上抜け し、RSI が 買われ過ぎ を確認したとき。 OnlyInTrend = true の場合、 取引方向に傾き(導関数)があること が必須:傾き 正 で買い、 負 で売りのみ。
Price Action Scanner is an indicator that identifies price behaviors and provides alerts. This indicator can simultaneously detect signals for up to 6 different symbols across various timeframes. By setting a separator, you can add different symbol names and timeframes. The indicator can detect multiple common signal types such as Pinbar, Engulfing Pattern, Inside Bar, Morning Star, Evening Star, Fakey, and display corresponding information in separate subcharts, indicating the direction of th
A arca v1
Wellington Macedo Da Paixao
商品名 A arca 主な機能 重要ゾーンの自動検出 A arcaはサポートラインとレジスタンスラインを自動的に検出・表示し、エントリーやエグジットのポイントを把握しやすくします。 明確な売買シグナル 買い・売りのマーカーを表示し、ポジションを開始・終了する最適なタイミングをトレーダーが判断しやすくします。 マルチタイムフレーム分析 M5、M15、H1など複数の時間足データを統合して解析でき、より正確な相場分析を可能にします。 カスタマイズ可能で直感的なインターフェース 色やライン、レベルなどを自分の好みや戦略に合わせて設定することができ、自身のトレードスタイルに合った環境を整えます。 リスク管理ツール 反転が起こりやすいゾーンを特定することで、ストップロスやテイクプロフィットを簡単に設定でき、リスク管理を効率化します。 利点 迅速かつ正確な意思決定 重要ゾーンを自動的に検出するため、煩雑な手動分析に頼る必要が減り、よりスピーディーな意思決定が可能となります。 時間と労力の節約 明確なビジュアルシグナルにより、戦略やリスクコントロールに集中でき、複雑なチャート分析に時間を
This indicator is a certain algorithm and acts as a market scanner. All you need to do is fill in the selected currency pairs in the settings and that’s it. Next, the indicator itself will view all these currency pairs and time frames from M5 to D1 simultaneously. When a new signal appears, the indicator will give you an Alert and also draw the letter N where this new signal will be.
Robot Choppiness
Diego Mauricio Padilla Mendez
3 (2)
Choppines ロボットは MT4 インジケーター フォルダーにインジケーターとしてロードされます キャンドルのタイミングは 5 分を使用することをお勧めします。ロボットの推奨有効期限は 5 分です。 ロボットは、MT2、MX2、PRICEPRO プラットフォームに信号を送信するように構成できます。シグナルを送信するには、連携したいプラットフォームのコネクタ プログラムを使用する必要があります。 コネクタにインストールするには、次の手順を実行します (MT2 プラットフォーム コネクタの構成を説明する画像が添付されています)。  1.- MT4 プラットフォームに任意の通貨ペアをロードします 2.- M5 のタイミングでキャンドルを置きます。 3.- Robot-Choppiness.ex4 ファイルをロードするか、画面上で開いている通貨ペアにドラッグします。 4.- MT2 コネクタ (MX2、または PRICEPRO、一度に 1 つずつ) を画面にロードし、ファイル名、シグナル名、買いバッファ (0)、売りバッファ (1) を設定し、ロボットの有効期限 = 5
BinaryScalping is a professional indicator for trading binary options and scalping. The algorithm of the indicator is based on the calculation of pivot points for each time period separately, the location of the price of the trading instrument relative to the pivot points is analyzed and the probability of a trading operation is calculated. The indicator has a built-in filter of trading signals based on the global trend. The indicator is installed in the usual way and works with any trading inst
AMAN Signals
Niravkumar Maganbhai Patel
Introducing AMAN Signals. An MT4 Indicator that predicts the trend where the prices are heading! Indicator parameters Period 1 : the number of bars used for the indicator calculations. Proper values - Above 21. Multiplier 1 : Proper values - from: 5. Period 2 : the number of bars used for the indicator calculations. Proper values - Above 21. Multiplier 1 : Proper values - from: 5. Using the AMAN Signals FAST Indicator: Green: Buy or Bullish Candle Red: Sell or Bearish Candle Strength Percentag
Product Description Rtc ML Ai Predictor — Futuristic Intelligence for Real-Time Market Decisions Bring robotic precision to your trading.   Rtc ML Ai Predictor   fuses   Machine Learning   with   SMA-shift dynamics   to forecast short-term momentum and trend inflection points with clarity. The model evaluates multi-factor market structure, assigns a   confidence score   to each signal, and lets you act only when conditions align with your rules. Why traders choose Rtc ML Ai Predictor AI-guided e
This indicator identifies and displays zones, as it were areas of strength, where the price will unfold. The indicator can work on any chart, any instrument, at any timeframe. The indicator has two modes. The indicator is equipped with a control panel with buttons for convenience and split into two modes. Manual mode: To work with manual mode, you need to press the NEW button, a segment will appear. This segment is stretched over the movement and the LVL button is pressed. The level is displayed
このプロダクトを購入した人は以下も購入しています
FFx Engulfing Setup Alerter gives trade suggestions with Entry, Target 1, Target 2 and StopLoss. Below are the different options available: Entry suggestion - pips to be added over the break for the entry 3 different options to calculate the SL - by pips, by ATR multiplier or at the pattern High/Low 3 different options to calculate the 2 TPs - by pips, by ATR multiplier or at Risk/Reward Offset the dashboard - any place on the chart Remove the suggestion once the price reached the SL line Lines
FFx InsideBar Setup Alerter gives trade suggestions with Entry, Target 1, Target 2 and StopLoss. Below are the different options available: Entry suggestion - pips to be added over the break for the entry Minimum candle size - to avoid too close buy/sell entry suggestions 3 different options to calculate the SL - by pips, by ATR multiplier or at the pattern High/Low 3 different options to calculate the 2 TPs - by pips, by ATR multiplier or at Risk/Reward Offset the dashboard - any place on the c
FFx OutsideBar Setup Alerter gives trade suggestions with Entry, Target 1, Target 2 and StopLoss. Below are the different options available: Entry suggestion - pips to be added over the break for the entry. 3 different options to calculate the SL - by pips, by ATR multiplier or at the pattern High/Low. 3 different options to calculate the 2 TPs - by pips, by ATR multiplier or at Risk/Reward. Offset the dashboard - any place on the chart. Remove the suggestion once the price reached the SL line.
FFx PinBar Setup Alerter gives trade suggestions with Entry, Target 1, Target 2 and StopLoss. Below are the different options available: Entry suggestion - pips to be added over the break for the entry Minimum candle size - to avoid too small candles 3 different options to calculate the SL - by pips, by ATR multiplier or at the pattern High/Low 3 different options to calculate the 2 TPs - by pips, by ATR multiplier or at Risk/Reward Offset the dashboard - any place on the chart Remove the sugges
The purpose of this new version of the MT4 standard indicator provided in your platform is to display in a sub-window multiple timeframes of the same indicator with its divergences. See the example shown in the picture below. But the display isn't like a simple MTF indicator. This is the real display of the indicator on its timeframe. Here's the options available in the FFx divergences indicator: Select the timeframes to be displayed (M1 to Monthly) Define the width (number of bars) for each tim
The purpose of this new version of the MT4 standard indicator provided in your platform is to display in a sub-window multiple timeframes of the same indicator with its divergences. See the example shown in the picture below. But the display isn't like a simple MTF indicator. This is the real display of the indicator on its timeframe. Here's the options available in the FFx divergences indicator: Select the timeframes to be displayed (M1 to Monthly). Define the width (number of bars) for each ti
The FFx Dashboard MTF alerter will show you on a single chart all the timeframes (M1 to Monthly) with their own status for the indicator. 2 Alert Options: Single timeframe: each selected timeframe alert separately when a signal occurs Multi timeframes: all selected timeframes must agree for an alert to be triggered Both options have an input to select the timeframes to be used for the alert(s). How to Understand the Status: Green/Red square: histogram above/below 0 line Green square + Red bord
The FFx Dashboard MTF alerter will show you on a single chart all the timeframes (M1 to Monthly) with their own status for the indicator. 2 Alert Options: Single timeframe: each selected timeframe alert separately when a signal occurs Multi timeframes: all selected timeframes must agree for an alert to be triggered Both options have an input to select the timeframes to be used for the alert(s). How to understand the status: Green/Red square: RSI above/below 50 line Green square + Red border: R
The FFx Dashboard MTF alerter will show you on a single chart all the timeframes (M1 to Monthly) with their own status for the indicator. 2 Alert Options: Single timeframe: each selected timeframe alert separately when a signal occurs Multi timeframes: all selected timeframes must agree for an alert to be triggered Both options have an input to select the timeframes to be used for the alert(s). How to understand the status: Green/Red square: Stoch above/below 50 line Green square + Red border:
The FFx Dashboard MTF alerter will show you on a single chart all the timeframes (M1 to Monthly) with their own status for the indicator. 2 Alert Options: Single timeframe: each selected timeframe alert separately when a signal occurs Multi timeframes: all selected timeframes must agree for an alert to be triggered Both options have an input to select the timeframes to be used for the alert(s). How to understand the status: Green/Red square: Price above/below Cloud (Kumo) Green square + Red bo
The FFx Dashboard MTF alerter will show you on a single chart all the timeframes (M1 to Monthly) with their own status for the indicator. 2 Alert Options: Single timeframe: each selected timeframe alert separately when a signal occurs Multi timeframes: all selected timeframes must agree for an alert to be triggered Both options have an input to select the timeframes to be used for the alert(s). How to understand the status: Green/Red square: MA pointing Up/Down Green square + Red border: MA po
The FFx Dashboard MTF alerter will show you on a single chart all the timeframes (M1 to Monthly) with their own status for the indicator. 2 Alert Options: Single timeframe: each selected timeframe alert separately when a signal occurs. Multi timeframes: all selected timeframes must agree for an alert to be triggered. Both options have an input to select the timeframes to be used for the alert(s). How to understand the status: Green square: Price above PSAR Red square: Price below PSAR Options
The FFx Dashboard MTF alerter will show you on a single chart all the timeframes (M1 to Monthly) with their own status for the indicator. 2 Alert Options: Single timeframe: each selected timeframe alert separately when a signal occurs Multi timeframes: all selected timeframes must agree for an alert to be triggered Both options have an input to select the timeframes to be used for the alert(s). How to understand the status: Green/Red square: CCI above/below levels (ie. 100/-100) Grey square: C
The FFx Dashboard MTF alerter will show you on a single chart all the timeframes (M1 to Monthly) with their own status for the indicator. 2 Alert Options: Single timeframe: each selected timeframe alert separately when a signal occurs Multi timeframes: all selected timeframes must agree for an alert to be triggered Both options have an input to select the timeframes to be used for the alert(s). How to understand the status: Green/Red square: ADX above level Grey square: ADX below level Red bor
The FFx Dashboard MTF alerter will show you on a single chart all the timeframes (M1 to Monthly) with their own status. 2 Alert Options: Single timeframe: each selected timeframe alert separately when a signal occurs Multi timeframes: all selected timeframes must agree for an alert to be triggered Both options have an input to select the timeframes to be used for the alert(s). How to understand the status: Green/Red square: bullish/bearish candle Options available in the FFx Dashboard Alerter
The [GRAFF] III manual trading system is based on multiple MetaTrader (MT4) indicators. Together, the entire PACK of GRAFF III indicators makes an advanced trading tool. The system consists of over 20 different custom-built indicators which have been carefully selected and tested in the long term to produce strong and efficient trading signals. The particular indicators are based on different mathematical formulas, so the entire system is calibrated to remove false signals from its own indicator
FFx Universal Strength Meter PRO is more than a basic strength meter. Instead of limiting the calculation to price, it can be based on any of the 19 integrated strength modes + 9 timeframes. With the FFx USM, you are able to define any period for any combination of timeframes. For example, you can set the dashboard for the last 10 candles for M15-H1-H4… Full flexibility! Very easy to interpret... It gives a great idea about which currency is weak and which is strong, so you can find the best pai
Pan PrizMA CD Phase is an analogue of the МetaТrader 5 indicator , and is an option based on the Pan PrizMA indicator. Details . Averaging by a quadric-quartic polynomial increases the smoothness of lines, adds momentum and rhythm. Extrapolation by the sinusoid function near a constant allows adjusting the delay or lead of signals. The value of the phase - wave status parameter (which is close in meaning to the trigonometric phase or the angle of the radius-vector rotation in the trigonometric p
MetaTrader 5 version available here : https://www.mql5.com/en/market/product/24882 FFx Basket Scanner is a global tool scanning all pairs and all timeframes over up to five indicators among the 16 available. You will clearly see which currencies to avoid trading and which ones to focus on. Once a currency goes into an extreme zone (e.g. 20/80%), you can trade the whole basket with great confidence. Another way to use it is to look at two currencies (weak vs strong) to find the best single pairs
NostradamusMT4
Andrey Spiridonov
1 (1)
NostradamusMT4 is a powerful indicator from the set of professional trader. The indicator is based on Andrei Spiridonov's original price calculation method (ESTIMATED PRICE) for the current candle price. Advantages The indicator does not redraw. It works on any timeframes. Works with any trading instruments. Perfectly suitable for scalping and trading binary options. Parameters Color - color of the ESTIMATED PRICE FUTURE line. How to work with the indicator The indicator forms the ESTIMATED P
MetaTrader 5 version available here: https://www.mql5.com/en/market/product/25794 FFx Pivot SR Suite PRO is a complete suite for support and resistance levels. Support and Resistance are the most used levels in all kinds of trading. Can be used to find reversal trend, to set targets and stop, etc. The indicator is fully flexible directly from the chart 4 periods to choose for the calculation: 4Hours, Daily, Weekly and Monthly 4 formulas to choose for the calculation: Classic, Camarilla, Fibonac
This is the complete REX package. It consists of the lite, pro and ULTRA version.  Perfect for beginners and intermediates. REX complete is 100% non repaint. The strategy is based on a mix of different strategies, statistics, including pivot points, oscillators and patterns.  As the trading idea consists of a variety of some classic indicators like Momentum, Williams Percent Range, CCI, Force Index, WPR, DeMarker, CCI, RSI and Stochastic, it is clear that the fundamental indicators have being u
The arrows are calculated with: -     2 Parabolic  parameters -     2 ADX parameters -     4 Stochastic parameters We recommend to combine it with Parabolic, ZigZag or Elliot waves indicator. Always trade the trend! If you make sure to draw your trend lines and support/resistance zones you will just have to wait for the signal to appear. Take the trade. For Binary Options it is advisable to set the expiry time to 5-15 min in M1 chart. THIS INDICATOR IS ZERO REPAINT Best assets to trade: - EUR
Let´s try to make some real money! Call me profit addicted. I thought why not try to make THE dream come reality. With discipline, a clear strategy and this indicator I focus on entering the perfect trades. This indicator is very easy to use as you will get perfect entry points for Put or Call trades. The arrows are calculated with: -     Momentum  parameters -     Candle stick patterns -     Fundamental Price action We recommend to combine it with Parabolic, ZigZag or Elliot waves indicator
Pisces TheProfitZone "Pisces TheProfitZone MT4 Indicator Powered byFxGangster" This indicator will calculate new support and resistant zone everyday, and that give us a trading zone such as thats telling us TP and SL, So it still telling us for where should the price will go reach? Fore Example. Uptrend : If Price can stay upper a Line and price close higher above a Line, then the price will continue go up to reach next Line. Downtrend : If Price can't pass to stay upper a Line and the price
Golden Chip provides Basic Market Structure, Fibonacci, supply and Demand Zones. Letting you identify when a sell off point is approaching or whne a buy opportunity is arriving. The awesome thing about Golden Chip is that, you will see rejection levels or continuation before ANYBODY ! This indicator moves directly with price and lines up perfectly with the Chart. Some indicators would lag but NOT this one ! Golden Chip is amazing for Clean chart (Naked Chart). GOLDEN CHIP IS ONLY ON METATRADER (
A scalping indicator based on mathematical patterns, which on average gives signals with relatively small SL, and also occasionally helps to catch big moves in the markets (more information in the video) This indicator has three main types of notifications: The first type warns of a possible/upcoming signal on the next bar The second type indicates the presence of a ready signal to enter the market/open a position The third type is for SL and TP levels - you will be notified every time price re
作者のその他のプロダクト
The indicator calculates the saturation levels of the price chart. A signal to exit the resale area is a buy signal. A signal to exit the overbought area is a sell signal. Usually, you need to set relative values ​​for the overbought and oversold levels of Bottom and Top - for this indicator. Most often, a good trend is visible on the price chart visually. But an experienced trader must clearly understand the current balance of power in the market before entering. And the indicator will help t
This indicator can track the steady price movement in a certain direction. In this case, the movement itself can be downward, upward or lateral, when the market movement does not have a pronounced focus. The indicator works on the basis of two moving average as well as an oscillator. Using the signal search algorithm, the indicator generates signals in the form of arrows. Benefits. Allows you to determine the current trend. You can quickly enough understand which particular trend is currently
Dolphin Bands indicator works equally well on any timeframes. For medium-duration trends, it is recommended to use the standard setting. To study long-term trends, it is recommended to use an indicator value greater than the standard. To analyze short-term trends, it is better to use a lower indicator value. Most often, an exponential method is used to calculate the indicator, but other varieties can also be used. Dolphin Bands is a collection of lines. The two center lines of the indicator ar
Martingals indicator works on all currency pairs and on all timeframes. The arrows indicate the optimal entry points for future Martingale averaging, even with a zero exponent. The indicator shows a signal to close the series only if all previous signals can be closed in profit. After closing a series in profit, you need to immediately open an order in the direction of the signal. Thus, the close signal is at the same time the reverse opening point to the other side of the new order. The probabi
Levels Market is one of the simplest, but no less effective tools from this. Pivot points can be built from these levels, levels are constructed as statistical significance at a given point in time. Trading by levels is a classic in the work of a trader. You can use them as a ready-made trading strategy or as an additional filter in your trading system. In the settings you can specify the offset for building levels. Interpretation of levels: Lines 8/8 and 0/8 (Final Resistance). These lines ar
Trend New Trend Indicator, shows the signals for entry. Displays both entry points and the trend itself. Shows statistically calculated moments for entering the market with arrows. When using the indicator, it is possible to optimally distribute the risk factor. Settings: Uses all one parameter for settings. Selecting a parameter, it is necessary to visually resemble it so that the appropriate graph has a projection of extremes. Options: Length - the number of bars for calculating the indica
Condors TMA  ( Triangular Moving Average ) is a channel indicator without redrawing, built on the basis of moving averages. The key difference between the Condor TMA indicator and other channel indicators (for example, from the same Bollinger indicator) is that Condor TMA takes into account not simple moving averages, but twice smoothed ones, which allows one to more clearly determine the market movement, and on the other hand makes the indicator less sensitive.
Cancer indicator is great for trend trading! An intelligent indicator algorithm with high probability shows the points of potential market reversal. If you are trading in a trend, then a trading strategy built on the basis of this indicator is perfect for you. The indicator filters out market noise, almost everything and all the necessary functions for working with a thread are built into one tool. It works on all currency pairs and on all timeframes, indicator setting - according to your desire
A very simple and convenient trend indicator based on price divergence. He showed himself well in scalping. Help in finding entry points for analysis. It can be used as a filter in trade. It has two parameters: Period and Level. The Level parameter helps to filter out excess signals. For example, for EURUSD, the Level parameter may be 0.0001. The indicator can work both for entry points and as a filter. The indicator reflects information in a visual form. We must not forget that the approach to
Calculated trend indicator, can be used with an optimal risk to profit ratio, shows successful signals. Uses two options for settings. Shows favorable moments for entering the market with arrows. The probability of a successful trend is not very bad! The indicator can be used both for pipsing on small periods, and for long-term trading. The indicator does not redraw and does not lag. It works on all currency pairs and on all timeframes.
XStrain
Vitalii Zakharuk
The XStrain expert system works on all types of accounts. It works both in 4 and 5-digit quotes. Spread and requotes are not critical, any broker is suitable. To optimize the expert system, one year is recommended for the period H1 or H4. Optimization can be carried out at opening prices, the results differ little from testing on real ticks, since the bot works at opening prices. It is enough to optimize once a month! To get better results, it is recommended to work on several different pairs.
An expert of a new type Formulas has been created - it works using sharp tick movements. The uniqueness of the expert is that it can be launched on any hour period, any currency pair, and on the server of any broker. What makes the expert attractive enough to use for trading. It is recommended to work on liquid forex pairs with a low spread. The lower the commission and spread, the greater the profit. You can start using it with $ 100 and a lot of 0.01. A small initial deposit also contributes
The Trend Distinctive indicator smoothes price fluctuations during signal formation by averaging the data. This gives the trader the opportunity to visually determine what trend will be present at a particular time interval. This is an auxiliary tool for technical analysis, which helps to determine the exact direction of the trend: either an upward or downward movement of the price of a trading instrument. Although the indicator is a little late, it still generates the most reliable signals th
Red Bot
Vitalii Zakharuk
The mechanism of work of the Red Bot Expert Advisor is designed so that before opening a transaction, they undergo instant implicit filtering, which, if there are competent and practical settings, allows the buyer to level the number of unprofitable and unproductive transactions. The adviser has a large number of internal regulators, software installations and special codes that help to safely and efficiently trade. This is a fully automated Expert Advisor, built on the scalping strategy, work
Introduced expert system   Stable Ex works with the EURUSD currency pair and only with it. This system implemented the principle of five orders - that is, a maximum of five orders can be placed in one direction, after which the total position of the series must be closed by stops, either real or virtual. The trading system is designed to work separately with a series of buy orders and separately with a series of sell orders. which makes the trading system versatile enough. The expert passes all
The presented expert system works with the GBPUSD currency pair and only with it. This system implemented the principle of seven orders - that is, a maximum of seven orders can be made in one direction, after which the total position of the series should be closed by stops, either real or virtual. The trading system is designed to work separately with a series of buy orders and separately with a series of sell orders. which makes the trading system versatile enough. The expert passes all types
Transition indicator can track a steady price movement in a certain direction. In this case, the movement itself can be downward, upward or sideways, when the market movement does not have a pronounced focus. The indicator works on the basis of two moving average as well as an oscillator. Using the signal search algorithm, the indicator generates signals in the form of arrows. Trading based on trend indicators is the simplest and often the most effective. If you correctly determine the beginni
Global Trend Indicator, shows the signals for entry. Displays both entry points and the trend itself. Shows statistically calculated moments for entering the market with arrows. When using the indicator, the risk factor can be optimally distributed. Settings: Uses all one parameter for settings. Choosing a parameter, it is necessary to visually resemble it so that the appropriate graph has a projection of extremes. Parameters: Length - the number of bars for calculating the indicator. Use
Trend DI is an auxiliary tool for technical analysis that helps determine the exact direction of a trend: either an upward or downward movement of the price of a trading instrument. Although the Trend DI indicator is a bit late, it still generates the most reliable signals that a trader can safely navigate. The Trend DI indicator smooths price fluctuations during signal formation by averaging data. This gives the trader the opportunity to visually determine which trend will be present in a par
The Trend ZVD Trend Indicator is important for identifying trends in financial markets. However, this indicator works equally well during consolidation periods. The Trend ZVD trend indicator indicates the direction in which the asset of your choice can move. The Trend ZVD trend indicator copes with the main task of trading: to find the entry point to the market at the time the trend is created and the exit point at the time it is completed. A trend in trade is the steady movement of quotes in
An indicator from the zigzag family with levels. First of all, I will point out arguments in favor of the advisability of using a level indicator. They give the trader the following benefits: Alternative points of view - the level indicator helps to look at the levels from the side, compare them with several automatic systems, identify errors; Saving time - reducing the cost of effort for self-building lines; Exact mathematical calculation - quick calculation of levels, ratios of indicators
The Progress Scalp strategy is based on tick trading principles. At its core, this strategy is fenders, that is, the trader receives signals for opening positions during pullbacks from the main movement. A distinctive feature of this strategy is that transactions are concluded only during periods of strong tick movements in the forex market. The Progress Scalp strategy was developed for trading with different currency pairs. You need to choose a currency pair with the lowest spreads and virtual
Long
Vitalii Zakharuk
The Long expert system works with the EURUSD currency pair and only with it. The trading system is designed to work separately with a series of buy orders and separately with a series of sell orders. which makes the trading system versatile enough. The expert passes all types of testing throughout the history for the specified currency pair. Also, the expert system is tested with various delay values, it works in fully automatic mode! No settings are needed, use only the default settings. Thi
The indicator is simple and clear, making the work of the trader as easy as possible and giving clear signals to enter the market. This indicator has two settings for the period. Which makes it more flexible. And at the same time, many false signals do not appear. The larger the period, the smoother the indicator itself will be. It can be used both independently and together with other indicators of technical analysis (including with oscillators), as well as with another same indicator (with
Индикатор отображает регнессионный канал с сопровождением каналов фактически создавая уровни поддержки и сопротивления. Уровни поддержки и сопротивления являются одним из важнейших элементов технического анализа. С этим утверждением согласится любой трейдер. Уровни в трейдинге используются непосредственно, открывая и закрывая ордера у границ диапазона, очерченного ими. Также уровни применяют баланс спроса и предложения в своих торговых стратегиях на различных временных интервалах. Визуальное
An expert of a new type Anniversary - works using sharp tick movements, the algorithm that was created earlier is significantly improved. The uniqueness of the expert is that it can be launched on any hour period, any currency pair, and on the server of any broker. What makes the expert attractive enough to use for trading. It is recommended to work on liquid forex pairs with a low spread. The lower the commission and spread, the greater the profit. You can start using it with $ 100 and a lot o
The Trends Signal indicator displays the direction of the trend with arrows, works in a simple and clear way. It uses a combination of reliable and simple indicators to analyze prices. The signals of the Trends Signal indicator can be interpreted as follows: buy when the bars are colored blue, and sell when they are red. An effective indicator with a wide range of three parameters for trading. Parameters: Length - The number of bars to calculate. LevelUP, LevelDN - Levels for determining overb
The Open Trend indicator calculates the saturation levels of the price chart. Most often, a good trend is visible on a price chart visually. But an experienced trader should clearly understand the current balance of power in the market before entering. A signal to exit the oversold area is a buy signal. A signal to exit the overbought area is a sell signal. Usually, you need to set the relative values ​​for the overbought and oversold levels Bottom and Top for this indicator. The Open Trend i
Sharp
Vitalii Zakharuk
Sharp expert system works with a deposit of $ 100! The classic method of scalping. It is also worth noting that with the allowable level of the spread, the bot goes through any historical period on any currency pair. The key for the Sharp bot is the spread, it works with default settings, it is possible to work with a spread of up to 10. If the spread is more than 10, then you need to select other settings. Testing should be performed with a spread of up to 10 on all ticks. There is no point i
Are you tired of the constant ups and downs? It is not worth becoming a victim of unstable market movements, it is time to somehow get rid of it! Already now, you can use Business Trend solutions to balance the analysis of price movements and get a clearer picture of price behavior. Business Trend is a trend indicator for the MetaTrader 4 trading platform. This indicator allows you to find the most likely trend reversal points. You will no longer find a copyright indicator like this. A simple
フィルタ:
レビューなし
レビューに返信