Momentum Wave Analyzer
- インディケータ
- バージョン: 1.0
- アクティベーション: 5

• Please test the product in the Strategy Tester before purchasing to understand how it works.
• If you face any issues, contact me via private message—I’m always available to help.
• After purchase, send me a screenshot of your order to receive a FREE EA as a gift.
Momentum Wave Analyzer • If you face any issues, contact me via private message—I’m always available to help.
• After purchase, send me a screenshot of your order to receive a FREE EA as a gift.
Unlock the True Force of the Market with Momentum Wave Analyzer
Are you looking for an indicator that goes beyond simple buy and sell signals? Do you want to not only identify the trend but also measure its underlying strength and conviction? The Momentum Wave Analyzer is a sophisticated yet intuitive tool designed to give you a clear, visual representation of market momentum, helping you catch powerful moves and avoid weak signals.
For just $30, you can equip your trading arsenal with a professional-grade analytical tool that transforms how you see market waves.
The Logic Behind the Momentum Wave Analyzer
This is not just another oscillator. The Momentum Wave Analyzer employs a unique multi-step logic to dissect and quantify price movements with exceptional clarity.
-
Dynamic Boundary Detection: At its core, the indicator first establishes a dynamic price channel. It constantly scans the market over a user-defined Wave Analysis Period to identify the absolute highest high and lowest low. These boundaries represent the immediate zone of price action.
-
Precise Trend Reversal Signals: A trend reversal is only confirmed when a decisive breakout occurs.
-
A new uptrend is signaled when the price breaks and closes above the highest high of the channel.
-
A new downtrend is signaled when the price breaks and closes below the lowest low of the channel. This method filters out market noise and focuses on significant, momentum-driven shifts in direction.
-
-
Anchoring the Wave's Origin: This is where the Momentum Wave Analyzer truly sets itself apart. Upon detecting a new trend, it looks back at the entire previous trend to find its absolute origin point.
-
For a new uptrend, it identifies the single lowest price point reached during the prior downtrend. This becomes the "Major Lower" anchor.
-
For a new downtrend, it identifies the single highest price point of the prior uptrend, creating the "Major Upper" anchor.
-
-
Quantifying the Wave's Magnitude: The indicator then calculates the true size of the current market wave in real-time. It measures the distance in points from the most recent price extreme (the dynamic boundary) to the established origin anchor. This value is plotted as the histogram.
-
In an uptrend, it measures from the current high of the channel down to the wave's starting low point. A rising histogram shows the uptrend is expanding with force.
-
In a downtrend, it measures from the wave's starting high point down to the current low of the channel. A falling histogram (more negative) shows the downtrend is accelerating.
-
How to Interpret and Trade
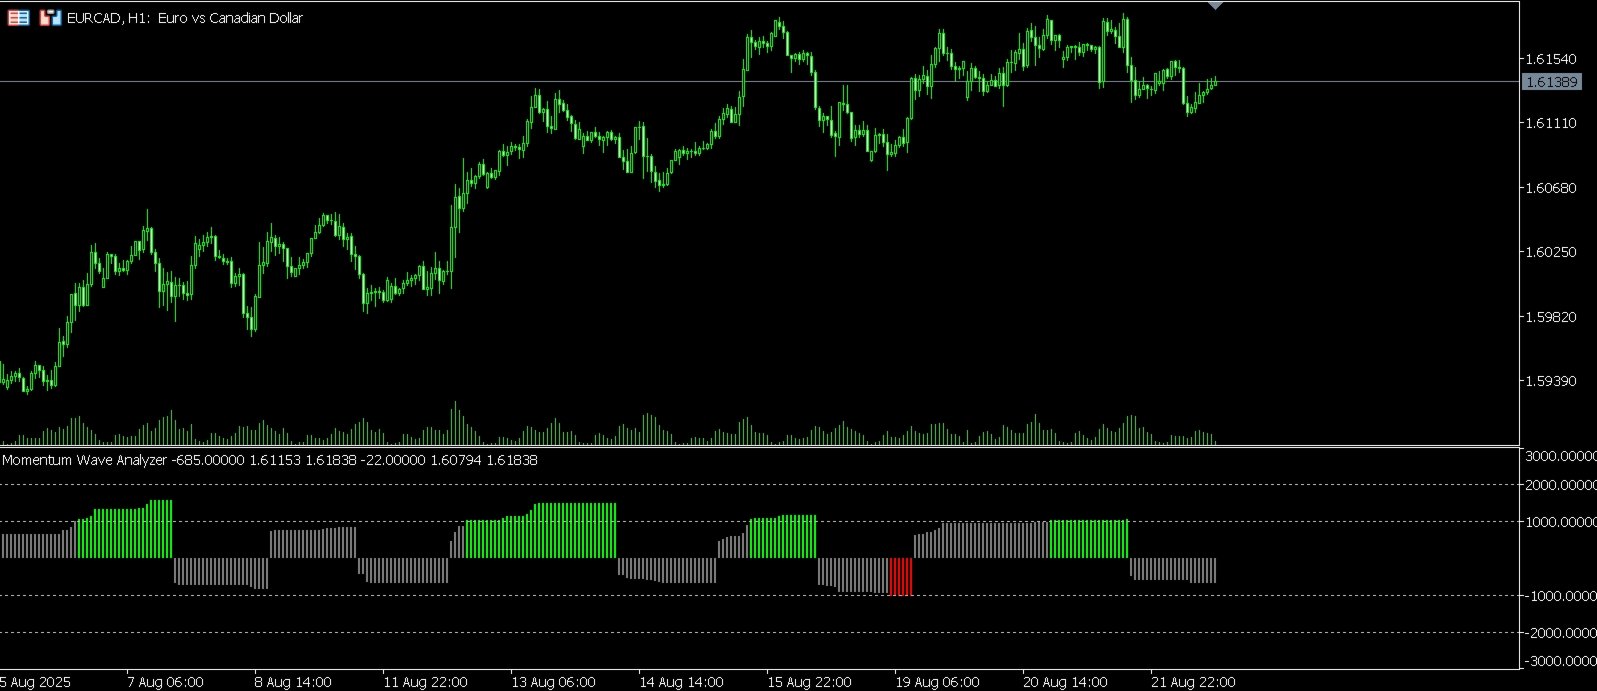
The Momentum Wave Analyzer presents this complex analysis in a simple, color-coded histogram in a separate window, making it easy to understand the market at a glance.
-
Histogram Value: A positive histogram indicates bullish momentum (an upward wave), while a negative histogram indicates bearish momentum (a downward wave). The zero line represents the crossover point between trends.
-
Color-Coded Strength: The histogram bars change color to reflect the intensity of the momentum, giving you an immediate edge.
-
Gray: A neutral or very weak trend is forming.
-
Lime (Uptrend) / Red (Downtrend): The trend is confirmed and has moderate momentum. This can be an ideal entry point.
-
Blue (Uptrend) / Magenta (Downtrend): The trend is very strong. This is confirmation to hold your position and let profits run.
-
White: The trend has reached extreme momentum, signaling a potential climax. This could be a warning to tighten stops or consider taking profits.
-
Trading Strategies:
-
Trend Entry: Enter a long position when the histogram crosses above zero and turns from gray to lime. Enter a short position when it crosses below zero and turns from gray to red.
-
Trend Riding: Remain in your trade as long as the color stays strong (Lime/Blue for long, Red/Magenta for short). The increasing height or depth of the bars confirms the trend is still powerful.
-
Exit Signal: Consider exiting your position when the histogram bars begin to shrink towards the zero line or when the color reverts to gray, as this indicates fading momentum.
Features:
-
Advanced momentum and wave analysis logic.
-
Clear visual display with a color-coded histogram.
-
Effectively filters market noise to identify true trend reversals.
-
Helps you distinguish between weak and powerful market moves.
-
Fully customizable Wave Analysis Period to suit any timeframe or asset.
Invest in the Momentum Wave Analyzer today and start trading with a deeper understanding of the market's underlying power.