Minibull gold vs indices shift ratio edge
- インディケータ
-
Yusuf Levent Aksun
 プラットフォームエンジニア & AWS認定プロフェッショナル。ソフトウェア開発、クラウドアーキテクチャ、
DevOpsトランスフォーメーションにおいて20年以上の経験を持つ。
現在、ロンドンのWorld Wide Technologyにてプラットフォームエンジニアリングを推進。
スケーラブルなインフラソリューションを構築し、開発チームがより迅速かつ確実に
デリバリーできる環境を実現。
🔹 AWS Certified Solutions Architect – Professional - バージョン: 19.0
- アップデート済み: 20 2月 2026
- アクティベーション: 5
BullBOP13 — バランス・オブ・パワーズ | ゴールド vs 米国指数
BullBOP13は、ゴールド(XAUUSD)と3つの米国株価指数(NAS100、US500、US30)間の一時的な乖離を検出します。4資産中3つが同方向に動き1つが逆方向に動く場合、その異常値は反転する傾向のある「フェイクムーブ」です。
動作原理 — 4層シグナルフィルター:
1. フェーズフィルター — D1時間軸の市場レジーム分析(整列/乖離/強い乖離)
2. フェイクムーブ検出 — 3対1ルール:3資産が一致、1つが乖離 = シグナル発生
3. レシオ反転 — ゴールド/指数レシオのEMA+標準偏差バンドで乖離の転換を確認
4. 価格確認 — フェイクムーバーのMA乖離度が減少中であること
4層すべてが同時に一致した場合のみシグナルを生成。
機能:
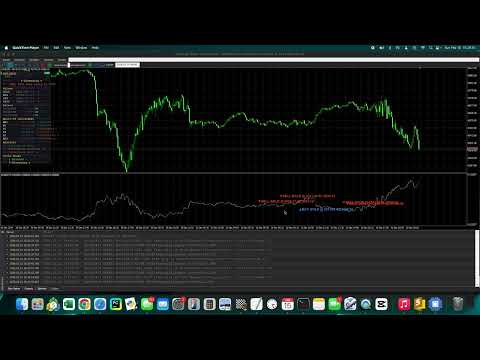
• サブウィンドウのレシオチャート(EMA、±1/±2 SDボリンジャーバンド付き、色分け表示)
• 全4条件トリガー時にBUY/SELL矢印表示
• インタラクティブパネル:価格、MA乖離、レシオSD水準、6タイムフレームフェーズ分析(MN1→M30)
• レシオ切替:ゴールド/NDX、ゴールド/SPX、ゴールド/US30ビュー
• 自動マーケットコメンタリー(マクロ/中期/短期)
• 折りたたみパネル — フルダッシュボードまたはコンパクトモード
• 7段階ブローカー対応シンボル検出 — あらゆる命名規則に対応
• グレースフルデグラデーション — シンボル欠落時もクラッシュしません
• プッシュ + メール通知
• リペイントなし — 全4条件は確定済みバーのみで評価(shift=1)
シグナル品質(コンパニオンEAバックテストで検証済み):
• フォワードテスト(2025年9月→2026年2月):M5で勝率61.5%、H1で56.3%
• BUYシグナルがSELLを上回る(67% vs 55%勝率)
• 急激な変動時に最も効果的
要件:
• ブローカーがXAUUSD + NAS100 + US500 + US30を提供しているこ