Buy and Sell Volume Spikes Indicator

5

Hello Guys,

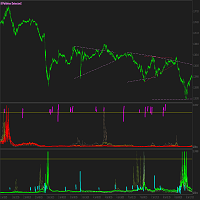
WinningSpell Indicator (No Repaint) shows Buyers and Sellers activity on any given chart and timeframe of any quote that is available in MT4 platform. It calculates those values by a sophisticated formulae that I have discovered a long time ago and improved over the years. It uses OHLCV values of every M1 bar to make the calculation for any timeframe by a formulae and represents those values via oscillator creating waves of spikes. It can be easily used as a system by its own, or become a great addition to the system and trading style of your own choice. If using as a system on it's own (without any other indicator/analysis or addition), the simplest and most accurate way is to enter any Divergence/Convergence Spikes formations with 2-3 Higher timeframe confirmations with same method (Divergence/Convergence Spikes), those signals will guarantee you approximately not just every 9 out of 10 wins, but also a Fast Market Reaction, meaning the price will go maximum possible number of pips over a minimum possible amount of time spent (or in simple words - there will be a Volatility Corridor Break Out). The cleaner and more eye-catching 2-3 spikes divergence/convergence occurrence on the chart (meaning the easier it was spotted by you) with 2-3 higher timeframe confirmation - The more aggressive Volatility Corridor Break Out will follow. All what you will need is a simple 3-5 days of observation/analysis experience and you will discover so many hidden/profitable opportunities that you didn't take into account before, and the most amazing thing is - Those hidden/profitable opportunities are completely logical! They follow precise Buyers/Sellers Divergence/Convergence algoes and they are the same for all of the charts and timeframes. All you will need is a simple experience, as in order to extract the most potential of the system on its own - is to understand the pips/time spent values for volatility break out corridors according to timeframe correlations so you can extract up to 95% of all trend movement correctly (and that would be the skill to aim for).


My WinningSpell indicator never repaints and never will be, as soon as the bar of your timeframe has formed, the OHLCV values will never change, as the formulae is applied - there only can be one strict outcome value. After the bar close of your timeframe, all those values you see in realtime, you will see on history. Those Magenta and Aqua highlighted values are from RSI indicator which I obviously will send for free, it works well with my Triangle Scanner to determine a pre-breakout volatility corridor. I understand that some people may not have a big experience in volatility break out determinations, I made it simpler for them - I decided to gift for free my Triangle Scanner as the addition to WinningSpell, it will find all those volatility pre-break out patterns for you, so it will be much easier for you and more interesting to be at the right time, at the right place, and decide very wisely "AT THE RIGHT RISK". Firstly increase the probability based on your experience to be at the right time, at the right place with lower risk, and only after a decent amount of experience, increase the lower risk to the right amount of risk that suits your confidence based on experience (Did you get your last winning streak trades 9 out of 10? And most importantly - did all of your winning streak trades went the way you expected?), even if they did remember - Market Can Easily Correct your winning streak if you are impatient - Trust me those patterns are everywhere/they are all over the place, they are all logical, they are just hidden on the charts and they will appear and repeat themselves again and again, hence there is no reason for being impatient at all, and don't forget again - Money Management is a psychological state where you are able to accept any amount based on the financial ceiling you have, which world and societies influenced you to have. You are the only one to change it/correct it based on what you really want and desire.

The key is to get into the market right before the volatility corridor breaks out (wasting less time, gaining more profit and amazing feeling of being right) - being at the right time, at the right place. And extract the most of the corridor's breakouts (80% is the perfect result), with experience it will rise up to 95%, Why? Because your Close Position signal will become the Open Position of the opposite signal. Why? Because the same market logic and the same Divergence/Convergence algoes will occur there!! But that type of trading is the skill to aim for - It will take a lot and a lot of experience, it will take years, but this is where the real market understanding comes from. And also remember the first 5% of the start of a new trend and the last 5% of the end of the trend - Are the most expensive. Hence, simply stick to 80% and most importantly aim to enter at the right time and at the right place, as you don't want to get stuck in EWA formation patterns like Diagonal Triangles, which get extended and extended. It simply not just worth of your time - trust me.

We all decide how to spend our time - The wiser we spend it in our life, the more easier/enjoyable and profitable our trading will be. There is something amazing/fascinating about the feeling of getting it right at the right moment and at the right time, and this exact vibe of energy feeds us and drives us extremely fast to our financial goals that we never aimed before. And also remember, the money management isn't just about maths and derivative numbers of your capital. Money management is your psychological state that allows you to gain/accept any amount that is beyond your financial ceiling. Money management is about being right, at the right time, at the right place with the right amount of risk!! Money management is your psychological state that accepts any amounts beyond your financial ceiling, which got limited due to the world's influence on you and you are the only one to remove those limitations (not by increasing risk like others do and lose, but by increasing the probability that you will be at the right time, at the right place with the right risk as more often as possible. This are just some simple bits of my 17 years of Programming/Trading experience in Forex Market.

I offer lifetime license for my WinningSpell with my Triangle Scanner and my mod of free RSI indicator for $50 only. All my templates and settings will be sent to you with brief/simple explanation on how to use them at fullest. Contact me via MQL5 Chat.

-------------------------------------------------------------------------------------------------------------------------------------------

Здравствуйте,

Индикатор WinningSpell (без перерисовки) показывает активность покупателей и продавцов на любом графике и таймфрейме любой котировки, доступной в платформе MT4. Он рассчитывает эти значения по сложной и уникальной формуле, которую я разработал давно и совершенствовал с годами. Он использует значения OHLCV (Цена: Открытия/Максимальная/Минимальная/Закрытия и Обьём) каждого бара M1 для расчёта по формуле на любом таймфрейме и представляет эти значения ввиде осциллятора, создавая волны спайков. Его можно легко использовать как самостоятельную систему, или же он может стать отличным дополнением к любой системе и стилю торговли по вашему выбору. При использовании в качестве самостоятельной системы (без каких-либо других индикаторов/анализа или дополнений), самый простой и точный способ - входить в любые формации Дивергенций/Конвергенций спайков с двумя-тремя подтверждениями на более высоких таймфреймах относительно вашего текущего таймфрейма, с помощью того же метода (Дивергенций/Конвергенций спайков), эти сигналы гарантируют вам не просто вероятность 9 из 10-ти прибыльных трейдов, но и быструю реакцию рынка, то есть, цена пройдет максимально возможное количество пунктов за минимально возможное количество времени (или простыми словами - произойдет Разрыв Коридора Волатильности). Чем заметнее 2-3 дивергенции/конвергенции на графике (то есть, чем легче вы их заметили) с двумя-тремя подтверждениями на более высоких таймфреймах - тем агрессивнее последует Разрыв Коридора Волатильности. 

Всё, что вам нужно, - это 3-5 дней наблюдений/анализа, и вы обнаружите столько скрытых/прибыльных возможностей, которые раньше не принимали во внимание, и что самое удивительное - эти скрытые/прибыльные возможности полностью логичны! Они следуют точным алгоритмам дивергенций/конвергенций покупателей/продавцов, и они одинаковы для всех графиков и таймфреймов. Всё, что вам потребуется, - это простой опыт, так как для извлечения наибольшего потенциала из системы, нужно понимание пропорций количества пройденных пунктов относительно пройденного времени для точного определения Разрыва Коридоров Волатильности в соответствии с корреляциями таймфреймов, чтобы вы могли правильно извлекать до 95% всех трендовых движений (и это было бы мастерством, к которому нужно стремиться).

Мой индикатор WinningSpell никогда не перерисовывается и никогда не будет перерисовываться, как только сформировался бар вашего таймфрейма, значения OHLCV никогда не изменятся, их и использует формула, соответственно конкретное итоговое значение может быть только одним. После закрытия бара вашего таймфрейма все те значения, которые вы видите в реальном времени, вы увидите и на истории. Те значения, которые выделены пурпурным и голубым цветом, относятся к индикатору RSI, который я, вышлю бесплатно, он хорошо работает с моим Сканнером Треугольников для определения Разрыва Коридоров Волатильности.

Я понимаю, что у некоторых людей может не быть большого опыта в определении Разрыва Коридоров Волатильности, поэтому я решил подарить бесплатно свой Сканер Треугольников в качестве дополнения к WinningSpell, он найдет для вас абсолютно все эти паттерны (предшествующие Разрыву Коридоров Волатильности), любой фрактальности (не упуская ни одного) исходя из глубины сканирования которая будет задана и отобразит их на вашем графике, соответственно вам будет намного проще, интереснее и увликательнее оказаться в нужное время, в нужном месте и принять правильное решение «С ПРАВИЛЬНЫМ РИСКОМ». Сначала увеличьте вероятность, основанную на вашем опыте, чтобы оказаться в нужное время в нужном месте с меньшим риском, и только после приличного количества опыта, увеличьте меньший риск до правильного количества риска, которое соответствует вашей уверенности, основанной на вашем опыте (Получили ли вы в своей последней прибыльной серии 9 из 10-ти трейдов? И самое главное - все ли ваши сделки из прибыльной серии прошли так, как вы ожидали?), даже если это случилось именно так, никогда не забывайте - Рынок может легко скорректировать вашу серию прибыльных трейдов, если вы нетерпеливы - Поверьте мне, эти паттерны повсюду/они повсюду, они все логичны, они просто скрыты на графиках, и они будут появляться и повторяться снова и снова, следовательно, нет причин для нетерпеливости, и не забывайте никогда - Управление капиталом - это психологическое состояние, когда вы способны принять любую сумму, исходя из вашего финансового потолка, который мир и общество установили вам. Только вы можете изменить/исправить этот финансовый потолок, исходя из того, чего вы действительно хотите и к чему стремитесь.

Главное - входить в рынок прямо перед Разрывами Коридоров Волатильности (тратить меньше времени, получать больше прибыли и потрясающее чувство понимания механики рынка) - быть в нужное время в нужном месте. И извлекать максимум потенциального движения из Разрыва Коридоров Волатильности (80% - идеальный результат), с опытом этот показатель вырастет до 95%, почему? Потому что, сигнал закрытия вашей позиции становится сигналом открытия противоположной позиции. Почему? Потому что, там будет действовать та же самая логика рынка и те же алгоритмы Дивергенций/Конвергенций!!! Но, именно к такому типу торговли нужно стремиться - это потребует много и много опыта, это займёт годы, но именно здесь и приходит настоящее понимание механики рынка. И также помните что, первые 5% начала нового тренда и последние 5% конца текущего тренда - самые дорогие. Поэтому просто придерживайтесь правилу 80% и, самое главное, старайтесь входить в рынок в нужное время и в нужном месте, так как вы не хотите застрять в таких паттернах как диагональные треугольники (Это просто не стоит вашего времени - поверьте мне), которые расширяются и расширяются постоянно, а разворота так и не будет (Он будет когда эти паттерны все сломаются, соответственно расширяться тенденция уже не сможет, так и начинается её излом).

Мы все решаем, как проводить своё время - чем разумнее мы проводим его в жизни, тем легче/приятнее и прибыльнее будет наша торговля. Есть что-то удивительное/захватывающее в том чувстве, когда всё получается в нужный момент и в нужное время, и именно эта энергетическая вибрация питает нас и заставляет двигаться к нашим финансовым целям так быстро, как нам этого никогда ранее не удавалось. И помните, что, управление капиталом - это не только математика и производные нашего риска. Управление капиталом - это наше психологическое состояние, которое позволяет нам принимать любую сумму, которая находится за пределами нашего финансового потолка. Управление капиталом - это умение быть в нужное время, в нужном месте и с правильно подобранным "НУЖНЫМ" риском!!! Управление капиталом - это наше психологическое состояние, позволяющее принимать любые суммы, превышающие наш финансовый потолок, который попал в ограничения из-за влияния на нас окружающего нами мира, и только мы можем снять эти ограничения (не увеличивая риск, как это делают многие и теряют, а увеличивая вероятность того, что мы окажемся в нужное время, в нужном месте с "НУЖНЫМ" риском как можно чаще. Это некоторые фрагменты моего 17-летнего опыта программирования и торговли на рынке Forex.

Я предлагаю пожизненную лицензию на мой WinningSpell с моим Сканером Треугольников и моим модом бесплатного индикатора RSI всего за $50. Все мои шаблоны и настройки будут отправлены вам с кратким/простым объяснением, как использовать их в полной мере. Связаться со мной можно по MQL5 чату.


レビュー 4
Stanislav Melnikov
898
Stanislav Melnikov 2026.01.24 02:06 
 

Работает хорошо!))

Jade Lee Valentine
202
Jade Lee Valentine 2025.10.01 11:10 
 

Great indicator

Francis Santos
252
Francis Santos 2025.09.11 15:37 
 

Bom dindicador e suporte!

おすすめのプロダクト
(Currently 30% OFF) Before reading the description of this indicator, I just want to introduce to you following concept Moving Average Line - Typical moving average which is based on one chart alone.  Currency Strength Line - The moving average of a certain pair in which the strength is based on 28 pairs. Can be said as the real moving average line. Moving Average indeed is one of the most popular indicator which almost every trader use. Currency Strength Meter is also a trend indicator which

We present you the indicator "Candle closing counter", which will become your indispensable assistant in the world of trading. That’s why knowing when the candle will close can help: If you like to trade using candle patterns, you will know when the candle will be closed. This indicator will allow you to check if a known pattern has formed and if there is a possibility of trading. The indicator will help you to prepare for market opening and market closure. You can set a timer to create a pre
EZZ Elite Zig Zag is an indicator for the MetaTrader 4 terminal. This indicator traces the peak of the trend based on the market reversal, thus showing various opportunities in the financial market. EZZ Elite Zig Zag is a visual tool, intuitive, and easy to understand and use.  Test it Yourself by Downloading it for Free. Author Paulo Rocha all rights reserved
Forex Gump
Andrey Kozak
2.4 (5)
Forex Gump is a fully finished semi-automatic trading system. In the form of arrows, signals are displayed on the screen for opening and closing deals. All you need is to follow the instructions of the indicator. When the indicator shows a blue arrow, you need to open a buy order. When the indicator shows a red arrow, you need to open a sell order. Close orders when the indicator draws a yellow cross. In order to get the most effective result, we recommend using the timeframes H1, H4, D1. There
Money Flow Profile MT5 HERE   Here   our more valuable tools SMC Trend Trading   ,  Easy SMC Trading  ,  Institutional SMC Architect Volume Analysis Tools  ,  Volume flow Profile  ,  Market volume profile  , FVG with Volume  , Liquidity Heatmap Profile  ,  Volume Spread Analysis This Master Edition is engineered for clarity and speed, featuring a unique Auto-Theme Sync system that instantly beautifies your chart layout upon loading. Key Features: True Money Flow Calculation: Goes beyond stand
フィボナッチリトレースと拡張ラインツール DiNapoliポイント取引方法とゴールデンセクション取引を使用するトレーダーにとって理想的なMT4プラットフォームのフィボナッチリトレースと拡張ラインツール 主な特長: あなたはフィボナッチリトレースメントの複数のセットを直接描くことができ、重要なリターンポイント間の関係は一目瞭然です。 2.フィボナッチ拡張を描画することができます。 3.フィボナッチフォールドバックとラインの延長は、簡単な観察と数値表示のために左右に動かすことができます。 4.チャートは非常に爽やかな 5.数字キーでサイクルを切り替えることができます。 ファンクションキー: 1。 [戻るを押す、要求に応じて描画する、最大8つのグループにする 2。拡張]を描くには[押す] 3。 \を押すと、現在のサイクルの下にあるすべての拡張機能と折り畳みが削除されます 4。フォールドバックを移動して削除して展開する (1)最初のフォールドバックセットのF5行をクリックします。 一度クリックすると(黄色に変わります)、キーボードのDeleteキーを押すと、フォーカ
Basic Support and Resistance インジケータは、テクニカル分析を強化するために必要なソリューションです。このインジケータを使用すると、チャートにサポートレベルとレジスタンスレベルを投影できます/ mt5バージョン 機能 フィボナッチレベルの統合: サポートと抵抗レベルとともにフィボナッチレベルを表示するオプションを使用すると、私たちの指標は市場行動と逆転領域の可能性についてさらに深い洞察を提供します。 パフォーマンスの最適化: 各バーの開口部のみで拡張ラインを更新するオプションを使用すると、インジケータは、サポートレベルと抵抗レベルの精度を犠牲にすることなく最適なパフォーマンスを保証します。 入力 メイン設定 Timeframe:  この入力を通じて、より高い時間枠のサポートラインとレジスタンスラインをチャート上に表示することを選択できます。 Support/Resistance Strength [Number of Bars]:  この入力を使用して、サポートと抵抗の強度を決定できます。数が高いほど、サポート/抵抗がより強くなります。 Price m
## Smart Reversal Oscillator Pro Smart Reversal Oscillator Pro is an advanced hybrid trading utility designed for MetaTrader 4 that reinvents volatility and momentum analysis. Instead of analyzing raw price action, this indicator applies mathematical Bollinger Bands directly onto the Relative Strength Index (RSI) array data within a separate sub-window. Standard fixed oversold and overbought levels (like 30 and 70) often fail during strong market expansions. This professional oscillator solve
Noize Absorption Index - is the manual trading system that measures the difference of pressure between bears forces and bulls forces. Green line - is a noize free index that showing curent situation. Zero value of index shows totally choppy/flat market.Values above zero level shows how powerfull bullish wave is and values below zero measures bearish forces.Up arrow appears on bearish market when it's ready to reverse, dn arrow appears on weak bullish market, as a result of reverse expectation. S
Volume Profile Sniper v11.1は、包括的な市場分析ツールです 取引への専門的なアプローチ ボリュームプロファイルスナイパー v11.1は、市場状況の包括的な評価に基づいて明確な信号を提供し、一つの指標に15以上の主要なフィルタを組み合わせ 主な特長 ボリューム不均衡分析-アルゴリズムは、各キャンドルの買い手と売り手のシェアを計算し、当事者の1つの優位性を通知します(50%から90%までの設定可能なしきい値)。 マルチレベル信号フィルタリング-インジケータは考慮されます: トレンド指標(9/21) 買われ過ぎ/売られ過ぎゾーンを除くRSI キャンドルパターン(ピンバー、吸収、ハンマー) サポート/抵抗レベル(自動検出) 主要なプレーヤーの活動を識別するためのボリュームスパイク クラシックと増幅されたRSIの相違 ボラティリティ評価のためのATR 傾向の強さを決定するためのADX 価格アクション(内部バーと外部バー) 複数の時間枠の確認 市場構造(高値/安値) セッションフィルタ(アジア、ロンドン、ニューヨークセッション) ニュースの
期間限定オファー 「限定ローンチ価格」 「バージョン2.0後に値上げ予定」 Currencies Gold Momentum Flow Dashboard — 市場の強さを瞬時に把握 複数時間足(M5〜D1)で、為替とゴールドのモメンタムをリアルタイムで表示する高性能ダッシュボード。 マルチタイムフレームROC分析 トレードシグナル搭載 通貨強弱分析 ヒートマップ表示 アラート+ワンクリック切替 市場が見えるようにトレードする 多くのトレーダーは“見えていない”。 他の人が見逃すものを見抜く これは単なるインジケーターではありません。 精度重視のトレーダー向け 優位性を内蔵 すべてが変わる ️ 多くの人が遅れて気づく真実 インジケーターでは稼げない。 「理解」が利益を生む。 今すぐ優位性を手に入れる ダウンロード Currencies Gold Momentum Flow Dashboard
これは、キャンドルの終値を予測する指標です。 このインジケータは、主にD1チャートでの使用を目的としていますが. この指標は、従来の外国為替取引とバイナリオプション取引の両方に適しています。 インジケーターは、スタンドアロンのトレーディングシステムとして使用することも、既存のトレーディングシステムへの追加として機能させることもできます。 このインジケーターは、現在のキャンドルを分析し、キャンドル自体の内部の特定の強度係数と、前のキャンドルのパラメーターを計算します。 したがって、この指標は、市場の動きのさらなる方向性と現在のキャンドルの終値を予測します。 この方法のおかげで、この指標は、短期の日中取引だけでなく、中期および長期の取引にも適しています。 インジケーターを使用すると、市場の状況の分析中にインジケーターが生成する潜在的な信号の数を設定できます。 インジケーターの設定には、このための特別なパラメーターがあります。 また、インジケーターは、チャート上のメッセージの形式で、電子メールで、およびPUSH通知の形式で、新しい信号について通知することができます。 購入後は必ず私に書いて
Phase Analytics Pro: Advanced Cyclic Market Analyzer Phase Analytics Pro is a sophisticated technical tool designed for traders who prioritize mathematical precision over lag-heavy traditional indicators. Based on the principles of digital signal processing, this indicator decomposes price action into phase and quadrature components to identify the dominant market cycle. How it works: The algorithm calculates the instantaneous phase of the market, allowing it to distinguish between trending and
Improved version of the free HMA Trend indicator (for MetaTrader 4) with statistical analysis. HMA Trend is a trend indicator based on the Hull Moving Average (HMA) with two periods. HMA with a slow period identifies the trend, while HMA with a fast period determines the short-term movements and signals in the trend direction. The main differences from the free version: Ability to predict the probability of a trend reversal using analysis of history data. Plotting statistical charts for analyzi
The Th3Eng PipFinite indicator is based on a very excellent analysis of the right trend direction with perfect custom algorithms. It show the true direction and the best point to start trading. With StopLoss point and Three Take Profit points. Also it show the right pivot of the price and small points to order to replace the dynamic support and resistance channel, Which surrounds the price. And Finally it draws a very helpful Box on the left side on the chart includes (take profits and Stop loss
TWO PAIRS SQUARE HEDGE METER INDICATOR Try this brilliant 2 pairs square indicator It draws a square wave of the relation between your two inputs symbols when square wave indicates -1 then it is very great opportunity to SELL pair1 and BUY Pair2 when square wave indicates +1 then it is very great opportunity to BUY pair1 and SELL Pair2 the inputs are : 2 pairs of symbols         then index value : i use 20 for M30 charts ( you can try other values : 40/50 for M15 , : 30 for M30 , : 10 for H1 ,
Was: $249  Now: $99   Market Profile defines a number of day types that can help the trader to determine market behaviour. A key feature is the Value Area, representing the range of price action where 70% of trading took place. Understanding the Value Area can give traders valuable insight into market direction and establish the higher odds trade. It is an excellent addition to any system you may be using. Blahtech Limited presents their Market Profile indicator for the MetaTrader community. Ins
This unique multi-currency strategy simultaneously determines the strength of trends and market entry points, visualizing this using histograms on the chart. The indicator is optimally adapted for trading on the timeframes М5, М15, М30, Н1. For the convenience of users, the indicator renders the entry point (in the form of an arrow), recommended take profit levels (TP1, TP2 with text labels) and the recommended Stop Loss level. The take profit levels (TP1, TP2) are automatically calculated for
Here   our more valuable tools SMC Trend Trading   ,  Easy SMC Trading  ,  Institutional SMC Architect Volume Analysis Tools  ,  Volume flow Profile  ,  Market volume profile  , FVG with Volume  , Liquidity Heatmap Profile  ,  Volume Spread Analysis Trend Identification: Look for the color change. When candles turn Green , look for Buy opportunities. When they turn Red , look for Sell opportunities. Entry: Enter on the break of the trend line or on the pullback to the line. Stop Loss: Use the
The Super Arrow Indicator provides non-repainting buy and sell signals with exceptional accuracy. Key Features No repainting – confirmed signals remain fixed Clear visual arrows: green for buy, red for sell Real-time alerts via pop-up, sound, and optional email Clean chart view with no unnecessary clutter Works on all markets: Forex, gold, oil, indices, crypto Adjustable Parameters TimeFrame Default: "current time frame" Function: Sets the time frame for indicator calculation Options: Can be set
Matrix is a Forex arrow indicator. Displays signals simply and clearly! The arrows show the direction of the transaction, and are colored accordingly, which can be seen in the screenshots. As you can see, trading with such an indicator is easy. I waited for an arrow to appear in the desired direction - I opened a deal. An arrow formed in the opposite direction - closed the deal. The indicator also displays the lines with the help of which the arrow signals are formed, taking into account the int
The principle of this indicator is very simple: detecting the trend with Moving Average, then monitoring the return point of graph by using the crossing of Stochastic Oscillator and finally predicting BUY and SELL signal with arrows, alerts and notifications. The parameters are fixed and automatically calculated on each time frame. Example: If you install indicator on EURUSD, timeframe M5: the indicator will detect the main trend with the Moving Average on this timeframe (for example the Moving
Candle Power Pro
Thushara Dissanayake
4.5 (8)
Candle Power Pro は 、チャートから直接、 実際のティックボリューム 、 強気/弱気圧力 、 買い手と売り手の不均衡 、 価格とボリュームの関係 を分析するように設計された ボリューム分析インジケーター です 。このインジケーターは、 強気と弱気のボリュームの割合 、ボリュームの優位性、ダイバージェンス条件、トレンド確認シグナルを表示することで、ローソク足のボリュームアクティビティを視覚的な市場分析システムに変換します。 外国為替トレーダー 、 金トレーダー 、 インデックストレーダー 、 暗号通貨トレーダー 、 スキャルパー 、 デイトレーダー 、 スイングトレーダー 、およびプライスアクション、SMC、ボリュームベースのアプローチに従うトレーダー 向け に 設計 されたCandle Power Proは、市場の強さと参加者のアクティビティを研究するための完全なワークフローを提供します。内蔵の マルチシンボルスキャナー 、 シングルシンボルダッシュボード 、複数のテクニカル分析ツール、カスタマイズ可能なアラートにより、トレーダーは1つのインターフェースからボリューム
This is a trend indicator without redrawing Developed instead of the binary options strategy (by the color of the Martingale candlestick) Also works well in forex trading When to open trades (binary options) A signal will appear in the place with a candle signaling the current candle It is recommended to open a deal for one candle of the current timeframe M1 and M5 When a blue dot appears, open a deal up When a red dot appears, open a trade down. How to open trades on Forex. When a signal is rec
FX FVG iFVG Signal MT4 は、Fair Value Gap と Inversion Fair Value Gap の考え方を使う Forex トレーダー向けの MetaTrader 4 インジケーターです。 このインジケーターは、強気 FVG、弱気 FVG、強気 iFVG、弱気 iFVG のゾーンをチャート上に自動表示します。価格が iFVG ゾーンに戻り、ローソク足の確認条件を満たした場合、BUY または SELL のポップアップ通知を表示します。 主に H1 と M30 での使用を想定しています。H1 は大きな方向確認、M30 は押し目、戻り、反応確認に適しています。 主な機能: 3本ローソク足による FVG 自動検出 FVG ブレイク後の iFVG 自動検出 強気 FVG と弱気 FVG の表示 強気 iFVG と弱気 iFVG の表示 ゾーン中央線の表示 BUY / SELL ポップアップ通知 チャート上のシグナル矢印 EA 連携用の隠しバッファ 自動売買は行いません 色の説明: 薄緑:強気 FVG、押し目でサポートになる可能性 薄赤:弱気 FVG、戻りでレ
MT5 Version DoIt SMT Divergences - Non-Repainting ICT SMT Indicator for MT5 An SMT divergence indicator for MT5 that shows a perfect setup only after the swing has changed is not giving confirmation. It is giving hindsight. DoIt SMT Divergences compares confirmed swing highs and lows between the chart symbol and a second correlated instrument. When one market makes a new extreme and the other fails to confirm it, the indicator marks the disagreement. The default workflow uses confirmed swings. Y
Supreme Commander
Ramon Sobrevals Arce
4.13 (8)
The indicator of the indicators. The Most Powerful Technique to Determine Forex Trend Strength in 2023. We have perfected Supreme Commander that it calculates an average of the selected indicators (up to 16) and the selected timeframe (all) with the result of a single trend that indicates the potential of buying and selling.  It includes the following indicators: Accelerator/Decelerator oscillator Average Directional Movement Index Awesome oscillator; Bulls and Bears  Commodity Channel Index; De
Delta Pairs
Anatolii Zainchkovskii
Delta Pairs is an indicator for pair trading, it displays the divergence of two currency pairs. Does not redraw. A useful tool for the analysis of the behavior of two currency pairs relative to each other. Purpose The Delta Pairs indicator is designed for determining the divergences in the movements of two currency pairs. This indicator is displayed as two line charts and the difference (delta) between these charts in the form of a histogram. The Delta Pairs indicator will be useful for those w
PipFinite Energy Beam
Karlo Wilson Vendiola
3.94 (17)
Pipfinite creates unique, high quality and affordable trading tools. Our tools may or may not work for you, so we strongly suggest to try the Demo Version for MT4 first. Please test the indicator prior to purchasing to determine if it works for you. We want your good reviews, so hurry up and test it for free...we hope you will find it useful. Combo Energy Beam with Swing Control Strategy: Confirm swing pullback signals Watch Video: (Click Here) Energy Beam with Trend Laser Strategy: Confirm Tre
This may just look like another indicator for identifying and displaying supply and demand, but dig-in further and you will discover it has much more to offer. In addition to the complete flexibility for displaying zones, consider the identification of recent support or resistance, the back-testing capability to help you learn how to identify the best supply and demand zones to trader from, the continuously updated trend information for all time frames, times from around the world displayed on
このプロダクトを購入した人は以下も購入しています
Gann Made Easy は、ミスター・ギャンの理論を使用した取引の最良の原則に基づいた、プロフェッショナルで使いやすい外国為替取引システムです。 W・D・ガン。このインジケーターは、ストップロスとテイクプロフィットレベルを含む正確な買いと売りのシグナルを提供します。 PUSH通知を利用して外出先でも取引可能です。 ご購入後、取引方法の説明と優れた追加インジケーターを無料で入手するには、私にご連絡ください! おそらく、ギャンの取引手法についてはすでに何度も聞いたことがあるでしょう。通常、ギャンの理論は初心者のトレーダーだけでなく、すでにある程度の取引経験がある人にとっても非常に複雑なものです。なぜなら、ギャンの取引手法は理論的にはそれほど簡単に適用できるものではないからです。私はその知識を磨き、最良の原則を私の外国為替インジケーターに組み込むために数年を費やしました。 このインジケーターは非常に簡単に適用できます。必要なのは、それをチャートに添付し、簡単な取引推奨事項に従うだけです。このインジケーターは常に市場分析の仕事を行い、取引の機会を探します。適切なエントリーポイントを検出す
Prop Firm Sniper MT4  is a professional market structure indicator that automatically identifies high-probability BUY and SELL opportunities using BOS and CHoCH analysis. Recommended Timeframes: For backtesting, use the indicator on   M5 or M15   for Gold (XAUUSD), and   M15 or H1   for more volatile Forex pairs such as   GBPUSD, USDJPY, EURGBP , and similar markets. CONTACT ME AFTER PURCHASE TO CLAIM YOUR FREE BONUSES! Prop Firm Sniper  is a professional market structure indicator designed t
Neuro Poseidon is a new indicator by Daria Rezueva. It combines precise trading signals with adaptive TP/SL levels - creating best possible trades as a result! Message me and get  Neuro Poseidon Assistant  as a gift to automize your trading process! What makes it stand out? 1. Proven profitability on all assets and timeframes 2. Only confirmed BUY and SELL signals present on the chart 3. Adaptive TP & SL levels generated by the software for each trade 4. Easy to understand - suitable for all
Super Signal – Skyblade Edition プロ仕様のノンリペイント / ノーラグ・トレンドシグナルシステム。卓越した勝率を実現 | MT4 / MT5 対応 1分足、5分足、15分足などの低い時間足で最も効果を発揮します。 主な特徴: Super Signal – Skyblade Edition は、トレンド取引に特化したスマートなシグナルシステムです。マルチレイヤーのフィルターロジックを用いて、明確な方向性と実際のモメンタムに支えられた強力なトレンドのみを検出します。 このシステムは 天井や底を予測するものではありません 。次の3つの条件がすべて満たされた場合にのみシグナルを発生させます: 明確なトレンド方向 モメンタムの増加 健全なボラティリティ構造 市場セッションに基づく流動性分析と組み合わせることで、シグナルの精度とタイミングがさらに向上します。 シグナルの特性: すべての矢印シグナルは 100% 非リペイント / 遅延なし 一度出現したシグナルは固定され、点滅・消失しません チャート上の矢印、情報パネル、ポップアップ通知、音声アラート、プッシュ通知
M1 SNIPER は使いやすいトレーディングインジケーターシステムです。M1時間足向けに設計された矢印インジケーターです。M1時間足でのスキャルピングのためのスタンドアロンシステムとして、また既存のトレーディングシステムの一部としても使用できます。このトレーディングシステムはM1時間足での取引に特化して設計されていますが、他の時間足でも使用できます。元々、この手法はXAUUSDとBTCUSDの取引用に設計しましたが、他の市場においても役立つと考えています。 インジケーターのシグナルは、トレンドの方向と逆方向に取引できます。インジケーターのシグナルを利用して両方向に取引するのに役立つ特別な取引テクニックをご紹介します。この手法は、特別な動的なサポートとレジスタンスの価格帯を利用することに基づいています。 ご購入後、M1 SNIPER矢印インジケーターをすぐにダウンロードできます。さらに、M1 SNIPERツールのすべてのユーザーに、以下のスクリーンショットに表示されているApollo Dynamic SRインジケーターを無料で提供しています。この2つのインジケーターを組み合わせることで
この製品は 2026 年の市場向けに更新され、最新の MT5 ビルドに最適化されています。 価格更新のお知らせ: Smart Trend Trading System は現在 $99 で提供されています。 次の 30 件の購入 後、価格は $199 に上がります。 特別オファー: Smart Trend Trading System を購入後、私にプライベートメッセージを送ることで、 Smart Universal EA を無料 で受け取り、Smart Trend のシグナルを自動売買に変えることができます。 Smart Trend Trading System は、リペイントなし、再描画なし、遅延なしの完全なトレーディングシステムです。よりクリーンなシグナル、より明確なトレンド方向、そしてより整理された取引方法を求めるトレーダー向けに作られています。 Online course , manual and [download presets] . このシステムは、トレンド検出、反転ゾーン、Smart Cloud、トレーリングストップロジック、サポートとレジスタンス、ローソク足の色分け
この製品は 2026 年の市場向けに更新され、最新の MT5 ビルドに最適化されています。 価格更新のお知らせ: Atomic Analyst は現在 $99 で提供されています。 次の 30 件の購入 後、価格は $199 に上がります。 特別オファー: Atomic Analyst を購入後、私にプライベートメッセージを送ることで、 Smart Universal EA を無料 で受け取り、Atomic Analyst のシグナルを自動売買に変えることができます。 Atomic Analyst は、リペイントなし、再描画なし、遅延なしの Price Action トレーディングインジケーターで、手動取引、シグナルの明確化、EA 自動化のために設計されています。 User manual: settings, inputs and strategy.     &   User Manual PDF . 価格行動、強さ、モメンタム、マルチタイムフレーム方向、高度なフィルターを分析し、トレーダーがノイズを減らし、弱いセットアップを避け、より構造化された取引判断を行えるようにします。 こ
トレンドトレーディング は、タイミングのプルバックとブレイクアウトにより、市場で起こっているトレンドから可能な限り利益を得るように設計された指標です。確立されたトレンドの中で価格が何をしているかを分析することにより、取引の機会を見つけます。 [ インストールガイド | 更新ガイド | トラブルシューティング | よくある質問 | すべての製品 ] 自信を持って効率的に金融市場を取引する むち打ちにならずに確立されたトレンドから利益を得る 収益性の高いプルバック、ブレイクアウト、早期の逆転を認識する この指標は、独自の品質とパフォーマンスを分析します 複数時間枠のダッシュボードを実装します インジケーターは再描画されていません 電子メール/音声/視覚アラートを実装します 確立されたトレンドは多くの取引機会を提供しますが、ほとんどのトレンド指標はそれらを完全に無視しています。インジケーターの解釈はかなり簡単です: (1) トレンドの変化 (2) トレンドの方向への後退 (3) トレンドの方向へのブレイクアウト 赤いダッシュ は下降トレンド中の修正です 青いダッシュ は上昇トレンド中
Scalper Inside PRO Scalper Inside PRO は、独自の内蔵アルゴリズムを用いて相場の方向性や主要なターゲット価格を評価する、デイトレード向けのトレンド&スキャルピングインジケーターです。本インジケーターはエントリーポイントとエグジットポイント、および複数の利益確定ターゲット価格を自動的に計算し、詳細なパフォーマンス統計を表示します。これにより、さまざまな銘柄や戦略がヒストリカルデータ上でどのように機能したかを確認できます。これは、現在の相場環境に適した銘柄を選ぶのに役立ちます。また、ご自身の矢印インジケーターを Scalper Inside PRO に接続し、その統計やヒストリカルシグナルをすばやく確認することも可能です。 Scalper Inside PRO マニュアルおよび設定の説明: こちらをクリックして読む 本インジケーターはあらゆる銘柄および時間足で動作し(デイトレードには M5 を推奨)、複数の内蔵戦略を備えています。単独のスキャルピングツールとして、またトレードシステムの分析コンポーネントとして使用できます。 主な機能 独自の次世代トレ
DayTrader PRO DayTrader PROは、ジョン・エリュース(John Ehlers)のラグuerreフィルターと強力な自動最適化エンジンを組み合わせた、高度なトレーディング・インジケーターです。固定されたパラメーターを使用するのではなく、直近の市場状況に基づいて最適な設定を自動的に検索するため、手動による絶え間ない調整をすることなく、変化する市場のボラティリティに適応できます。 本インジケーターは、明確な「買い(BUY)」および「売り(SELL)」シグナルを生成し、現在の市場ボラティリティから算出された適応型のストップロス(Stop Loss)およびテイクプロフィット(Take Profit)レベルを表示します。トレンド、効率レシオ(Efficiency Ratio)、ボラティリティ、およびローソク足フィルターが内蔵されており、精度の低いセットアップを排除し、シグナルの精度を向上させます。 リアルタイム・パフォーマンスパネルには、現在最適化されている設定、プロフィットファクター(Profit Factor)、勝率(Win Rate)、ドローダウン(Drawdown)、
Cycle Sniper
Elmira Memish
4.39 (36)
Please contact us after your purchase and we will send you the complimentary indicators to complete the system Cycle Sniper is not a holy grail but when you use it in a system which is explained in the videos, you will feel the difference. If you are not willing to focus on the charts designed with Cycle Sniper and other free tools we provide, we recommend not buying this indicator. We recommend watching the videos about the indiactor and system before purchasing. Videos, settings  and descri
現在20%OFF! 初心者やエキスパートトレーダーに最適なソリューションです。 このインディケータは、エキゾチックペア・コモディティ・インデックス・先物など、あらゆるシンボルの通貨の強さを表示することに特化したインディケータです。金、銀、原油、DAX、US30、MXN、TRY、CNHなどの通貨の強さを表示するために、9行目にどのシンボルでも追加することができます。独自の機能を多数搭載し、新しい計算式を採用したため、ユニークで高品質、かつ手頃な価格のトレーディングツールとなっています。新しいトレンドやスキャルピングチャンスのトリガーポイントを正確に把握することができるため、あなたのトレードがどのように改善されるか想像してみてください。 ユーザーマニュアル:ここをクリック   https://www.mql5.com/en/blogs/post/708876 すべての時間枠に対応します。あなたはすぐにトレンドを見ることができるようになります! 新しいアルゴリズムに基づいて設計されているため、潜在的な取引の特定と確認がより簡単になります。これは、8つの主要通貨と1つのシンボルの強弱
KURAMA GOLD SIGNAL PRO(MT4版)— 7層フィルター・自動TP/SL・品質スコア・サイン履歴保存搭載 XAUUSD完全トレードシステム リアルタイムでリペイントしません。サインが出た瞬間、矢印・エントリー・TP・SLはその場で固定され、後から動きません。あなたがトレードするのは、この「リアルタイムで出たサイン」です。さらにv7.20では、実際に通知されたサインを自動保存し、再起動後もそのまま復元します。 購入者限定特典 買い切りライセンスをご購入いただいた方に、AI Zone Radar($59相当)+完全PDFマニュアルを無料プレゼント。本体価格に$59相当の特典が付いてきます。購入後にMQL5でメッセージをお送りください。 AI Zone Radar: https://www.mql5.com/en/market/product/175834 ゴールドトレーダーのコミュニティで実際に使用され、精度と使いやすさで高く評価されています。 あな
発見が困難で頻度が少ないため、分岐は最も信頼できる取引シナリオの1つです。このインジケーターは、お気に入りのオシレーターを使用して、通常の隠れた分岐点を自動的に見つけてスキャンします。 [ インストールガイド | 更新ガイド | トラブルシューティング | よくある質問 | すべての製品 ] 取引が簡単 通常の隠れた発散を見つけます 多くのよく知られている発振器をサポート ブレイクアウトに基づいて取引シグナルを実装します 適切なストップロスおよび利益レベルを表示します 設定可能なオシレーターパラメーター カスタマイズ可能な色とサイズ バー単位でサイズ別に分岐をフィルタリング パフォーマンス統計を実装します 電子メール/音声/視覚アラートを実装します 幅広い市場の見通しを提供するために、異なるオシレーターを使用して、干渉なしで同じチャートにインジケーターを何度もロードできます。このインジケーターは、次のオシレーターをサポートしています。 RSI CCI MACD オスマ 確率的 勢い 素晴らしい発振器 加速器発振器 ウィリアムズパーセントレンジ 相対活力指数 特に外国為替市場では、
現在30%OFF! このダッシュボードは、複数のシンボルと最大9つのタイムフレームで動作するソフトウェアの非常に強力な部分です。 このソフトは、弊社のメインインジケーター(ベストレビュー:Advanced Supply Demand)をベースにしています。    Advanced Supply Demand ダッシュボードは、素晴らしい概要を提供します。それは示しています。  ゾーン強度評価を含むフィルタリングされた需給値。 ゾーン内/ゾーンへのPips距離。 ネストされたゾーンがハイライトされます。 選択されたシンボルの4種類のアラートを全ての(9)時間枠で提供します。 それはあなたの個人的なニーズに合わせて高度に設定可能です。 あなたの利益! すべてのトレーダーにとって最も重要な質問です。 市場に参入するのに最適なレベルはどこか? 成功のチャンスとリスク/リターンを得るために、強力な供給/需要ゾーン内またはその近くで取引を開始します。 損切りの最適な位置はどこですか? 最も安全なのは、強力な供給/需要ゾーンの下/上にストップを置くことです。 最適な利益
ORB Seeker
Marcela Goncalves De Oliveira
発売記念特別価格! たったの79ドル! 10個売れた後、価格は値上げされ、最終価格は199ドルになります。 ご購入後、ご連絡いただければ、ブレイクアウトシグナルに基づいて完全に自動化された最適化済み設定ファイルで取引できる無料のボーナスEAをお送りします。 クリーンなセッションブレイクアウトを自信を持ってキャッチしましょう! ORB Seekerは、正確性、シンプルさ、柔軟性、そして明確なチャート構造を求めるトレーダー向けに開発された、プロ仕様のオープニングレンジブレイクアウト(ORB)インジケーターです。 このシステムは、あらゆる銘柄のプレマーケットまたはカスタムセッションのレンジを自動的にプロットし、エントリー、ストップロス、テイクプロフィット、およびオプションの50%部分TPレベルを含む明確なブレイクアウトシグナルを提供します。すべての計算結果はリアルタイムでチャート上に表示されます。 ロンドン市場オープン、ニューヨーク市場セッション、アジア市場セッション、または独自のカスタム市場時間帯で取引できます。ORB Seekerは選択したセッション時間帯に合わせて調整されるため、市
Gold Pro Scalper
Aleksandr Makarov
4.8 (5)
Gold Pro Scalper Precise entry points for currencies, crypto, metals, stocks, indices! Indicator 100% does not repaint!!! If a signal appeared, it does not disappear! Unlike indicators with redrawing, which lead to loss of deposit, because they can show a signal, and then remove it. Trading with this indicator is very easy. Wait for a signal from the indicator and enter the deal, according to the arrow  (Blue arrow - Buy, Red - Sell). I recommend using it with the Trend Filter (download
デイトレーダーマスターは、デイトレーダーのための完全なトレーディングシステムです。システムは2つのインジケーターで構成されています。 1つの指標は売買する矢印信号です。それはあなたが得る矢印インジケーターです。 2つ目のインジケーターを無料で提供します。 2番目のインジケーターは、これらの矢印と組み合わせて使用​​するために特別に設計されたトレンドインジケーターです。 インジケーターは繰り返さず、遅れないでください! このシステムの使用は非常に簡単です。 2色の線で表示されている現在のトレンドの方向に矢印信号をたどる必要があります。青は買いの傾向です。赤い色は売りの傾向です。青い矢印は買いシグナルです。赤い矢印は売りの合図です。トレンドラインの色と一致するように、矢印の色と信号の方向が必要です。 矢印インジケーターは、主に時間間隔M5とM15での日中取引のために作成されました。ただし、技術的には、システムは他の時間間隔で使用できます。 インジケータには、PUSHメッセージ機能を備えたポップアップアラートが装備されています。 購入後、必ず私に書いてください!私はあなたにシステムとの取引の
Advanced Supply Demand
Bernhard Schweigert
4.91 (302)
現在30%オフ 初心者にもエキスパートトレーダーにも最適なソリューション このインジケーターは独自の機能と新しい公式を多数内蔵しており、ユニークで高品質かつ手頃な取引ツールです。このアップデートでは、2つの時間枠ゾーンを表示できるようになります。より長いTFだけでなく、チャートTFとより長いTF(ネストゾーンを表示)の両方を表示できます。すべてのSupply Demandトレーダーの皆さんのお気に召すはずです。:) 重要情報の公開 Advanced Supply Demandの可能性を最大化するには、 https://www.mql5.com/ja/blogs/post/720245 にアクセスしてください。   エントリーまたはターゲットの正確なトリガーポイントを正確に特定できれば取引がどのように改善されるか想像してみてください。新しい基盤となるアルゴリズムに基づいて構築されているため、買い手と売り手の間の潜在的な不均衡をさらに簡単に特定できます。これは、最も強い需要と供給のゾーンと、過去のパフォーマンス(古いゾーンを表示)がグラフィカルに表現されるためです。これらの機能は、最適な
Gold Signal Swing Pro XAUUSD with Auto TP SL (MT4) — 7層フィルター + RR保証システム搭載 XAUUSDスイング完全トレードシステム リペイントなし。リドローなし。ラグなし。すべてのサインは確定後に変わりません。 購入者限定特典:買い切りライセンスをご購入いただいた方に、AI Zone Radar($59相当)+PDFマニュアルを無料プレゼント。購入後にMQL5でメッセージをお送りください。 AI Zone Radar: https://www.mql5.com/en/market/product/175834 MT5版もあります:  https://www.mql5.com/ja/market/product/177643?source=Site +Profile+Seller ゴールドトレーダーのコミュニティで実際に使用され、精度と使いやすさで高評価。 こんな方におすすめ 仕事や家事で忙しく、M5/M15に張り付けない方 厳選されたサインだけで運用したい方 寝てる間や外出中もポジションを持っておきたい方 1サインで大きく取りた
新しい指標の検索と試行をやめてください! Winshots Massive FX Profitsインジケーターを入手して、群衆から離れてください。 長年の取引経験により、このすべてを1つの指標で構築することができました。 Winshots Massive FX Profitsでプロのように取引しましょう! この指標は、以下の方法論を使用して、より一貫した収益性の高いトレーダーになるのに役立ちます。 -マーケットボリュームプロファイル -毎日のピボットレベル -価格サイクル分析 ボリュームプロファイルとは何ですか? ボリュームプロファイルは、多くのトレーダーが見落としている非常に便利な取引ツールです。重要な価格アクションが発生した実際の価格レベルを見つけることができます。サポートレベルとレジスタンスレベルに似ていますが、ロジックが異なります。ボリュームプロファイリングは、機関投資家の取引が行われた実際のレベルのサポートとレジスタンスの概要を示しています。これ以上の推測作業はありません!あなたはすべての重い取引がたくさんのロットとボリュームでいつ行われたかを正確に知るでし
TrendMaestro
Stefano Frisetti
4 (4)
Attention: beware of SCAMS, TRENDMAESTRO is only ditributed throught MQL5.com market place. note: this indicator is for METATRADER4, if you want the version for METATRADER5 this is the link:  https://www.mql5.com/it/market/product/108106 TRENDMAESTRO ver 2.5 TRENDMAESTRO recognizes a new TREND from the start, he never makes mistakes. The certainty of identifying a new TREND is priceless. DESCRIPTION TRENDMAESTRO identifies a new TREND in the bud, this indicator examines the volatility, volumes a
この製品は 2026 年の市場向けに更新され、最新の MT5 ビルドに最適化されています。 価格更新のお知らせ: Smart Price Action Concepts は現在 $200 で提供されています。 次の 30 件の購入 後、価格は $299 に上がります。 特別オファー: 購入後、私にプライベートメッセージを送ることで、 無料ボーナス + ギフト を受け取ることができます。 まず、このトレーディングツールはリペイントなし、再描画なし、遅延なしのインジケーターであり、プロフェッショナルな取引に最適であることを強調しておきます。 Online course , and manual Smart Price Action Concepts Indicator は、初心者から経験豊富なトレーダーまで使える非常に強力なツールです。20 種類以上の便利なインジケーターを 1 つにまとめ、Inner Circle Trader Analysis や Smart Money Concepts Trading Strategies などの高度な取引アイデアを組み合わせています。このインジケ
PZ Day Trading
PZ TRADING SLU
3.67 (3)
このインディケータは、価格アクション分析とドンチャンチャネルのみを使用して、ジグザグ方式で価格の反転を検出します。再描画やバックペインティングを一切行わずに、短期取引向けに特別に設計されています。それは彼らの操作のタイミングを増やすことを目指している賢明なトレーダーにとって素晴らしいツールです。 [ インストールガイド | 更新ガイド | トラブルシューティング | よくある質問 | すべての製品 ] 驚くほど簡単に取引できます すべての時間枠で価値を提供します 自己分析統計を実装します 電子メール/音声/視覚アラートを実装します 可変長のブレイクアウトと混雑ゾーンに基づいて、インディケータは価格アクションのみを使用して取引を選択し、市場が非常に高速に行っていることに反応します。 過去のシグナルの潜在的な利益が表示されます この指標は、独自の品質とパフォーマンスを分析します 負けブレイクアウトは強調表示され、説明されます インジケータは、非バックペインティングおよび非再ペイントです この指標は、日中のトレーダーが単一の価格反転を見逃さないようにするのに役立ちます。ただし、すべての
PRO Renko Systemは、特別にRENKOチャートを取引するために設計された高精度の取引システムです。 これは、様々な取引商品に適用することができる普遍的なシステムです。 システムは効果的に正確な逆転信号へのアクセスを与えるいわゆる市場の騒音を中和する。 表示器は非常に使いやすく、信号の生成に責任がある1つの変数だけがあります。 あなたは簡単にお好みの任意の取引ツールとレンコバーのサイズにツールを適応させることができます。 私はいつもあなたが私のソフトウェアで収益性の高い取引を支援するために余分なサポートを提供する準備ができています! 私はあなたに幸せで収益性の高い取引をしたいです! ご購入後にご連絡ください! 私はあなたに私のレンコチャートジェネレータを送信します。 私はまた、私の個人的な推奨事項やシステムの他のモジュールを無料で共有します!
Binary Trader Master は、ローソク足の終値を予測する矢印ベースのインジケーターです。分析は 1 つのろうそく内でのみ行われます。ろうそくが開くと、分析を行い、ろうそくの終値を予測するのに少し時間がかかります.次に、信号を生成します。この指標では、分析に使用できる時間制限を適用することもできます。つまり、ろうそく内での分析にどれくらいの時間が許可されているかを実際に指標に伝えることができます。インジケーターは、ろうそくの特別なボリューム パターンを監視します。この分析は、現在の (0) ローソク足の終値を実際に予測します。このようなローソク足は通常、ボリュームが大きいため、これらのシグナルには潜在的な利益があり、外国為替取引にも使用できます。バイナリーと外国為替の両方のトレーダーがインジケーターの恩恵を受けることができます. インジケーターは個々のろうそくの本体で動作するため、インジケーターはリアルタイムまたはビジュアル戦略テスト モードでのみシグナルを提供します! 信号は再描画されません! 購入後ご連絡ください!私はあなたに取引指示を提供し、無料で素晴らしいボーナス
There is always a need to measure if the market is "quiet" or it is volatile. One of the possible way is to use standard deviations, but the issue is simple : We do not have some levels that could help us find out if the market is in a state of lower or higher volatility. This indicator is attempting to do that : •           values above level 0 are indicating state of higher volatility (=GREEN buffer) •           values below level 0 are indicating state of lower volatility (=RED buffer)
トレンドラインプロ   市場の真の方向転換点を理解するのに役立ちます。この指標は、真のトレンド反転と主要プレーヤーが再び参入するポイントを示します。 分かりますか     BOSライン   複雑な設定や不要なノイズなしに、より長い時間足でのトレンドの変化と重要なレベルを把握できます。シグナルは再描画されず、バーが閉じた後もチャート上に残ります。 VERSION MT 5     -     RFI LEVELS PRO インジケーター と組み合わせることで、その潜在能力を最大限に発揮します。 インジケーターが示す内容: 本当の変化   トレンド(BOSライン) 一度シグナルが現れたら、それは有効です!これは、リペイント機能を持つインジケーターとの重要な違いです。リペイント機能を持つインジケーターは、シグナルを発した後、それを変更し、資金の損失につながる可能性があります。これにより、より高い確率と精度で市場に参入できます。また、矢印が現れた後、目標値(利益確定)に達するか、反転シグナルが現れるまで、ローソク足の色を変更する機能もあります。 繰り返しエントリ       主要プレーヤーの
Italo Volume Indicator
Italo Santana Gomes
4.92 (79)
BUY INDICATOR AND GET EA FOR FREE AS A BONUS + SOME OTHER GIFTS! ITALO VOLUME INDICATOR  is the best volume indicator ever created, and why is that? The Indicator works on all time-frames and assets, indicator built after 7 years of experience on forex and many other markets. You know many volume indicators around the internet are not complete, does not help, and it's difficult to trade, but the Italo Volume Indicator is different , the Italo Volume Indicator shows the wave volume, when market
Dashboard uses Ichimoku Strategy to find best trades. Get extra Indicators/Template: And read more about detailed Product Description and usage here: https://www.mql5.com/en/blogs/post/747457 Read more about Scanner Common features in detail here: https://www.mql5.com/en/blogs/post/747456 Features: Price Kumo Breakout Tenkan-Kijun Cross Chikou/CLoud and Chikou/Price Support/Resistance (SR-SS or SR-NRTR) Stochastic OB/OS and back Awesome Oscillator Higher Timeframe Ichimoku Trend Align
フィルタ:
Stanislav Melnikov
898
Stanislav Melnikov 2026.01.24 02:06 
 

Работает хорошо!))

Jade Lee Valentine
202
Jade Lee Valentine 2025.10.01 11:10 
 

Great indicator

Francis Santos
252
Francis Santos 2025.09.11 15:37 
 

Bom dindicador e suporte!

XANKEEZ
889
XANKEEZ 2025.07.21 02:49 
 

Buy and Sell Volume Spikes Indicator – Great Tool!

I'm really happy with this indicator!

It makes it so much easier to spot strong buying and selling pressure, and it’s helped me find better entry and exit points.

The volume "spikes" are super clear and easy to read on the chart, so I feel more confident in my trading decisions.

One useful tip I got from Andrei—the author—was to check higher time frames for confirmation.

This approach really helps boost the win rate and makes spotting important volume moves even simpler.

What I like most:

-Clear and simple visual signals

-Easy to set up and use

-Quick and helpful customer service

The author's support is excellent—my questions were answered quickly and in a friendly way.

It’s good to know there’s reliable help available if you need it.

So far, this indicator has proved to be among the most practical tools I’ve purchased from the MQL5.

レビューに返信