Justo mini indice

Este indicador calcula e exibe no gráfico o preço justo do mini índice (WIN) com base em dados fundamentais do mercado. Além disso, ele traça automaticamente linhas de suporte e resistência percentuais, ajudando você a visualizar zonas importantes de preço.

É como ter uma régua financeira no gráfico, mostrando onde o preço "deveria estar", de forma objetiva, considerando o cenário macroeconômico!

O indicador usa uma fórmula de precificação de contratos futuros baseada em:

  • O preço à vista do Ibovespa (S0);

  • A taxa de juros (CDI);

  • O dividend yield (DY) das empresas do índice;

  • E os dias úteis até o vencimento do contrato futuro.

Com isso, ele calcula o valor teórico (ou "justo") do mini-índice. Depois, adiciona níveis de variação percentual ao redor desse valor, servindo como referência visual para possíveis zonas de suporte e resistência.

Vantagens do Indicador

  • Clareza Visual: Deixa visível o preço justo e seus níveis críticos.

  • Baseado em Fundamentos: Vai além da análise técnica tradicional.

  • Personalizável: Você pode ajustar os parâmetros conforme o cenário atual.

  • Útil para Estratégias Avançadas: Pode ser usado em operações de reversão, rompimento ou como filtro de tendência.


おすすめのプロダクト
Unlock the power of Smart Money Concepts (SMC) with the cleanest FVG indicator on the market. Smart FVG Pro is not just another gap detector. It is designed for professional traders who need to filter out noise and focus on high-probability reversal zones. Unlike standard indicators that clutter your chart with every minor gap, Smart FVG Pro uses advanced filtering logic (Trend + Volatility) and a unique "Smart Mitigation" system to automatically remove invalidated zones, keeping your chart clea
Scan a fixed list of assets (Ibovespa) in the chosen timeframe (TimeFrame). For each pair and for various periods. Calculate a regression model between the two assets (and, if desired, using the bova11 index as a normalizer). Generate the spread of this relationship, its mean, standard deviation, speculative deviation, and betas (B1 and B2). Apply an ADF test without exclusion (cointegration/stationarity). Calculate the Z-score of the current exclusion (how many standard deviations are away from
FREE
SuperTrendNew
Tsog Erdene Borjigon Enkhkhudulmur
4.83 (6)
SuperTrendNew 2.0 is a clean, non-repainting SuperTrend indicator for MetaTrader 5. It draws one trend line you can actually trade from, marks every reversal with an arrow, tells you about it by popup, sound and mobile push, and keeps a live dashboard on the chart with the trend state, the line price, the distance to the line in points and in ATR, and the age of the current trend. Free, no time limit, no ad banner on your chart. What is new in 2.0 Version 1.1 has been on the Market since January
FREE
TrendView Ultimate — A Complete Trading System for Trend Clarity, Profit Insight, and Strategic Entries TrendView Ultimate is a professional trading system designed to help traders identify trend direction, high-quality entries, and potential exits with clarity, confidence, and measurable performance. More than just a trend indicator, it offers non-repainting signals, dynamic visual feedback, and a powerful statistics panel with real-time analytics, allowing traders to test, adapt, and valida
SuperSmooth WMA Trading System Pro は、低品質なエントリーを排除するために設計されたルールベースのトレーディングシステムです。本システムは単一のインジケーターに依存せず、トレンド方向、モメンタム、市場構造、そして上位足の方向性が完全に一致した場合のみシグナルを生成します。 各エントリーは4つの独立したフィルターによって厳格に確認されます。いずれか一つでも条件が一致しない場合、シグナルは表示されません。これにより、レンジ相場や不安定な局面での無駄なトレードを大幅に削減します。 チャート上にはロングエントリー、ショートエントリー、ロングイグジット、ショートイグジットの矢印が表示され、さらにローソク足の色によって現在の市場状態を瞬時に把握できます。緑は上昇コンフルエンス、赤は下降コンフルエンス、灰色はレンジ状態を示します。 すべての通貨ペア、指数、商品、暗号資産、および全時間足に対応しています。
After purchasing the product, please contact us at: escritorioremotoiq28@gmail.com or Natanael.playoff@gmail.com. ​Upon contacting us, you will receive an additional indicator (included in the image) along with a detailed guide on how to use it. The files and instructions will be sent directly to your email. **Flow Code: Institutional Liquidity & Amplitude Analyzer** **The Flow Code is the ultimate tool for those who want to trade the real market flow.** Developed for **professional traders*
Currency Strength Monitor is a professional multi-currency strength indicator for MetaTrader 5 that analyzes and displays the relative strength of 8 major currencies (USD, EUR, GBP, AUD, NZD, JPY, CHF, CAD) in real-time. The indicator calculates strength values by aggregating price movements across 28 currency pairs and normalizing them using ATR, providing traders with a clear visual representation of which currencies are strengthening or weakening. Key Features: Multi-Currency Analysis — Monit
Advanced 4-timeframe stochastic alignment indicator with non-repainting signals, MTF dashboard, scoring system, and 8 signal types. Professional-grade. Market-ready. The most complete multi-stochastic signal indicator for MetaTrader 5. Stoch Quad Rotation Signal detects high-probability trading opportunities by analyzing the simultaneous alignment of four stochastic oscillators running at different speeds — from fast scalping-level to slow macro-trend level. When all four agree, the signal ca
このシステムは、機関投資家のトレード原則(スマートマネーコンセプト:Smart Money Concepts)を完全自動化した**「高度なチャート分析およびトレード計画アシスタント」**のようなものです。ニュースやセキュリティ機能を除くと、このシステムを使用する主な利点とメリットは、以下のようにトレード効率の向上に直結しています。 1. 分析の負担を軽減し、感情的なバイアスを排除(自動化&偏りのない分析:Automated & Unbiased Analysis) 市場構造の自動分析: システムがトレーダーの目の代わりとなり、重要なトレンド転換点、意味のあるエントリーゾーン(オーダーブロック:Order Blocks)、価格のギャップ(フェアバリューギャップ:Fair Value Gaps)、および流動性のスイープポイント(流動性:Liquidity)を自動的に検出し、ラインを描画します。 体系的な意思決定: システムは厳密に設定されたロジックに基づいて各ゾーンを描画するため、トレーダーがチャートを見る際の「思い込み」や感情による判断を避けることができます。これは、優れたトレード規律を
NineEdge Pro EA
Mohammed Eltayeb Mohammed Khairalla
NineEdge Pro EA マルチストラテジー|マルチタイムフレーム MetaTrader 5 自動売買システム NineEdge Pro EA は、MetaTrader 5 プラットフォーム向けに開発されたエキスパートアドバイザー(EA)です。 複数の独立したトレードロジックモジュールを、単一の取引実行システムに統合しています。 本 EA は、事前に定義されたルールベースの取引ロジックを使用し、異なる時間足および多様な市場環境で動作するよう設計されています。 すべての取引判断は自動的に行われ、手動操作は不要です。  基本コンセプト NineEdge Pro EA は、単一の取引手法に依存せず、複数時間足における戦略分散を採用しています。 各戦略モジュールは論理的に独立しており、それぞれ固有のルールに基づいて動作します。これにより、以下のような異なる市場の動きに対応します。 価格のブレイクアウト モメンタムの継続 ボラティリティの変化 平均回帰的な価格動向 サポートおよびレジスタンスへの反応 すべての戦略は、統一されたリスク管理および注文執行フレームワーク内で動作します。  戦略モ
FiveStarFX Gold Reversal Edge Professional automated trading solution designed for structured execution and controlled risk management in the Gold market. Built for traders who value discipline, precision, and consistency. Key Features Fully automated trading One trade at a time (controlled exposure) Fixed Stop Loss and Take Profit Smart Break-Even protection Profit lock with buffer Step-based trailing management Spread protection system Works on any broker Trade Management The E
FREE
RED ZONE Monitor Loss-Cut & Break-Even Risk Monitor for Averaging Traders (MT5) RED ZONE Monitor is a risk management indicator for traders who use averaging, scaling-in, or multiple open positions . It visually displays: The loss-cut (liquidation) risk zone The break-even price Based on current open positions, lots, and margin conditions This indicator does not provide entry signals. It does not promise profits. It shows where your account actually fails if price moves against you. What RED ZO
Стрелочный Индикатор OTKAT Оглавление Почему он работает? Фильтр "Уровня MACD" Фильтр "Времени" Фильтр "Круглых уровней" Оповещения (Alert, Push, Telegram) Результаты теста (EURUSD M5, Бинарки, 3 свечи) Что входит в покупку? Для кого это? Поддержка Привет. Представляю вам OTKAT — это стрелочник основанный на двух стратегиях, "Откат к Скользящей Средней" и "Откат в зону Перекупленности или Перепроданности WPR". Я протестировал его на парах EURUSD/GBPUSD на таймфреймах 
CapitalSol Forex MTF Scanner Multi-Timeframe Forex Trend Scanner for MetaTrader 5 CapitalSol Forex MTF Scanner is a multi-symbol and multi-timeframe market analysis indicator designed to provide a structured overview of Forex market direction directly inside MetaTrader 5. Instead of opening and checking multiple currency charts individually, the scanner displays the selected Forex pairs in one compact dashboard and evaluates their directional state across several timeframes simultaneously.
概要 Candle Timer Countdown Pro は、現在のローソク足が終了するまでの残り時間を、滑らかで正確なカウントダウンとして表示します。さらに、円形のプログレスアーク(進行表示)を組み合わせることで、残り時間を瞬時に視覚的に把握できます。 ティック間で停止したり、時間がずれてしまう他のタイマーとは異なり、本インジケーターはサーバー時間の補間(Server Time Interpolation)を使用し、M1 から MN まであらゆる時間足で途切れのないスムーズなカウントダウンを実現します。 1分足でのスキャルピングでも、H4でのスイングトレードでも、現在のローソク足が正確にいつ確定するのかを把握することで、エントリータイミングの最適化、ローソク足パターンの確認、そして早すぎる判断の回避に役立ちます。 このタイマーが他と違う理由 多くの MT5 用キャンドルタイマーは TimeCurrent() のみに依存しており、新しいティックが到着したときにしか更新されません。低ボラティリティ時や上位時間足では、ティックの間隔が数秒空くことがあり、その間タイマーが停止し、その後突
GOLD TRACK — MT5 Gold Track is a technical analysis indicator designed primarily for XAUUSD / GOLD trading on MetaTrader 5. It combines multiple market conditions into a structured signal system, helping traders identify potential bullish and bearish setups without relying on a single indicator. Key Features EMA Trend Analysis RSI Momentum Confirmation ️ ATR Volatility Analysis ️ Candle Confirmation ️ H1 Multi-Timeframe Confirmation Market Structure Analysis Liquidity Anal
Auto Stop Loss and Target Enforcer watches every new position. If one opens without a stop loss or a take profit, it adds them a few seconds later. It covers trades opened by hand and trades opened by other Expert Advisors. How stops and targets are set - Stop loss: a multiple of the typical market move (Average True Range), a fixed number of pips, a set share of the account, or beyond the nearest support or resistance level. - Take profit: a multiple of the typical market move, a fixed number
Edge Radar Pro — every pair, scored by edge. Edge Radar Pro scans your entire Market Watch and, for every symbol, auto-optimizes three price-action strategies — Momentum, Reversal and Breakout — across a grid of signal strengths and ATR-based SL/TP pairs. Each combination is backtested on closed bars only (non-repaint), and the winner is ranked by a single honest number: the Edge Score. Most scanners rank by raw Profit Factor — which flatters tiny samples. The Edge Score is a confidence-adjusted
マルチタイムフレームRSIインジケーター 直感的なRSIインジケーターでマルチタイムフレーム分析の力を解き放ちましょう! 単一のチャート上で、さまざまな時間枠における市場の勢いを包括的に把握できます。当社のマルチタイムフレームRSIインジケーターを使用すると、5つのカスタマイズ可能な時間枠で一貫した期間で相対力指数(RSI)を追跡でき、より情報に基づいた取引決定を下すことができます。 主な機能: 同時マルチタイムフレーム表示: 最大5つの異なる時間枠のRSIを単一のチャートで同時に監視でき、ウィンドウを切り替える必要がありません。 カスタマイズ可能な時間枠: M1からMNまで、取引戦略に合わせて好みの時間枠を定義できます。 統一されたRSI期間: 選択したすべての時間枠で一貫したRSI計算期間を維持し、直接比較を可能にします。 明確な視覚表現: 複数の市場サイクルにおける買われすぎ/売られすぎの状況と勢いの変化を簡単に識別できます。 強化された意思決定: 時間枠間のダイバージェンスとコンバージェンスを発見し、市場トレンドに関するより深い洞察を提供します。 ユーザーフレンドリーなインター
SMC AI Pro: Smart Money Concepts Indicator with Multi-Timeframe Confluence and Trade Plan Dashboard Reading Smart Money Concepts by hand means judging structure, order blocks and gaps across several timeframes. SMC AI Pro does that work on your chart. It maps six core concepts, checks them against the next higher timeframe, and turns the result into a trade plan with a price for entry, stop loss and take profit. 2. WHAT THIS INDICATOR DOES SMC AI Pro detects and tracks six Smart Money Concepts
製品概要 Global Session Zones Systemは、 MT4およびMT5 プラットフォーム専用に設計されたチャート補助インジケーターです。目に見えない時間サイクルを直感的なチャート言語に変換し、世界の4大外国為替取引セッション(ニューヨーク、ロンドン、東京、シドニー)の背景ボックス、主要な価格帯、統計パネルを自動的に描画します。これにより、トレーダーは市場の変動範囲とトレンドの強さを正確に把握し、信頼性の高いブレイクアウトシグナルを得ることができます。 主要機能 4セッションの可視化 : 4つの主要セッションの開始/終了時間と色をカスタマイズして設定でき、長方形の背景ボックスで各セッションの範囲を直感的に表示します。 多面的なテクニカル分析 : セッション内の線形回帰トレンドライン、平均線、VWAP(出来高加重平均価格)、高値/安値の延長線をオプションで表示し、トレンドの方向性を判断するのに役立ちます。 リアルタイムステータスパネル : 右上に各セッションのアクティブ状態を表示し、高度なモードではトレンドの強さ(R²)、標準偏差(σ)などの定量的データを提供します。 イ
GoldPro Max
Taher Ahmed Mohamed Taha Elshafei
GOLDPRO MAX Advanced Multi-Timeframe and Smart Money Market Analysis for MetaTrader 5 GoldPro Max is a professional market analysis indicator for MetaTrader 5 designed to help traders study market direction, price structure, liquidity, market imbalance and potential trading areas from multiple perspectives. The indicator combines Multi-Timeframe Analysis, Smart Money Concepts, Market Structure, Liquidity Analysis, Order Blocks, Fair Value Gaps, Premium and Discount analysis, Smart Analytical Eng
RSI Currency Strength Meter is a powerful and elegant multi-currency indicator that measures the real-time relative strength of the 8 major currencies using RSI logic. By calculating the smoothed performance of each currency across its major pairs and applying the RSI formula, it delivers clean and responsive strength lines that make it easy to spot which currencies are truly strong or weak at any moment. This indicator is particularly useful for visualizing currency correlations and divergence
革新的な MT5 インジケーター、DARWIN Assistant   をご紹介します。これは、トレーディングを成功させる世界への究極のゲートウェイです。精度と専門知識に基づいて設計された DARWIN Assistant   は、RSI、ストキャスティクス、CCI、トレンドなどの高度なテクニカル指標をすべての時間枠にわたって活用する特別な戦略に基づいて動作します。この最先端のインジケーターはエントリーのための最も正確なシグナルを提供し、比類のない自信を持って市場をナビゲートできるようにするため、並外れた取引体験に備えてください。 DARWIN Assistant   を使用すると、最も収益性の高い取引機会を検出するために細心の注意を払って調整された、重要な指標の包括的な分析にアクセスできるようになります。不確実性に別れを告げ、情報に基づいた意思決定の新時代を迎えましょう。 RSI、ストキャスティクス、CCI、トレンドを DARWIN Assistant   内でシームレスに統合することでその力を解き放ち、これまでにないほど市場のダイナミクスを鮮明に描きます。 DARWIN As
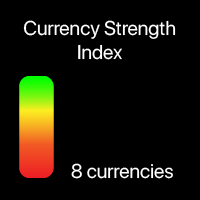
8つの主要通貨の現在の強さ 私の#1多機能ユーティリティ:  66以上の機能を含み、このインジケーターも含まれています  |   ご質問があればご連絡ください   |    MT4バージョン このインジケーターは別ウィンドウに表示され、チャートの任意の場所に移動可能です。 入力設定で   調整できる項目: インターフェーステーマ : ダーク / ホワイト; プレフィックスとサフィックス,  あなたのブローカーで通貨ペアにそれらが含まれている場合: (例: シンボルが"EURUSD .pro "の場合、" .pro "をサフィックスとして設定してください); パネルサイズ フォントサイズ 私の#1多機能ユーティリティ:  66以上の機能を含み、このインジケーターも含まれています  |   ご質問があればご連絡ください   |    MT4バージョン
OBX Gold Trader は、実行中のシンボルに基づいて取引アプローチを自動的に適応させるデュアルストラテジーのエキスパートアドバイザーです。 ゴールド(XAUUSD)に対しては、実績のあるオーダーブロック検出システムを使用します。出来高でフィルタリングされたブレイクアウト確認を伴う高モメンタムのインパルスキャンドルを識別し、機関投資家のオーダーブロックを特定します。取引は固定のストップロスとテイクプロフィットで管理され、目標の50%に達した時点で利益を確定する自動トレーリングストップが付いています。 EURUSD、GBPUSDなどのその他のシンボルには、MA25平均回帰戦略に切り替わります。価格が25期間移動平均から大きく乖離するのを待ち、その後極値で反転パターン(包み足またはピンバー)の形成を要求します。さらにリテストの確認が必要で、そのレベルがサポートまたはレジスタンスとして機能することを確認してからエントリーします。 主な特徴: - デュアルストラテジー:ゴールドにはオーダーブロック、Forexには平均回帰 - 自動シンボル検出(手動切り替え不要) - 高品質シグナ
Supply and Demand Monster
Tsog Erdene Borjigon Enkhkhudulmur
Supply and demand zones are at the heart of   supply and demand trading . These zones are areas that show  liquidity at a specific price.  The supply zone is also called the distribution zone, while the demand zone is called the accumulation zone.   Our indicator automatically draw supply and demand zones in Metatrader 5. It give opportunity to understand trading zone and avoiding risk.
Tiger Lite recreate the history of entry and exit orders. The goal is that you can grasp their strategy how to play. CSV format support for WEB, MT4 and MT5 platforms. The sequence of steps is described in the photo. Note: Please choose the existing date and symbol on the CSV file. For MT4/5, export historical data and copy the records to excel, save it with the extension CSV. For MT4/MT5/WEB, save the name with format mt4.csv/mt5.csv/web.csv If you get the history from another source and your
FREE
Gold Phantom Pro 特別導入レンタル価格:$300 期間限定で、特別な導入レンタルオファーとして Gold Phantom Proをわずか$300 でご利用いただけます。 $300の導入レンタル価格は1か月間のみ有効です。 導入期間終了後、レンタルオファーは終了し、通常の固定価格は$1,199となります。 推奨時間足:Gold M30(30分足)のみ Gold Phantom Pro MetaTrader 5向け 高度なローソク足パターン取引 Expert Advisor Gold Phantom Pro は、複数の ローソク足の反転およびトレンド継続パターン を使用して、潜在的な取引機会を識別するよう設計されたMetaTrader 5用の自動売買Expert Advisorです。 EAは確定したローソク足を分析し、市場の主要なトレンドを評価し、価格アクションの形成パターンを検出します。そして、有効なシグナルが確認されると自動的に BUYまたはSELL 取引を実行します。 リスクベースのロット計算、ATRベースのStop Loss/Take Profit、固定SL/TP、
Jericho Gold Jericho Gold is a MetaTrader 5 indicator for support and resistance analysis and visual trade planning on XAUUSD. It displays price zones, buy and sell signals, and take-profit and stop-loss areas directly on the chart. The recommended chart timeframe is one minute. Main features Active support and resistance zones that extend to the right. Buy and sell signals with transparent target and stop areas. Completed trade-plan boxes drawn from simulated entry to exit. Separate trend, exha
このプロダクトを購入した人は以下も購入しています
Boba Analysis Suite
Trade Ready Solutions LLC
5 (1)
Boba Analysis Suite Boba Analysis Suite は、MetaTrader 5 向けの分析インジケーターです。市場構造、重要な価格帯、相場全体の状況を、一つのチャート画面にまとめて表示します。 トレーダーおよびトレーディング指導者としての実務経験をもとに開発され、市場の方向性の評価、重要な価格水準の特定、複数の時間足を組み合わせた分析など、体系的な分析プロセスを支援します。 相場の背景を踏まえた分析 個々のシグナルの意味は、相場の状況によって変わります。Boba Analysis Suite は、現在のチャート状況をより大きな市場構造と関連付け、あらかじめ定めたルールに沿って取引アイデアを検討するための分析を支援します。 主な分析機能: トレンドと市場構造: 市場の方向性と、その背景にある構造を評価します。 重要な価格帯と価格水準: さらに分析すべき重要な領域を視覚的に表示します。 複数の時間足: 異なる時間足の情報を組み合わせ、相場全体の状況を評価します。 視覚的な分析プロセス: 分析情報をチャート上で直接確認できます。 自主的な取引判断を支援 Boba
ARIPoint
Temirlan Kdyrkhan
1 (4)
ARIPoint is a powerful trading companion designed to generate high-probability entry signals with dynamic TP/SL/DP levels based on volatility. Built-in performance tracking shows win/loss stats, PP1/PP2 hits, and success rates all updated live. Key Features: Buy/Sell signals with adaptive volatility bands Real-time TP/SL/DP levels based on ATR Built-in MA Filter with optional ATR/StdDev volatility Performance stats panel (Success, Profit/Loss, PP1/PP2) Alerts via popup, sound, push, or email Cu
UZFX {SSS} スキャルピング・スマートシグナル v5.0 MT5は、変動の激しい市場において正確かつリアルタイムのシグナルを求めるスキャルパー、デイトレーダー、スイングトレーダー向けに設計された、リペイントのない高性能な取引インジケーターです。(UZFX-LABS)によって開発されたこのインジケーターは、価格行動分析、トレンド確認、スマートフィルタリングを組み合わせることで、すべての通貨ペアおよび時間枠において、高確率の売買シグナル、警告シグナル、トレンド継続の機会を生成します。 トレードの判断に迷うのはもうやめましょう。明確さ、正確さ、そして規律ある市場執行を求めるトレーダーのために設計された、体系的なシグナルシステムに従い始めましょう。 間違いなく、MQL5で入手可能な最高のインジケーターの一つです。絶対に見逃さないでください!!「スマートなトレーダーのためのスマートシグナル」 最新バージョン5.0がリリースされました。価格は予告なく最大499.99ドルまで値上がりする可能性がありますので、チャンスを逃さないようお早めにお求めください!! 購入を決める前に!無料トライアル
AriFocus - Non-Repainting Buy/Sell Signals AriFocus - one clear signal. AriFocus marks buy and sell signals directly on the chart and suggests a stop-loss level for each one. Every signal is confirmed on bar close and never repaints. - Buy/sell arrows, confirmed on bar close - Suggested stop-loss level for every signal - Trend band and candle coloring to show direction at a glance - 10 ready-made presets, or your own settings (14 calculation methods) - Pop-up, push and email alerts with entr
Azimuth Pro
Ottaviano De Cicco
5 (7)
Azimuth Pro V2:MT5向けシンセティック・フラクタル構造分析と確認済みエントリー 概要 Azimuth Pro は Merkava Labs によるマルチレベルスイング構造インジケーターです。4つのネストされたスイングレイヤー、スイングアンカーVWAP、ABCパターン検出、3タイムフレーム構造フィルタリング、そして確定バーでの確認済みエントリー — 1つのチャートで、ミクロスイングからマクロサイクルまでを網羅するワークフロー。 これはブラインドシグナル製品ではありません。ロケーション、コンテキスト、タイミングを重視するトレーダーのための構造ファーストワークフローです。 ハロウィンプロモーション — 35%オフ 相場が不気味に揺れても、あなたの優位性は鋭いまま。このオファーが霧の中に消える前に、35%オフで手に入れよう。 Azimuth Proが現在259 USD(通常399 USD)。 1. V2での変更点 シンセティック・マルチタイムフレームエンジン 上位タイムフレーム分析をMeridian Proと同じ独自のシンセティックアーキテクチャで一から再構築。より
OrderFlow Absorption – MT5用プロフェッショナル・デルタ&アブソープションシグナルインジケーター OrderFlow Absorptionで本物のオーダーフロー分析の力を解き放ちましょう。MetaTrader 5向けの究極のデルタヒストグラム&アブソープションシグナルインジケーターです。あらゆる価格変動の裏側で何が起きているのかを知りたいトレーダーのために設計されており、市場を動かす隠れた買い/売り圧力や吸収イベントを明らかにします。 特徴 デルタヒストグラムの可視化:   買い圧力・売り圧力を色分けされたヒストグラムで即座に表示。 アブソープションシグナル検出:   高度なロジックで強気・弱気の吸収イベントを特定し、反転の兆しを早期に通知。 チャートマーカー:   吸収シグナルをチャート上に直接マークし、視覚的に分かりやすく表示。 ポップアップアラート:   新しい吸収シグナルが出現した際にリアルタイムで通知。 カスタマイズ可能な閾値:   弱いシグナルを除外し、高確率のセットアップに集中。 リソース管理:   大きなチャートでも高速に動作する効率的な計算。
ARICoin is a powerful trading companion designed to generate high-probability entry signals with dynamic TP/SL/DP levels based on volatility. Built-in performance tracking shows win/loss stats, PP1/PP2 hits, and success rates all updated live. Key Features: Buy/Sell signals with adaptive volatility bands Real-time TP/SL/DP levels based on ATR Built-in MA Filter with optional ATR/StdDev volatility Performance stats panel (Success, Profit/Loss, PP1/PP2) Alerts via popup, sound, push, or email Cust
• G signals are counter-move entries taken after an extended move. • E signals are entries in the direction of the prevailing trend. • Signals appear only after the candle has closed. A signal that is displayed will not disappear or move. 1. Entering a Trade Wait for the signal candle to close. Enter at the open of the next candle, or at the close of the signal candle if your platform allows it. Take only the signal types you have chosen to trade. Treat G and E as separate strategies with sepa
GEM Signal Pro GEM Signal Pro は、MetaTrader 5 向けのトレンドフォロー型インジケーターです。より明確なシグナル、より整理されたトレードセットアップ、そして実用的なリスク管理をチャート上で確認したいトレーダーのために設計されています。 単純な矢印だけを表示するのではなく、GEM Signal Pro はトレード全体の考え方を、より見やすく分かりやすい形で表示します。条件が確認されると、インジケーターはエントリー価格、ストップロス、利確目標をチャート上に表示し、トレードセットアップをより効率的に確認できるようにします。 動作の仕組み このインジケーターは、まず内部ロジックに基づいて有効なシードシグナルを検出します。 確認条件が満たされると、GEM Signal Pro はチャート上に完全なセットアップを表示します。これにより、トレーダーはトレード構造をより明確に把握し、手作業による分析を減らすことができます。 チャート上のトレードレベル 確認済みシグナルに対して、GEM Signal Pro は以下を表示できます。 エントリー価格 ストップロス テ
以下は Chimera Volume の日本語訳です。 MetaTrader 5用 Chimera Volume 高度な出来高分析と市場活動の可視化 Chimera Volumeは、MetaTrader 5向けに設計されたカスタムインジケーターです。正規化された出来高の動きを分析し、動的な視覚的フレームワークを通じて市場参加者の変化をリアルタイムで表示します。 このインジケーターは、適応型正規化アルゴリズムを用いてティック出来高データを処理し、出来高の強さ、蓄積フェーズ、および異なる市場条件下での活動シフトを構造化して表現します。 生の出来高を表示する標準的なインジケーターとは異なり、Chimera Volumeは追加の計算を適用することで、市場活動の相対的な変化を強調し、チャートの視認性を向上させます。 主な機能 ルート・インテント・ヒストグラム (Root Intent Histogram): 正規化された出来高の強さと市場参加度を視覚化する動的ヒストグラムです。適応型カラー・トランジションを採用しており、活動の活発化と参加の減少を明確に区別します。 慣性ライン (Inertia
MERAVITH SCANNERは、MetaTrader 5用のプロフェッショナルな金融市場インジケーターで、複数の分析ツールを一つの統合システムにまとめています。独自の出来高加重平均価格(VWAP)手法を使用してすべての計算を自動で行い、主観的な解釈を完全に排除します。 このインジケーターは、すべての資産クラス(FX、株式、指数、商品、暗号通貨)およびM1から月足までのすべての時間軸で動作します。基本原理は「価格は出来高に従う」というものです。MERAVITHは機関投資家の出来高が集中するポイントを特定し、その集中から数学的に正確な価格レベルを導き出します。予測や投機は行わず、計算のみを行います。 MERAVITH SCANNERを使用すると、28の主要FX通貨ペアをすべての時間軸でわずか2~3分でスキャンできます。また、任意の市場をスキャンすることも可能です。例えば、約100銘柄の株式を約10分でスキャンできます。 インジケーターは、消耗レベル、均衡線、偏差、統計レベル、およびターゲット予測を算出します。 チャート要素 Origin Point :すべての計算が始まる起点です。イン
note: this indicator is for METATRADER4, if you want the version for METATRADER5 this is the link:  https://www.mql5.com/it/market/product/108106 TRENDMAESTRO ver 2.5 TRENDMAESTRO recognizes a new TREND from the start, he never makes mistakes. The certainty of identifying a new TREND is priceless. DESCRIPTION TRENDMAESTRO identifies a new TREND in the bud, this indicator examines the volatility, volumes and momentum to identify the moment in which there is an explosion of one or more of these da
MERAVITH は MetaTrader 5 向けのマルチタイムフレームの出来高・流動性インジケーターで、すべての時間足でトレンド、サポートとレジスタンスのゾーン、エントリー、ターゲット、ストップロスを表示します。市場の完全な流動性マップ、ヘッジファンド流の流動性ツールを提供し、独自の出来高加重平均価格の手法ですべての計算を自動で行うため、主観的な解釈はありません。 FX、ゴールド(XAUUSD)、指数、仮想通貨に対応し、すべての時間足で機能します。 購入後の特典:MERAVITH での取引方法を解説した動画レッスン集。購入後にメッセージをお送りください。 MERAVITH の機能 すべての時間足を分析し、それぞれで有効なトレンドを表示します。 流動性ゾーン(Volume Equilibrium)を示します。強気と弱気の出来高が等しくなる場所です。 すべての時間足の流動性レベルをチャート上に直接表示します。 参考用に市場のテキスト分析を書き出します。 現在のトレンドからエントリー、ターゲット、サポートレベル、ストップロスを計算します。 取引のリスクリワード比を計算します。 口座残高に
Cycles Plotter 移動平均と開始日を備えたカスタマイズ可能なサイクルインジケーター Cycles Plotter は、ユーザー入力のみに基づいて、完全にカスタマイズ可能な2つの正弦波サイクルを描画する高度なテクニカルインジケーターです。サイクルを自動生成しません。すべてのサイクルは、ユーザーが設定したパラメーターのみに基づいて計算され、価格の振動と潜在的なトレンド変化を研究するための視覚的ツールをトレーダーに提供し、自動シグナルや予測は生成しません。 重要なポイント: ユーザー定義のサイクル: サイクル 1 P1 と 2 P2 はユーザーが完全に設定できます。サイクルの長さ、振幅、移動平均、正確な開始日と時刻を設定できます。ユーザーがパラメーターを入力しない場合、サイクルは描画されません。 振幅の制御: 各サイクルは異なる振幅を持つことができ、基準となる移動平均に対して振動の高さを調整できます。 トレンド検出: 高速および低速移動平均はサイクルの方向を示します: Fast MA が Slow MA より大きい 上昇フェーズ 緑 lime Fast MA が Slow MA
AriX
Temirlan Kdyrkhan
1 (4)
AriX Indicator for MT5 A powerful trend-following and signal-evaluation tool AriX is a custom MT5 indicator that combines Moving Averages and ATR-based risk/reward logic to generate clear buy/sell signals. It visualizes dynamic SL/TP levels, evaluates past trade outcomes, and displays win/loss statistics in a clean on-chart panel. Key features include: Buy/Sell signals based on MA crossovers ATR-based SL/TP1/TP2/TP3 levels with visual lines and labels Signal outcome tracking with real-time stat
相場が本当は何をしているのかを見抜く。   3つの市場フェーズ(収縮・拡張・トレンド)を目の前でライブに捉え、トレンド・フェーズの初期段階でより優れたエントリーを取りましょう   。      当て推量はもう終わり。機関投資家やスマートマネーのように相場を読み始めましょう。   Apex Market Structure Pro(MT5版)は、ノイズを取り除き、あらゆるローソク足の下にある真の構造を見せる高精度のスマートマネー分析ツ   ールです。流動性、構造転換、蓄積ゾーン、トレンドバイアスを、ひとつのクリーンでプロフェッショナルなオーバーレイに集約します。遅行   指標に見切りをつけ、明晰さをもってトレードする準備のできた本気のトレーダーのために作られました。   重要:本インジケーターは Heikin Ashi(平均足)ローソク足での動作を前提に設計されています。使用前にチャートを Heikin Ashi   に設定し、その真価を解き放ってください。分析のすべては Heikin Ashi の価格の流れを軸に構築されています。Apex Market Structure Pr
Title:FX-AIEA Supply and Demand Zone Indicator (MT5) — Technical Overview Version: 2.51 | Platform: MetaTrader 5 Introduction Supply and demand zones are considered a core manifestation of institutional order flow, providing a more direct reflection of buying and selling pressure than traditional support/resistance levels. This indicator attempts to automate the identification of high-probability supply and demand zones using an adaptive ZigZag algorithm, reducing the subjectivity and time asso
ORB Seeker MT5
Marcela Goncalves De Oliveira
数量限定で特別価格!希少性を維持するための特別価格です! たったの599ドル! ご購入後、ボーナスとしてORB Seeker EAと個人最適化セットファイルをお受け取りいただくため、私にご連絡ください。 クリーンなセッションブレイクアウトを自信を持ってキャッチしましょう! ORB Seeker MT5は、正確性、シンプルさ、柔軟性、そして明確なチャート構造を求めるトレーダー向けに開発された、プロ仕様のオープニングレンジブレイクアウト(ORB)インジケーターです。 このシステムは、あらゆる銘柄のプレマーケットまたはカスタムセッションのレンジを自動的にプロットし、エントリー、ストップロス、テイクプロフィット、およびオプションの50%部分TPレベルを含む明確なブレイクアウトシグナルを提供します。すべての計算結果はリアルタイムでチャート上に表示されます。 ロンドンオープン、ニューヨークセッション、アジアセッション、または独自のカスタム市場時間帯で取引できます。ORB Seeker MT5は選択したセッション時間帯に合わせて調整されるため、市場レンジ、ブレイクアウトレベル、トレードレベルの位
Volume Arrow Signal Product Description Volume Arrow Signal is a smart trading indicator designed to help traders identify potential buy and sell opportunities using price action, volume behavior, and directional arrow signals. The indicator places clear arrows directly on the chart, making it easy to spot possible market reversals, trend continuations, and entry opportunities without spending hours analyzing charts manually. Whether you are trading Gold (XAUUSD) , Forex pairs, Indices, or Crypt
MATADOR GOLD XAUUSD M5 Scalp Signals for MT5 MATADOR GOLD is a decision-support indicator for MetaTrader 5, designed for traders who analyze short-term Gold movement on the M5 timeframe. The indicator does not open, close, or manage trades automatically. It provides buy and sell signal guidance so the user can make their own trading decisions according to their risk plan, broker conditions, and trade management rules. Main purpose MATADOR GOLD is built to help traders avoid noisy signal flow and
Footprint は、オーダーフロー(Order Flow)と出来高分析のためのインジケーターです。 クラスターレベルでの市場構造の特定、アクティビティの高い主要ゾーンの発見、そして設定ウィンドウを毎回開くことなくチャート上で直接フィルター操作を行うのに役立ちます。 Footprintインジケーターの機能 Bid x Ask、Deltaのクラスターチャート; チャート上のコントロールパネル; フィルター調整用のスライダー; Absorption; Initiative; Stacked Imbalances; Big Trades; dPOC / Dynamic Point of Control; Delta; サイドマーケットプロファイル; 累積デルタ(Cumulative Delta)。 主な利点 高密度のティックフローに対する高速な計算とデータ表示; チャート内管理 — 設定を開くことなく、主要モードとフィルターを直接切り替え可能; 重要な価格レベルとクラスターを強調するためのフィルタリング; シグナルの視覚的ハイライト:吸収、主導権、インバランス、大口取引; 日、週、または現
Zain Gold ScalpingV5
Ahmed Gamal Abdel Nasser Mohamed
Zain Gold Scalping V5 is a technical analysis indicator for MetaTrader 5 designed for Forex and Gold markets. It provides chart-based market information, trend analysis, signal conditions, and an on-screen dashboard to help traders analyze price movement across multiple timeframes. Main Features The indicator supports multiple timeframes, including M1, M5, M15, M30, H1 and higher timeframes. It can be used with Gold (XAUUSD), Forex currency pairs, indices and other supported instruments. The in
Quantum Momentum Guard (QMG) Advanced Breakout & Momentum Indicator for MetaTrader 5 Quantum Momentum Guard (QMG) is a next-generation MetaTrader 5 trading indicator designed to identify high-probability breakout opportunities using a powerful combination of advanced momentum analysis and high-level mathematical calculations . Unlike ordinary indicators that generate signals based on a single condition, QMG confirms every breakout with momentum strength and mathematical validation , ensuring
KenKem Master Volume Profiler - Brief Introduction A Display-only volume-profile cockpit for XAUUSD, BTCUSD and other liquid symbols. Draws profile structure, multi-timeframe flow, EMA trend and study-only setup markers. Places no orders. Not a signal service.  It maps where the market has actually traded and reads recent order flow, so you can see structure and lean at a glance.  What it shows: Master and local volume profiles (POC and value-area high/low) - the price shelves that matter. A liv
VTrende Pro
Andrii Diachenko
5 (1)
VTrende Pro - MTF indicator for trend trading with a display panel for MT5 *** Videos can be translated into any language using subtitles (video language - Russian) Although the signals of the VTrende Pro indicator can be used as signals of a full-fledged trading system, it is recommended to use them in conjunction with the Bill Williams TS. VTrende Pro is an extended version of the VTrende indicator. Difference between Pro version and VTrende: - Time zones - Signal V - signal 1-2 waves -    S
First time on MetaTrader, introducing IQ Star Lines, an original Vedic Astrology Based Intraday Trading Indicator. We don't offer free or bonus indicators in exchange of reviews from you. You won't need any free products with this indicator to make it work. ;) Enjoy! Welcome to the new and updated  IQ Star Lines , the ultimate fusion of ancient planetary cycles and modern quantitative trading, published for the first time on Metatrader. This is an indicator built by the developer, who has spent
Navigator Equilibrium:市場のフェーズ、モメンタム、ピーク、ダイバージェンスをひとつのウィンドウで モメンタム・オシレーター、トレンドフィルター、ボラティリティ指標、ダイバージェンス・スキャナーを行き来する必要はもうありません。Navigator Equilibrium は、それらを色分けされたひとつのウィンドウにまとめました。モメンタムが強まっているのか弱まっているのか、どちらが主導権を握っているのか、相場がトレンド中なのか持ち合いなのか、そして価格とモメンタムがどこで食い違っているのかが、ひと目でわかります。 相場を明確に読み取りたい裁量トレーダーにも、整理されたドキュメント付きのバッファを必要とする EA 開発者にも向いています。 他との違い 上昇・下落だけではない、5つの状態を持つヒストグラム。 方向に加えて、モメンタムが強まっているのか、弱まっているのか、ピーク状態まで伸びきっているのかを色で示します。 相場環境を示すゼロライン。 色が変わり、相場がトレンド中か持ち合い中かを教えてくれます。 「誰が主導権を握っているか」がひと目でわかる。 ヒストグラムの棒
Boom & Crash & PainX & GainX Ultimate Spike Detector Trade Spikes With Confidence — Not Guesswork Catching spikes should be one of the most profitable strategies in synthetic markets. But for most traders, it becomes one of the most frustrating. You enter too early… price goes against you. You wait for a spike… it never comes. You finally catch one… but don’t know whether to hold or close. You make profit… then give it all back because there’s no exit plan. This is exactly the problem the Ultim
Historical Similarity Matcher Indicator (HI.SI.MA) Try it free today — demo version now available!   https://www.mql5.com/en/market/product/167114 Overview The Historical Similarity Matcher is a technical analysis indicator for MetaTrader 5. It scans historical price data to find segments that show statistical similarity to a user-selected reference period on the chart.
フィルタ:
レビューなし
レビューに返信