Lowess Channel MT5
- インディケータ
- バージョン: 1.1
- アップデート済み: 9 4月 2025

Overview
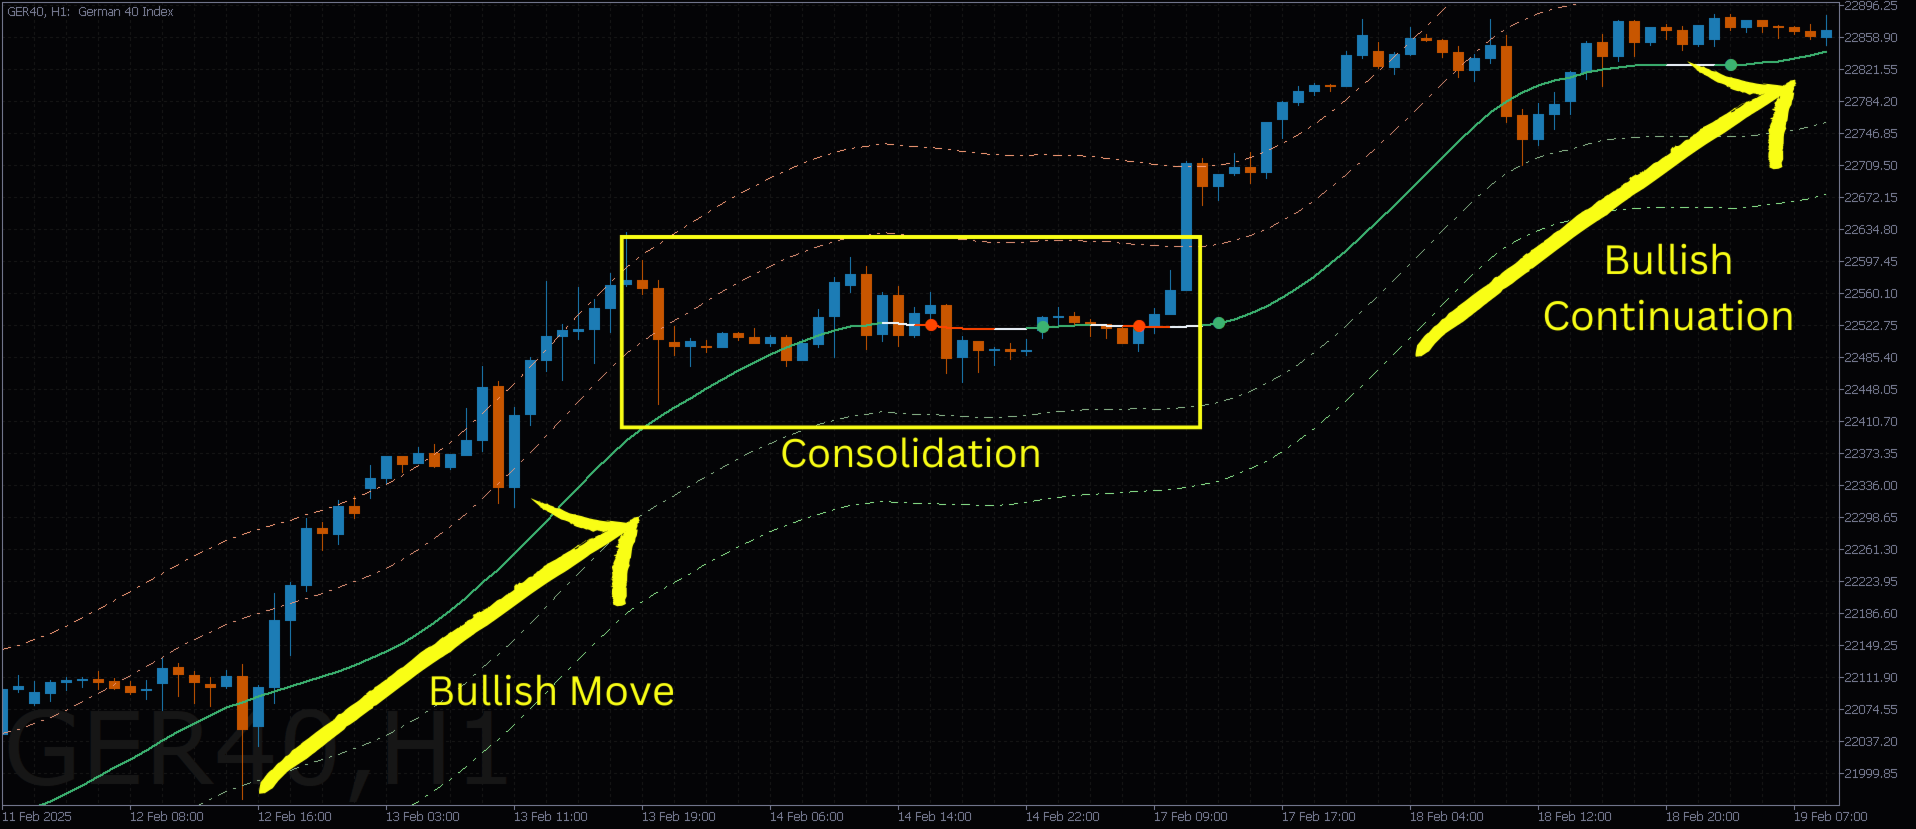
The Lowess Channel indicator is a smoothed trend-following tool designed to help traders identify the direction of the trend, detect flat or ranging markets, and spot breakouts from consolidation zones. It creates a central smoothed line with upper and lower channel boundaries, adapting to market noise while maintaining clarity.
How It Works
- The indicator builds a channel around a smoothed price line.
- The central line reflects the current trend.
- The upper and lower boundaries form a dynamic range or envelope.
- These bands expand and contract based on recent price behavior and bandwidth settings.
How to Use the Indicator
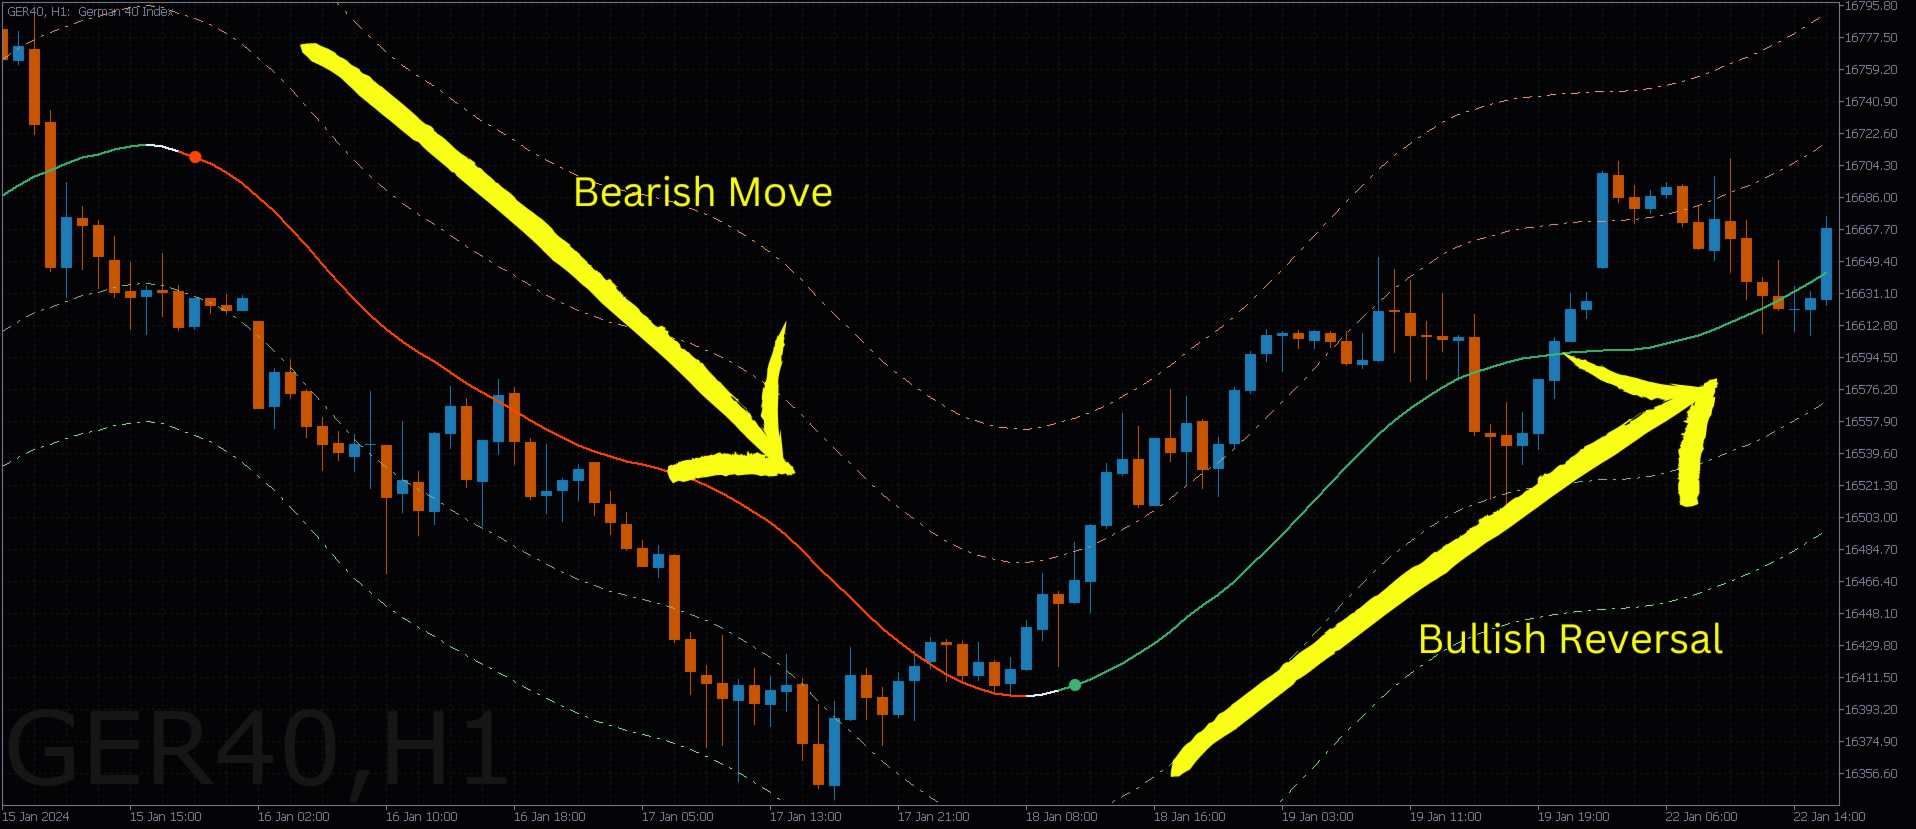
1. Identifying Trend Direction
- Uptrend: Price consistently stays above the central line and moves along the upper band.
- Downtrend: Price stays below the central line and follows the lower band.
- Neutral/Flat: Price oscillates between the bands with minimal slope in the central line.
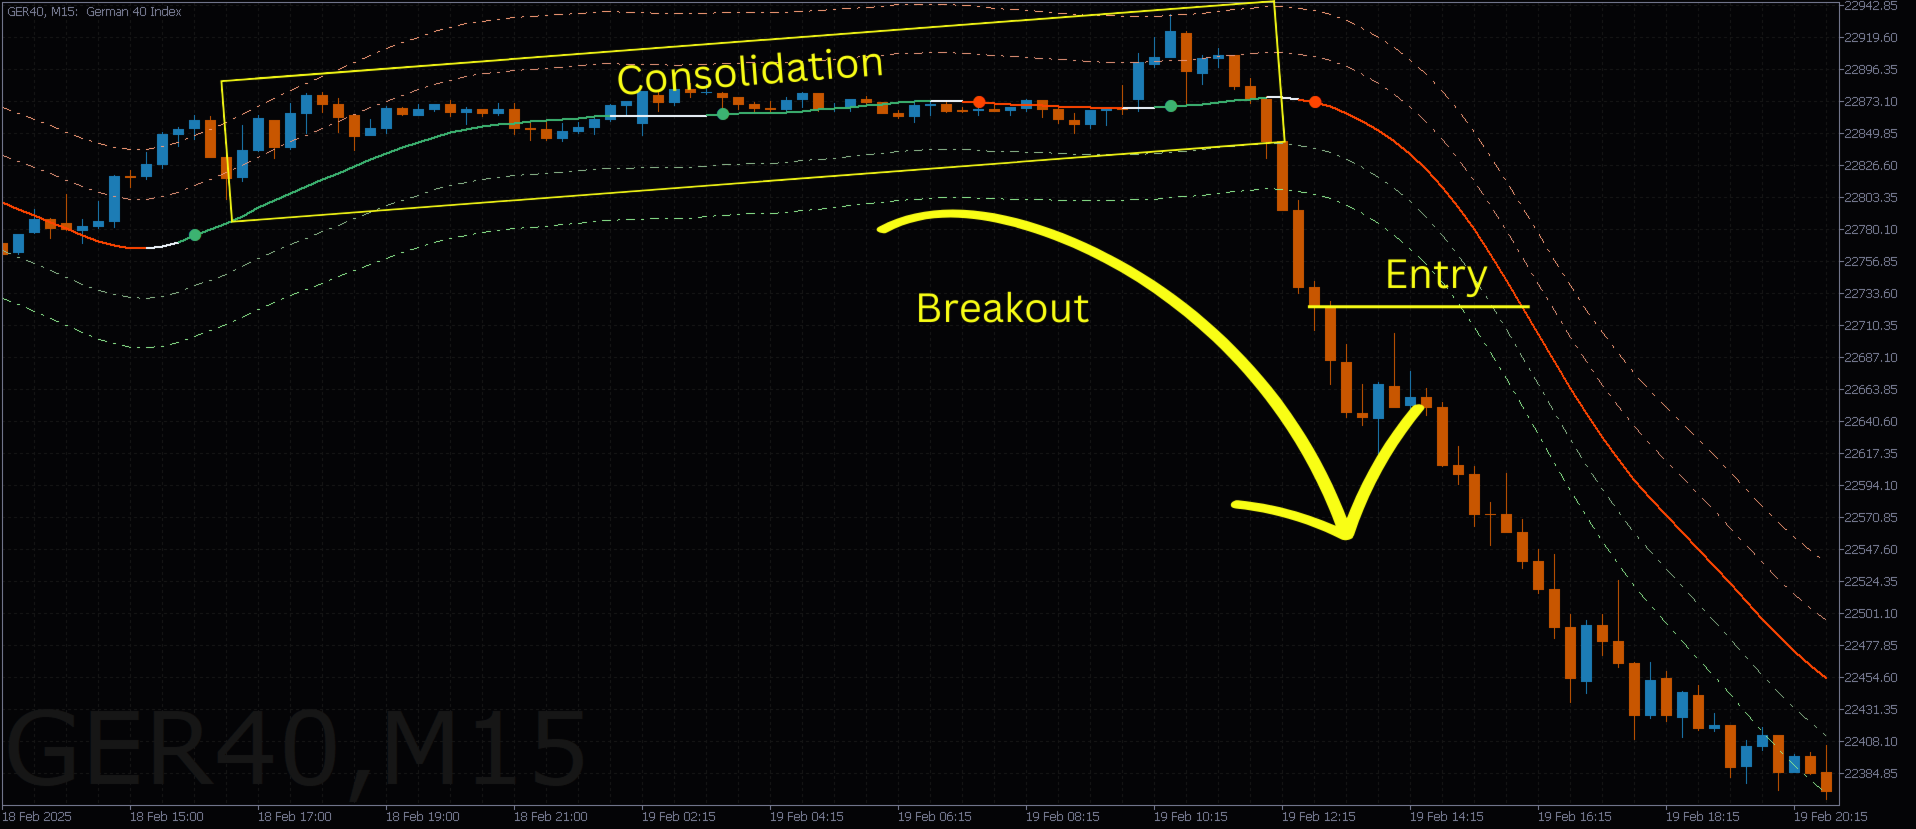
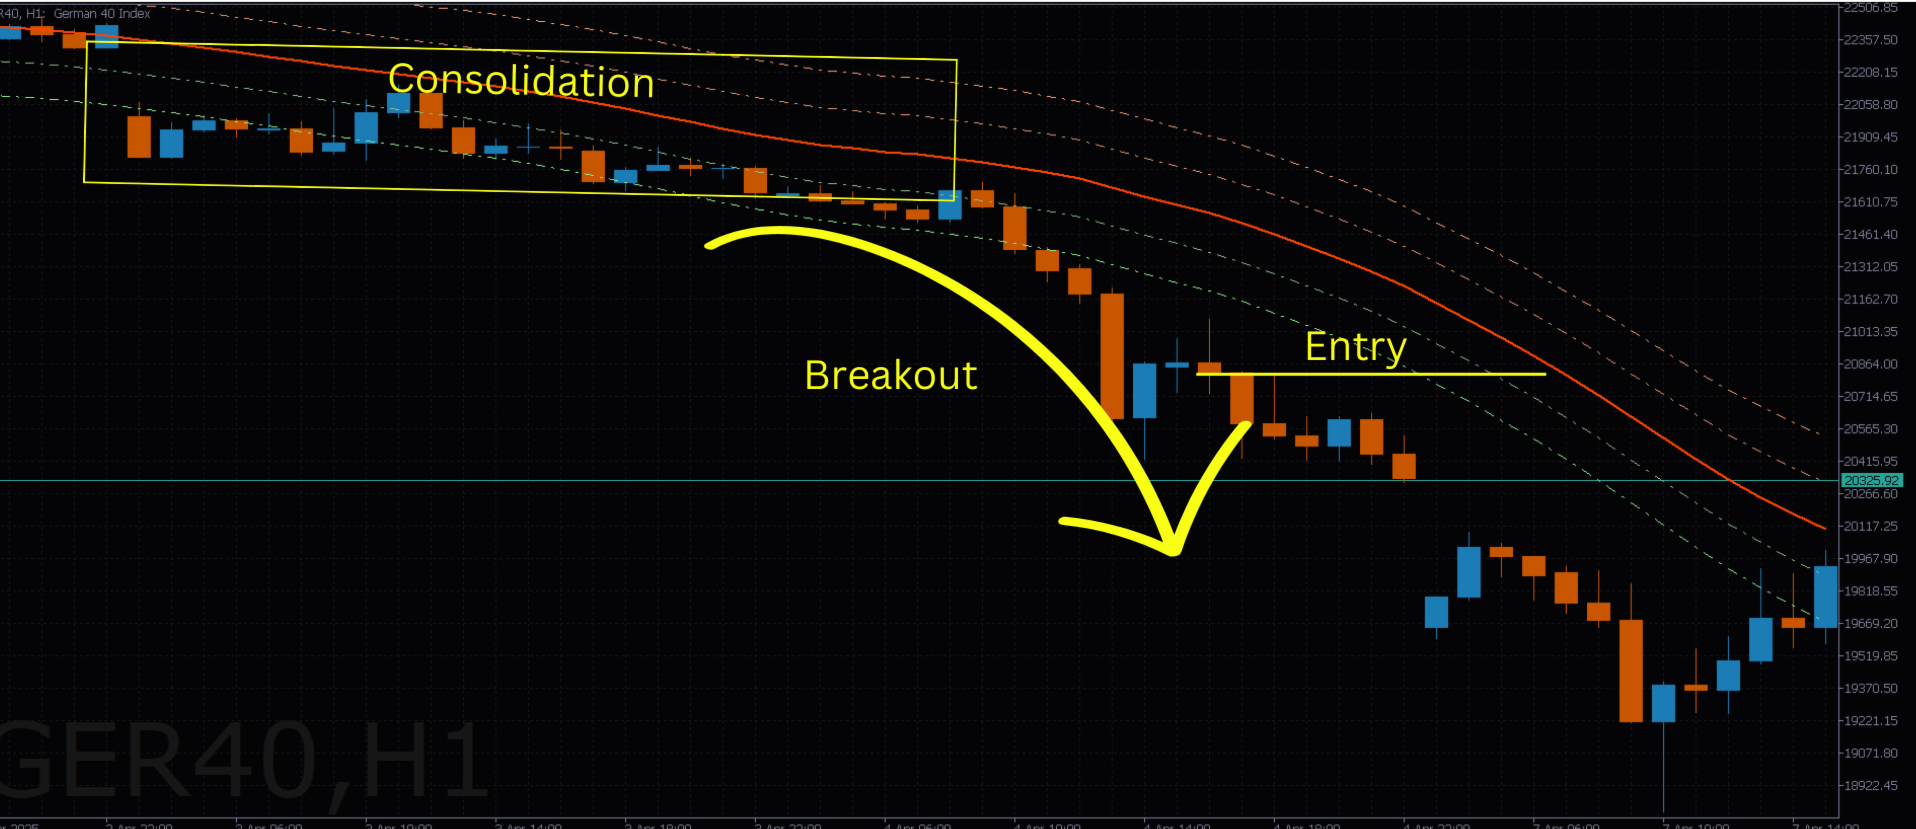
2. Spotting Breakouts
- A breakout above the upper band may signal bullish continuation or start of an uptrend.
- A breakout below the lower band may signal bearish continuation or start of a downtrend.
- Use volume or confirmation candles to validate breakouts.
3. Flat Market Detection
- When the central line is mostly flat and price remains inside the bands, the market is ranging.
- Traders may wait for a breakout from this range to enter a position in the direction of the breakout.
Alert System
Notification Options
- Enable alerts through:
- On-screen messages
- Email notifications
- Push notifications
Alert Conditions
- Bullish Alerts: Trigger when price breaks above the upper channel, suggesting bullish momentum.
- Bearish Alerts: Trigger when price breaks below the lower channel, indicating bearish momentum.
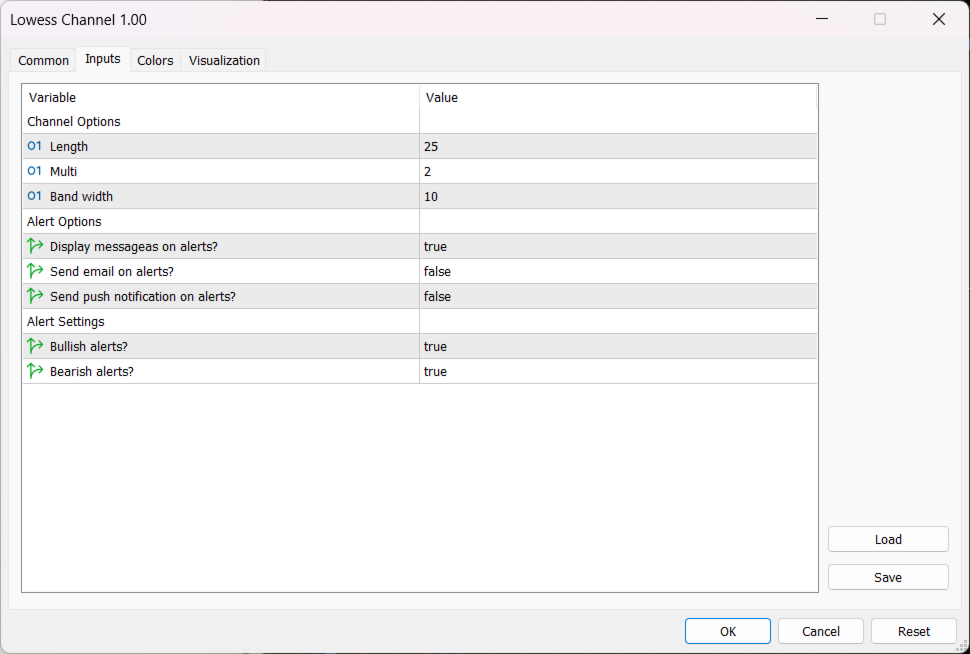
Customization Options
- Channel Length: Adjusts the smoothness of the central trend line.
- Multiplier: Controls the distance of the upper and lower bands from the center.
- Bandwidth: Expands or contracts the overall channel width to accommodate different market conditions.