TTM Squeeze MT4
- インディケータ
- バージョン: 1.0

Overview
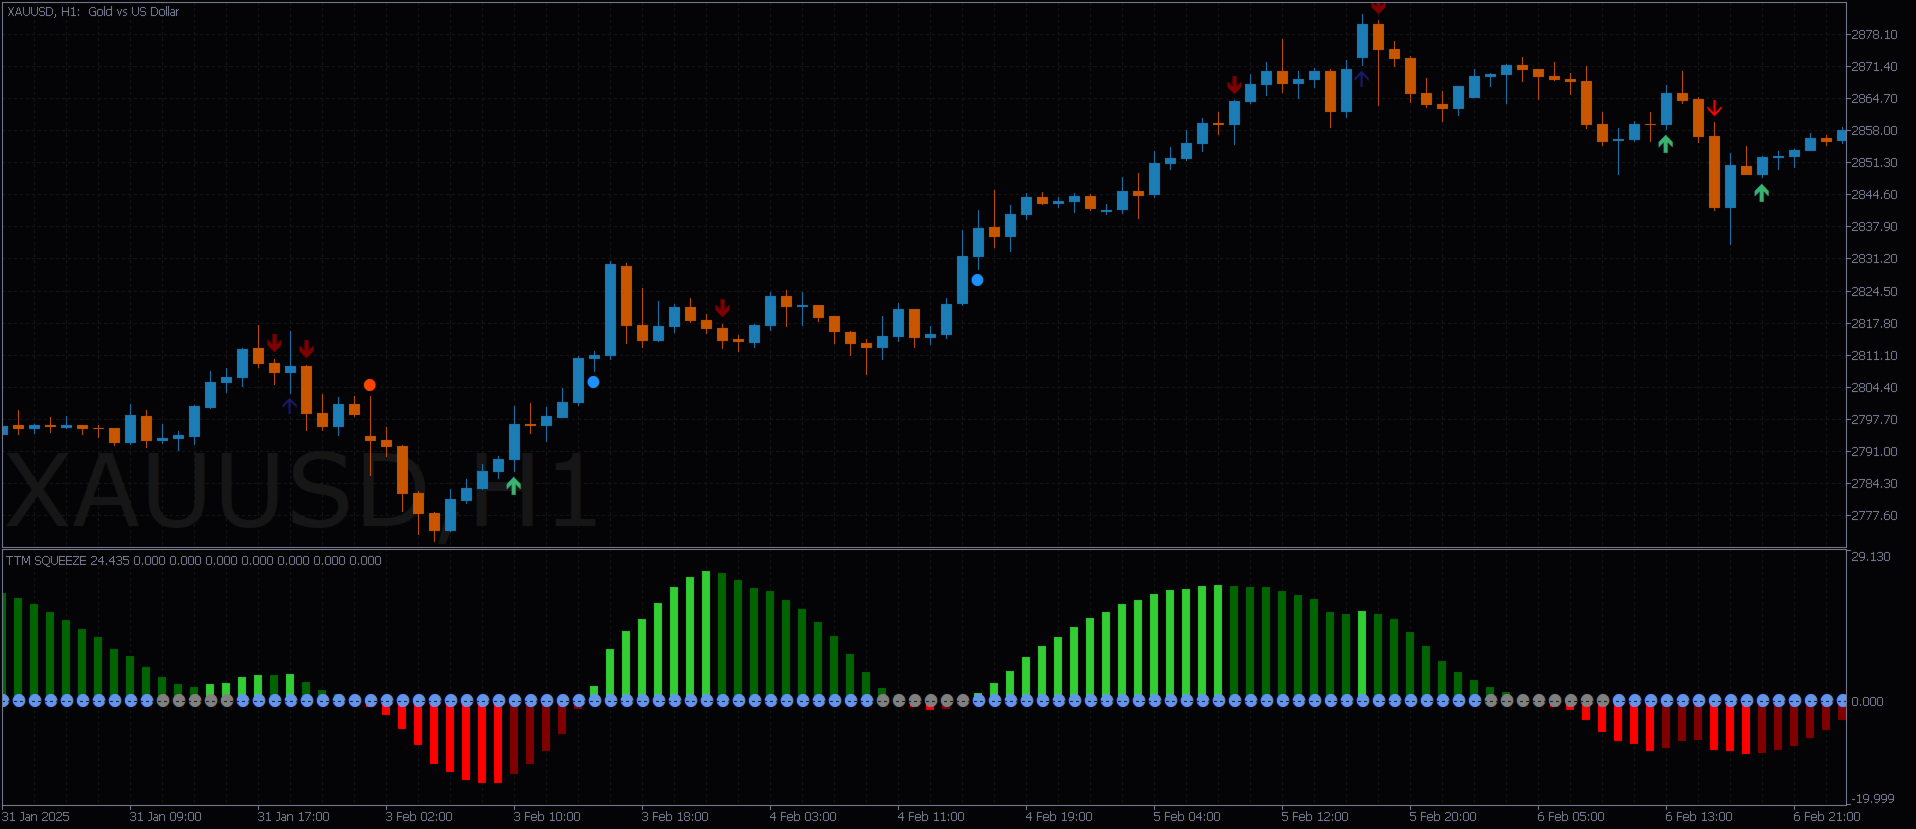
The TTM Squeeze indicator helps identify low volatility periods (squeeze) that often precede price breakouts. It uses Bollinger Bands (BB) and Keltner Channels (KC) to determine when the market is "coiling" and ready to move.
Configuration Guide
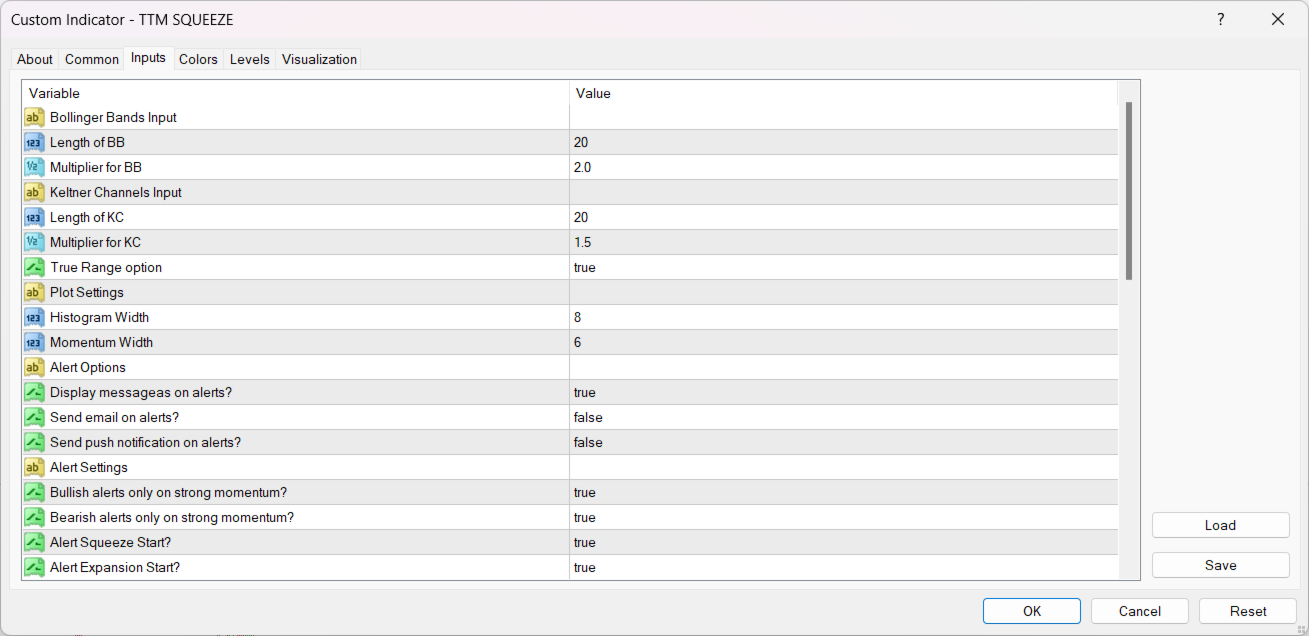
Volatility Settings
- The indicator uses Bollinger Bands to measure market volatility.
- When BBs are inside Keltner Channels, a squeeze is detected.
- The squeeze suggests the market is consolidating and may soon break out.
True Range Option
- Optionally use True Range instead of Average True Range for more sensitive KC calculations.
Visual Display Settings
- The histogram represents market momentum and shows the strength/direction of moves.
- A momentum line is displayed over the histogram to track trend changes.
- Widths of both histogram and momentum line can be adjusted for visual clarity.
Alert System
Notification Options
- Choose to receive alerts via on-screen messages, email, or push notifications.
- All notification types can be toggled on or off independently.
Squeeze Phase Alerts
- Enable alerts when a squeeze starts (BB moves inside KC).
- Enable alerts when the squeeze ends and expansion begins (BB moves outside KC).
Momentum Filters
- Apply filters to only receive bullish alerts when momentum is strong.
- Similarly, limit bearish alerts to periods with strong downward momentum.
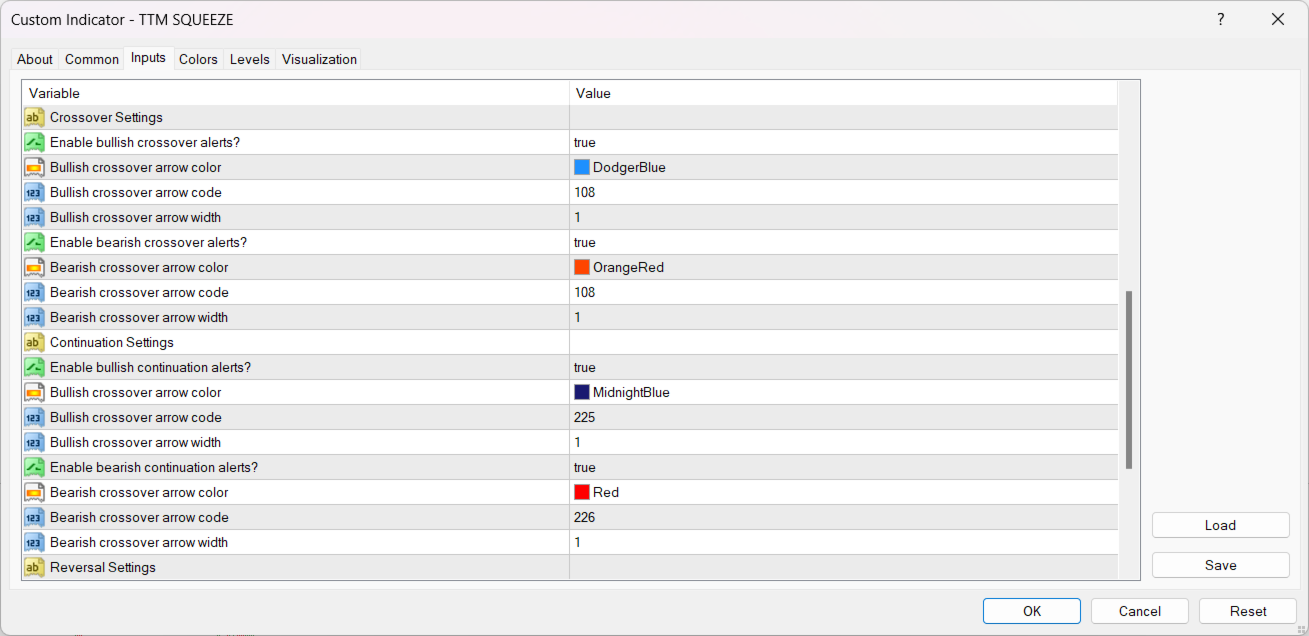
Signal Types and Visual Cues
Crossover Signals
- Bullish crossover signals indicate potential upward momentum shifts.
- These are marked with arrows in a specific color, style, and size.
- Bearish crossover signals suggest a shift to downward momentum.
- These are also marked distinctly.
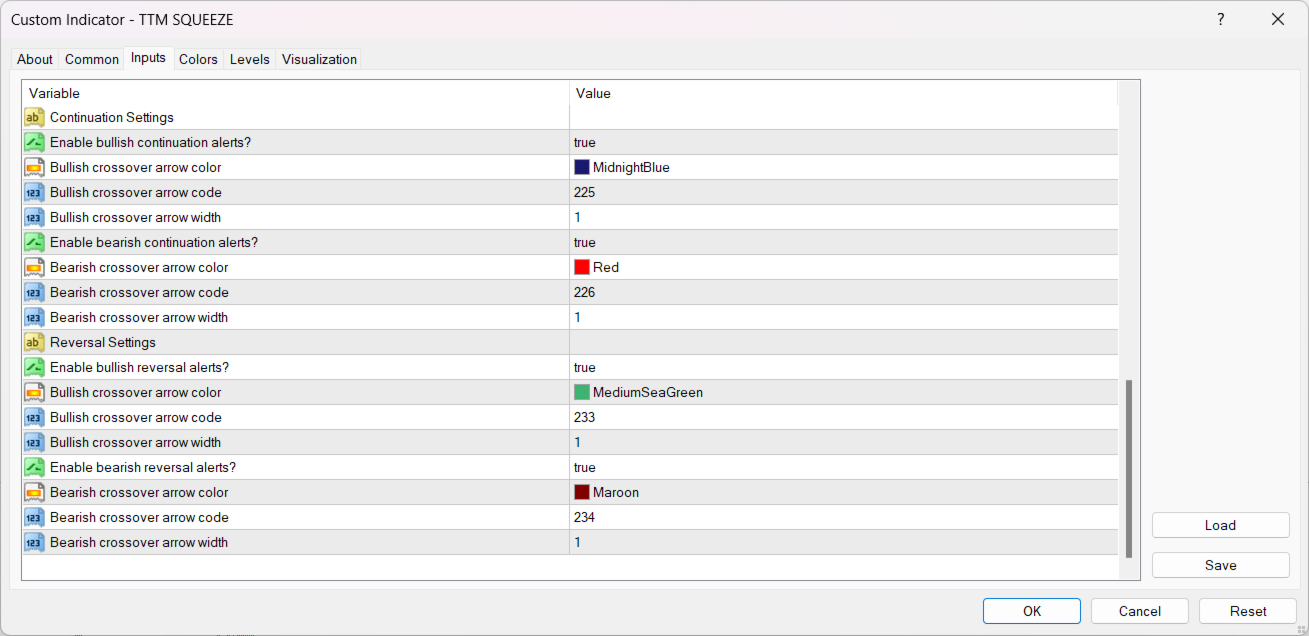
Continuation Signals
- Bullish continuation signals appear during sustained upward trends.
- Bearish continuation signals occur during ongoing downward moves.
- Both are visualized with unique arrows.
Reversal Signals
- Bullish reversal signals aim to catch price turning points from down to up.
- These are shown with a different arrow style to distinguish them from other signals.
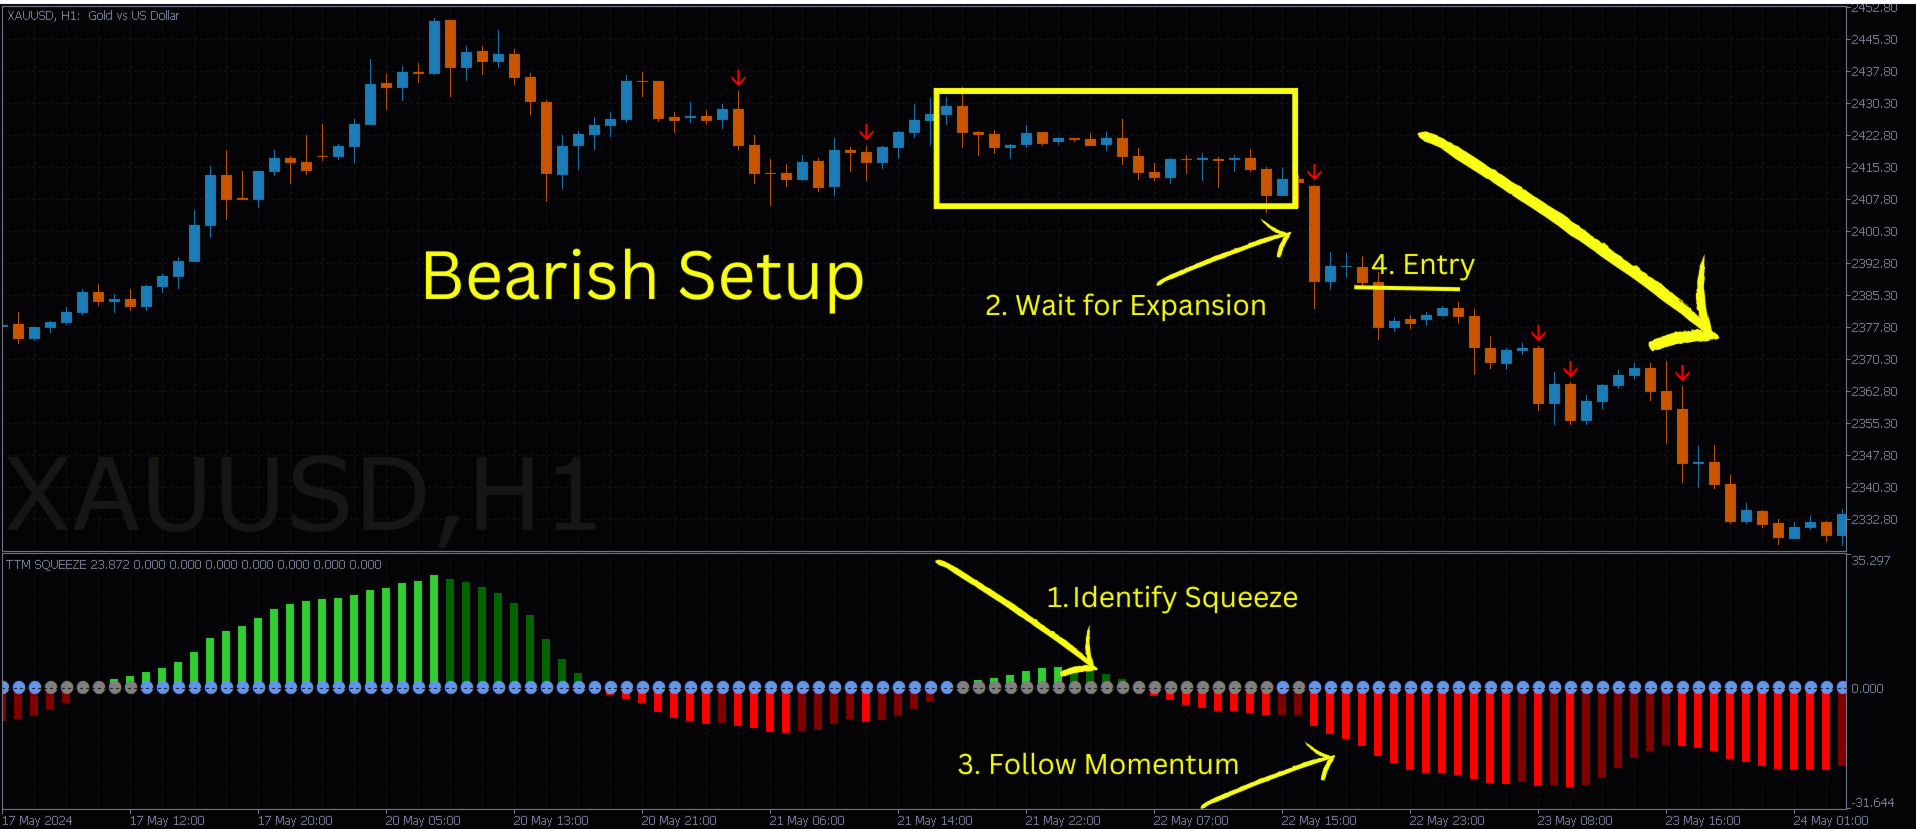
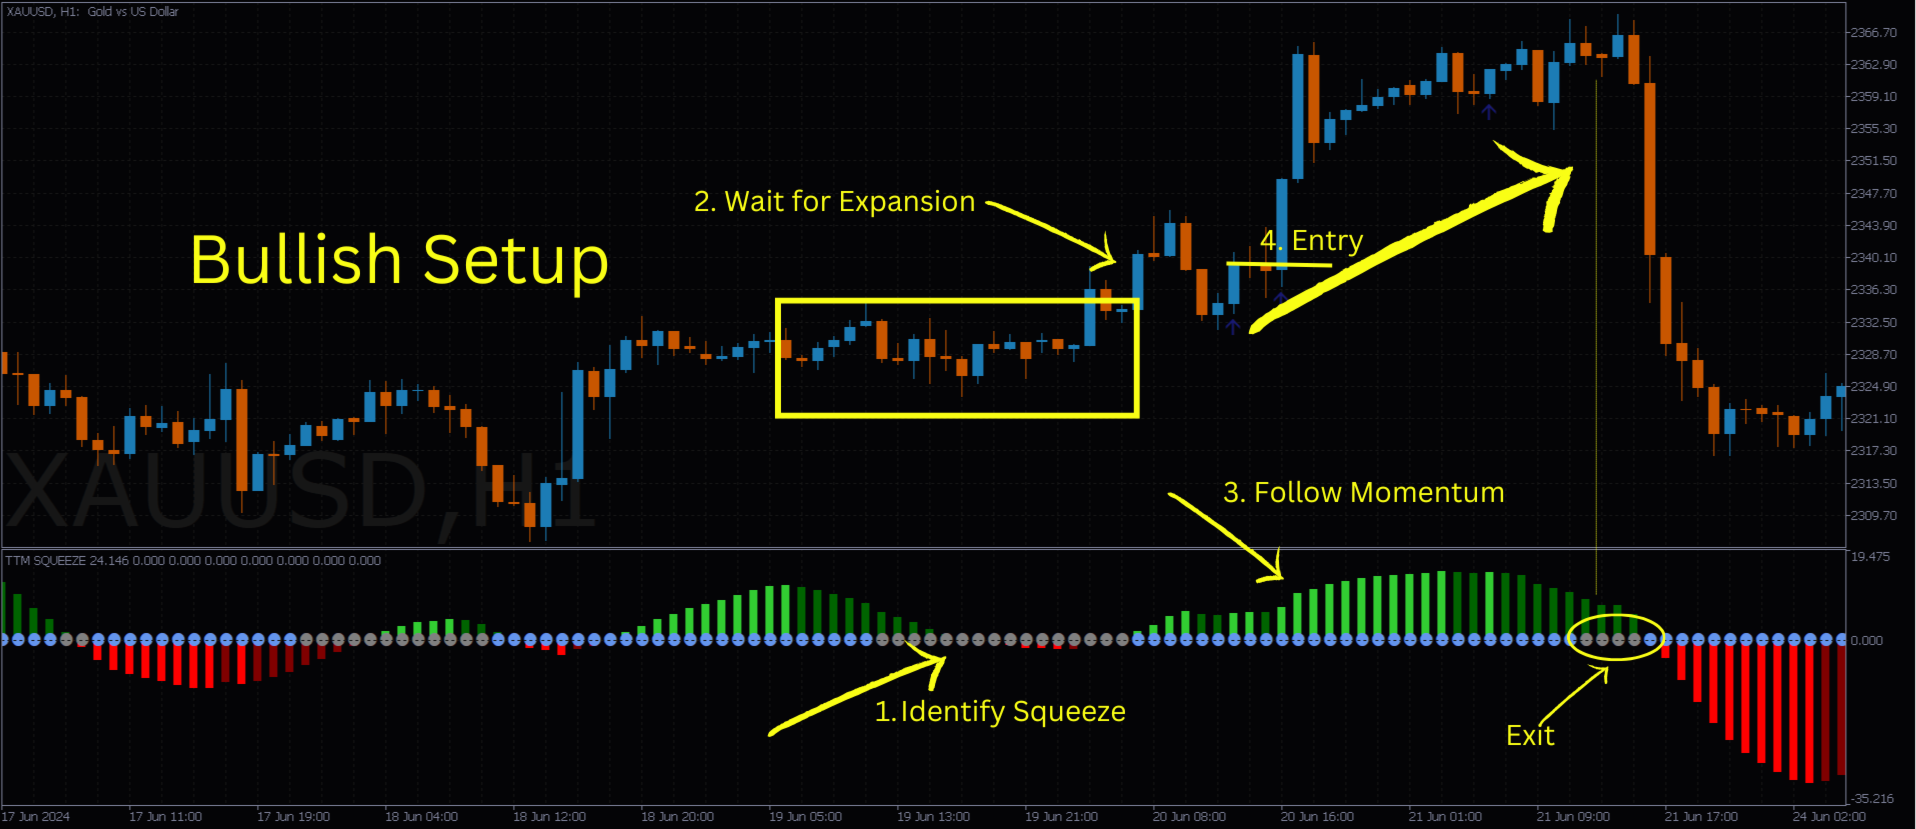
How to Use the Indicator
- Identify Squeeze: Look for the squeeze signal when the market compresses.
- Watch for Expansion: Be ready for a breakout when the expansion alert triggers.
- Follow Momentum: Use the histogram and momentum line to gauge the direction.
- Use Signal Arrows: Pay attention to crossover, continuation, and reversal arrows for entry/exit opportunities.
- Confirm with Other Tools: Combine with price patterns, support/resistance, or other indicators for confirmation.