Market Cipher
- インディケータ
- バージョン: 1.2
- アップデート済み: 25 9月 2025

Overview
Inspired by Tradingview’s falconCoin, The Market Cipher indicator is a momentum oscillator used to detect overbought/oversold conditions and potential trend reversals. Traders can also use it to spot divergences between price action and momentum for early entry or exit signals.
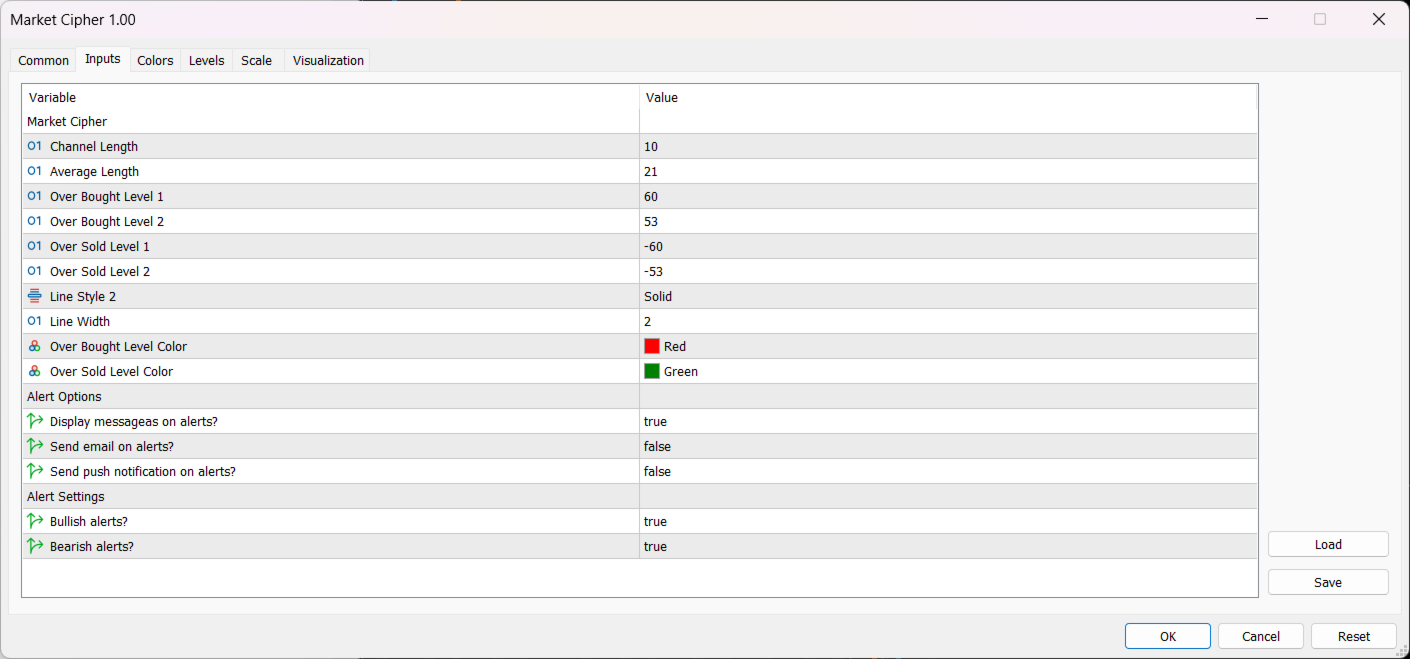
Configuration Guide
Core Indicator Settings
- The indicator calculates momentum using a short-term and a longer-term average.
- Momentum is plotted as a wave oscillating between overbought and oversold thresholds.
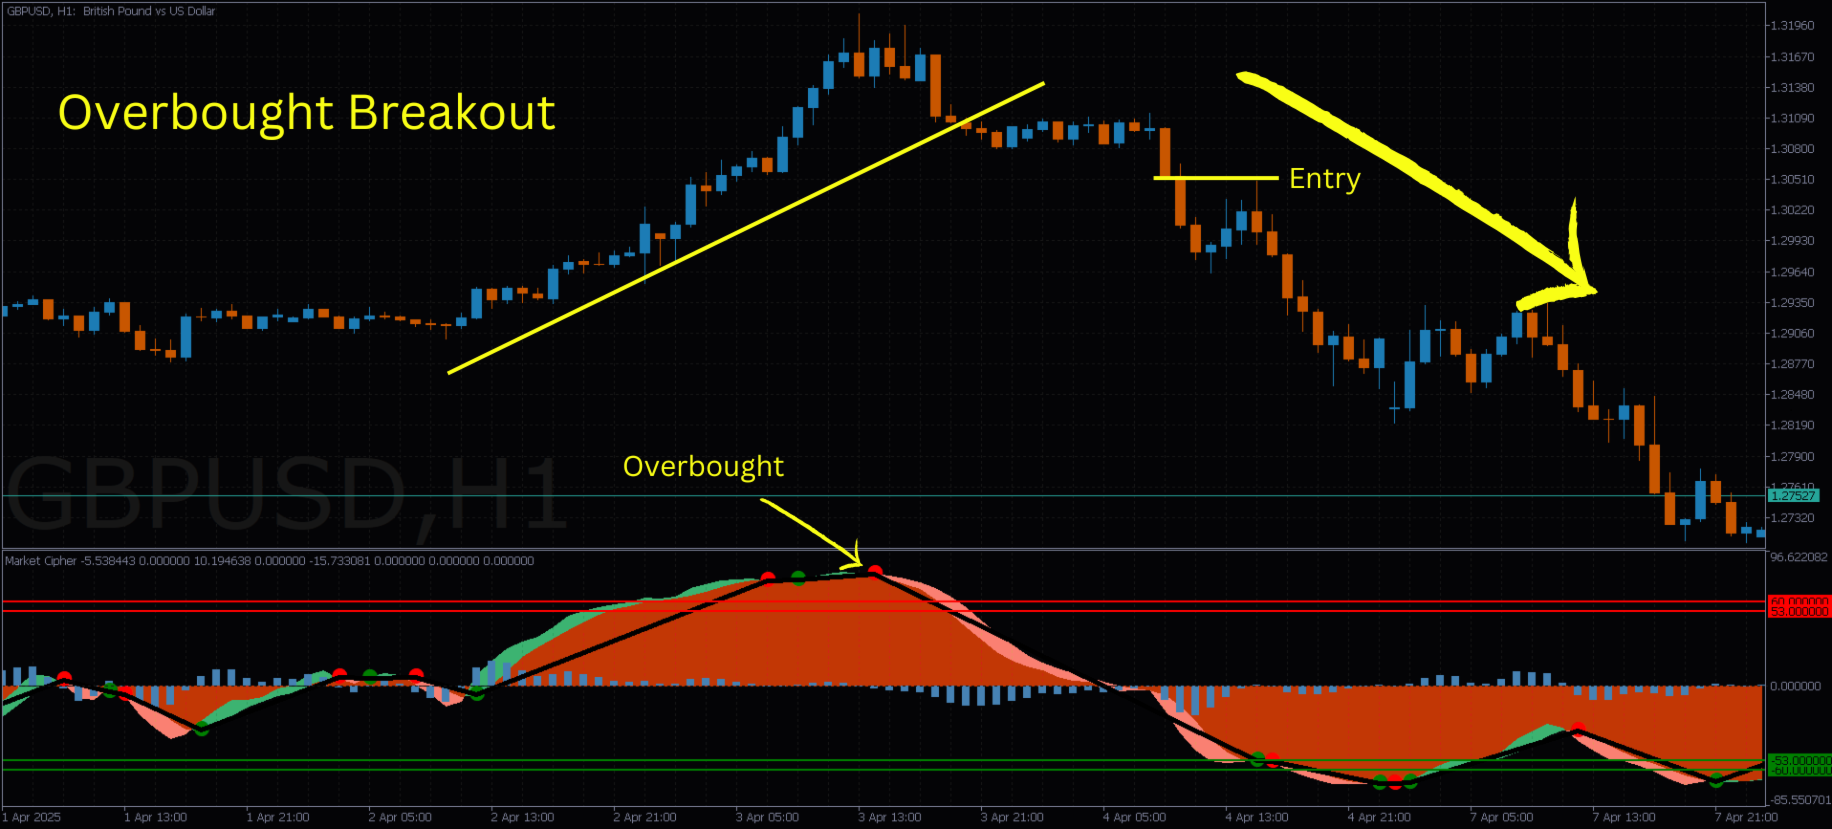
Overbought & Oversold Levels
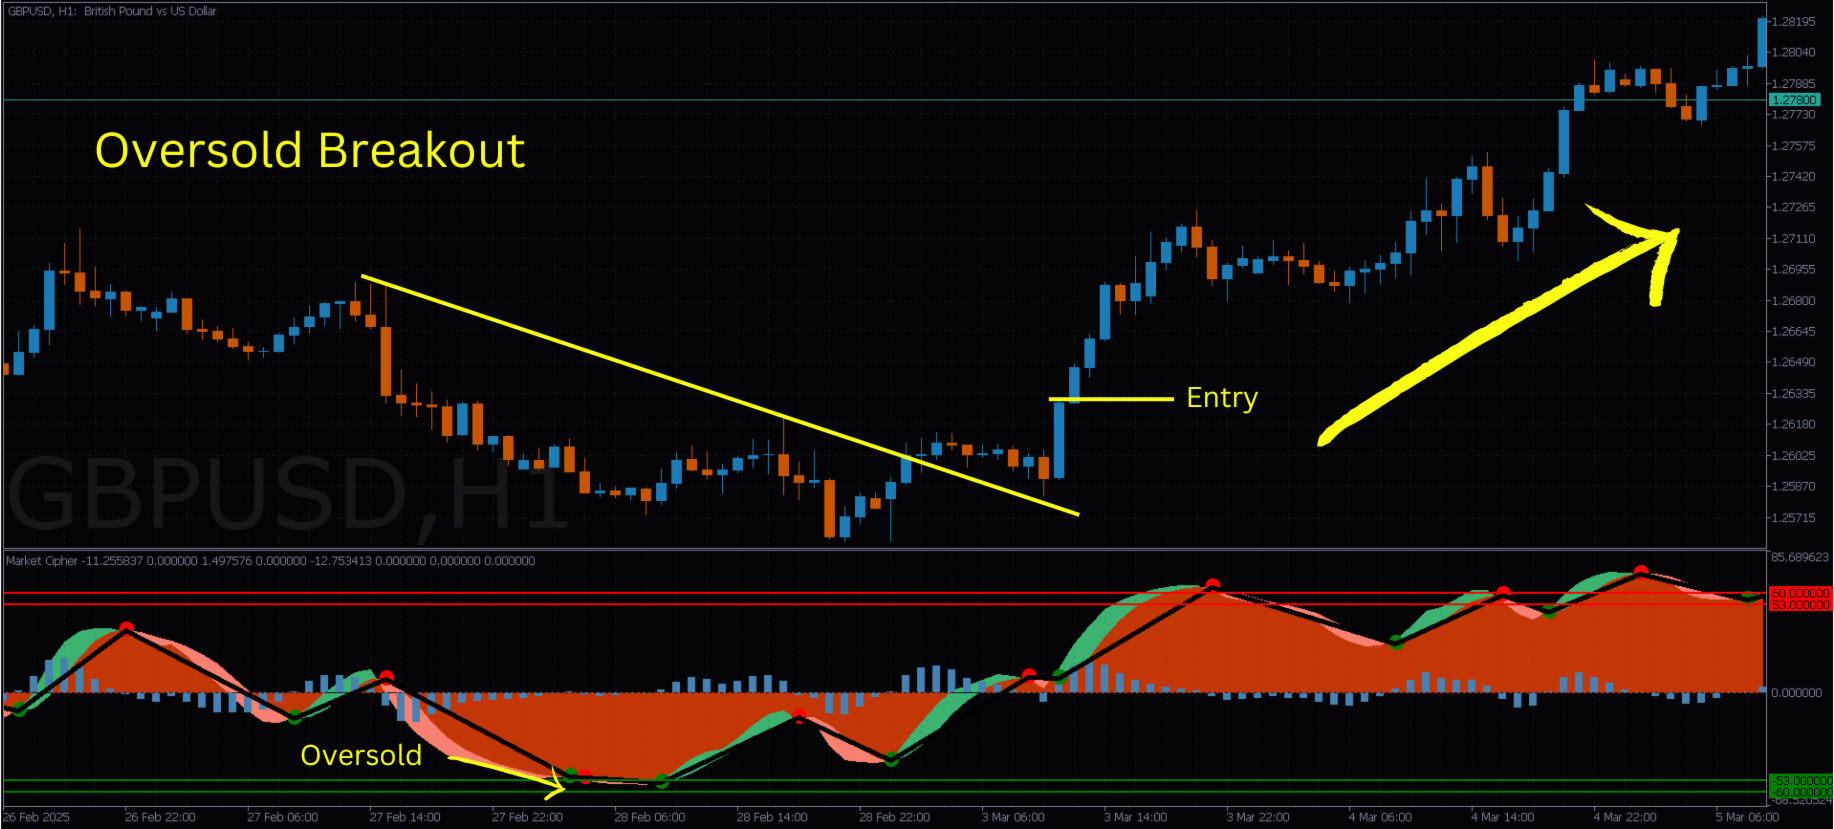
- There are two key zones each for overbought and oversold conditions:
- Overbought Zone: Indicates potential bearish reversals.
- Oversold Zone: Suggests possible bullish reversals.
- Color-coded lines visually separate these zones for quick identification.
How to Use the Indicator
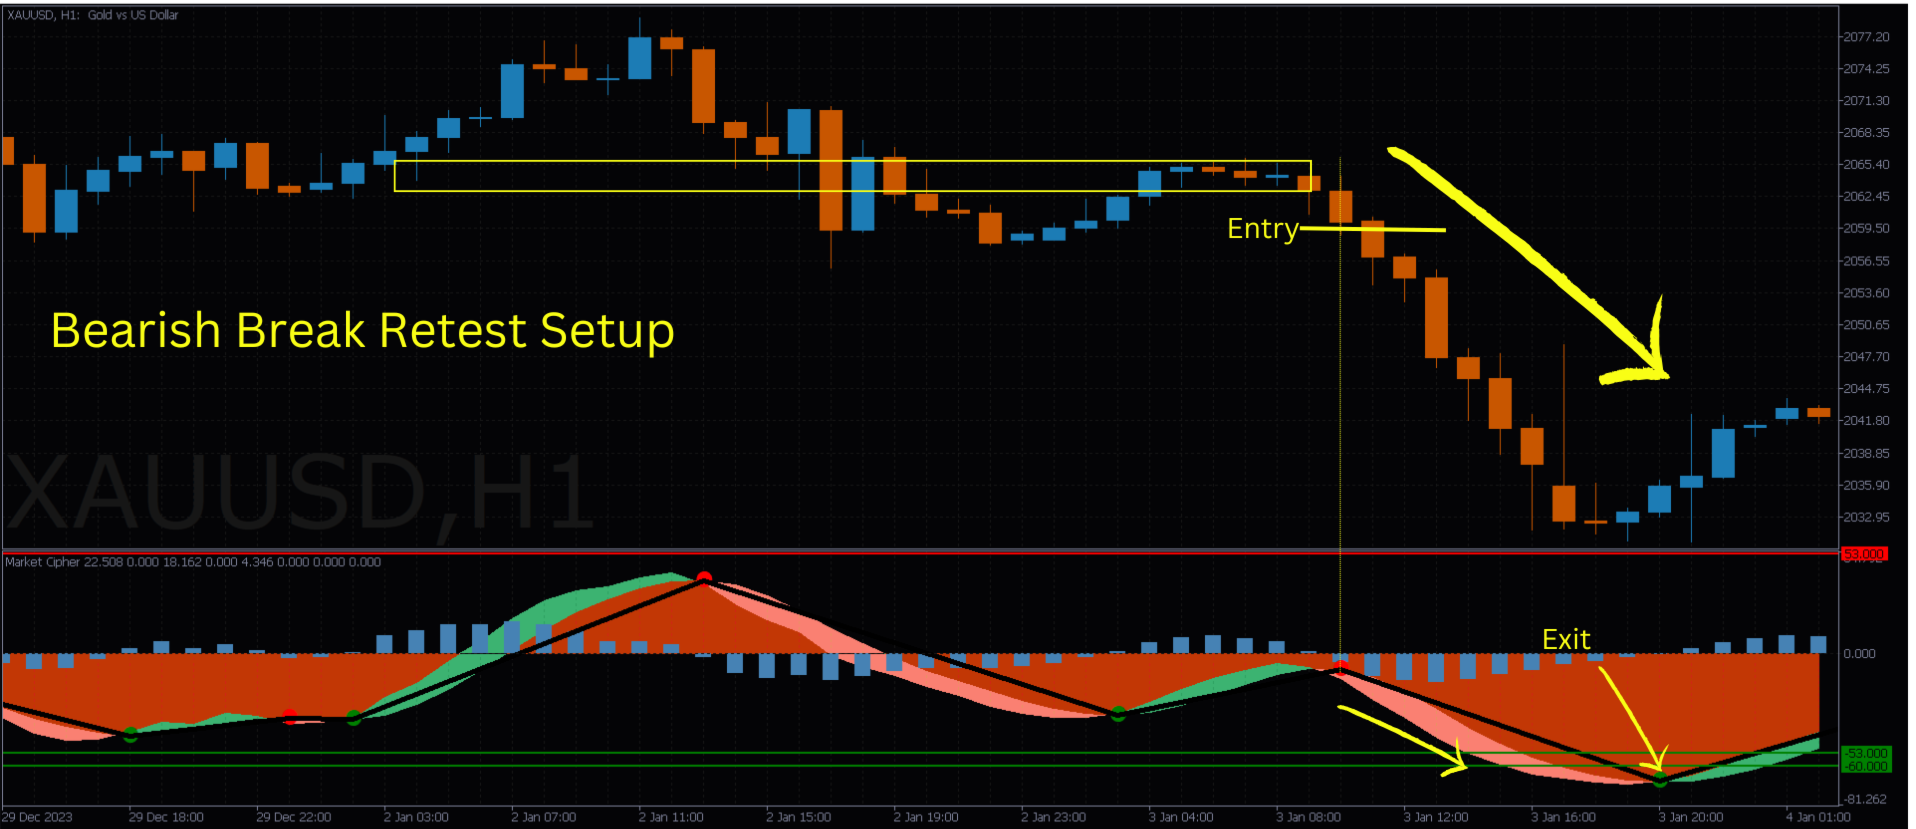
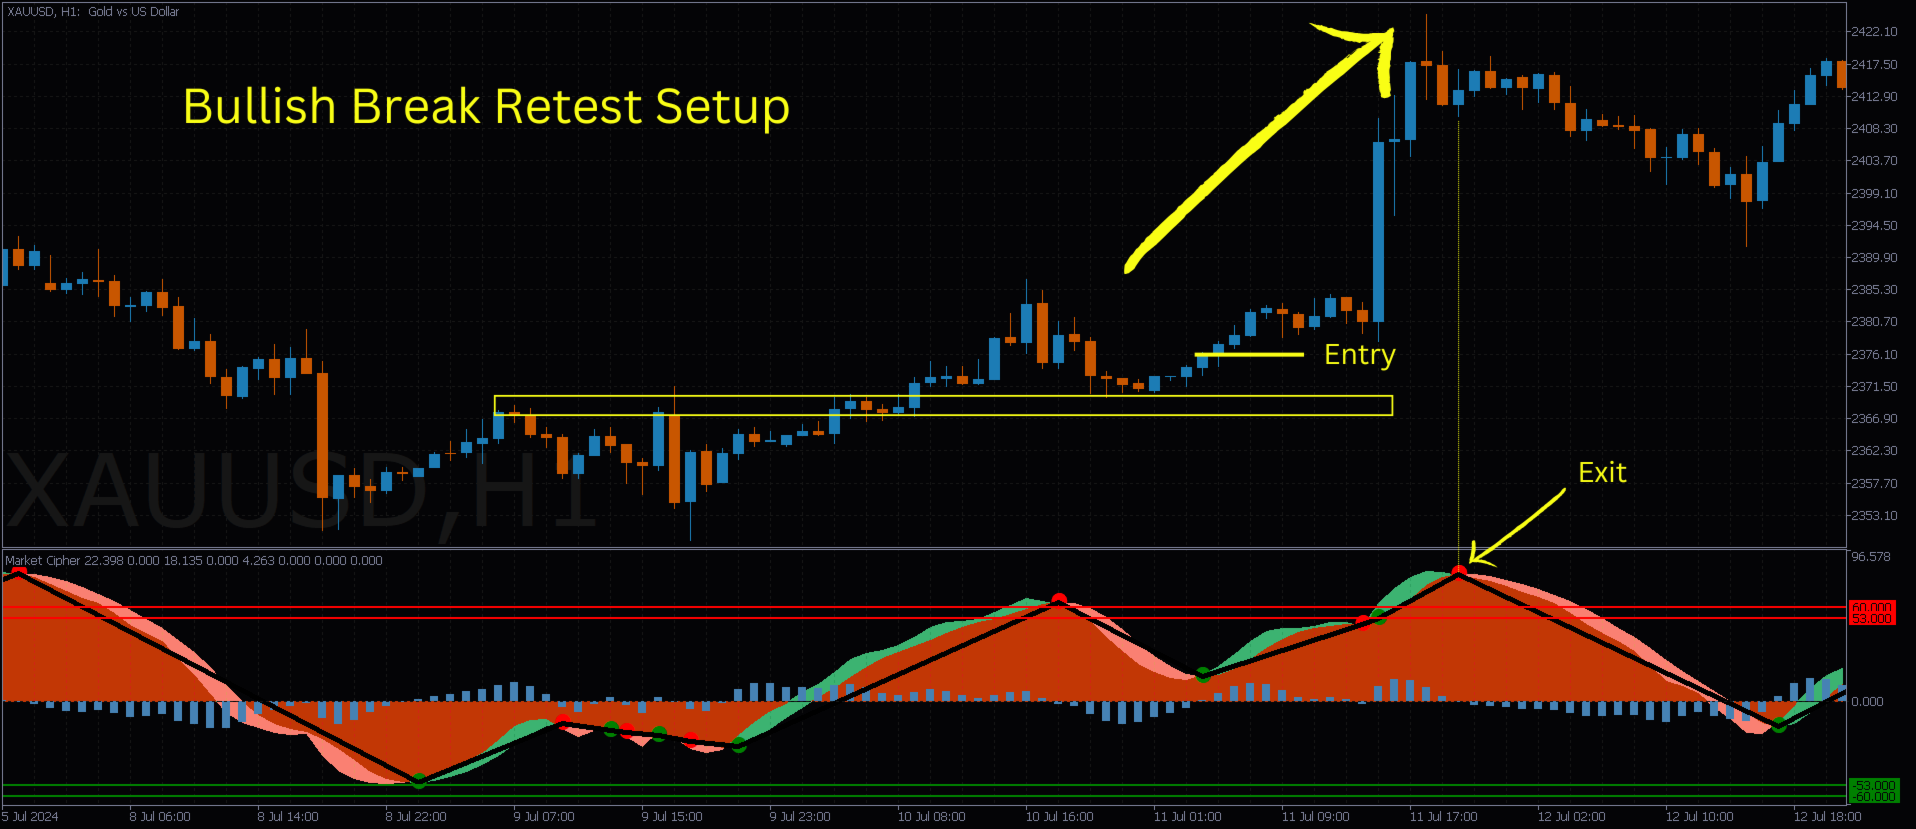
1. Overbought / Oversold Signals
- When the momentum wave enters the overbought zone, watch for potential price declines.
- When it dips into the oversold zone, it may signal a price rise.
- Use these levels to time entries, exits, or take partial profits.
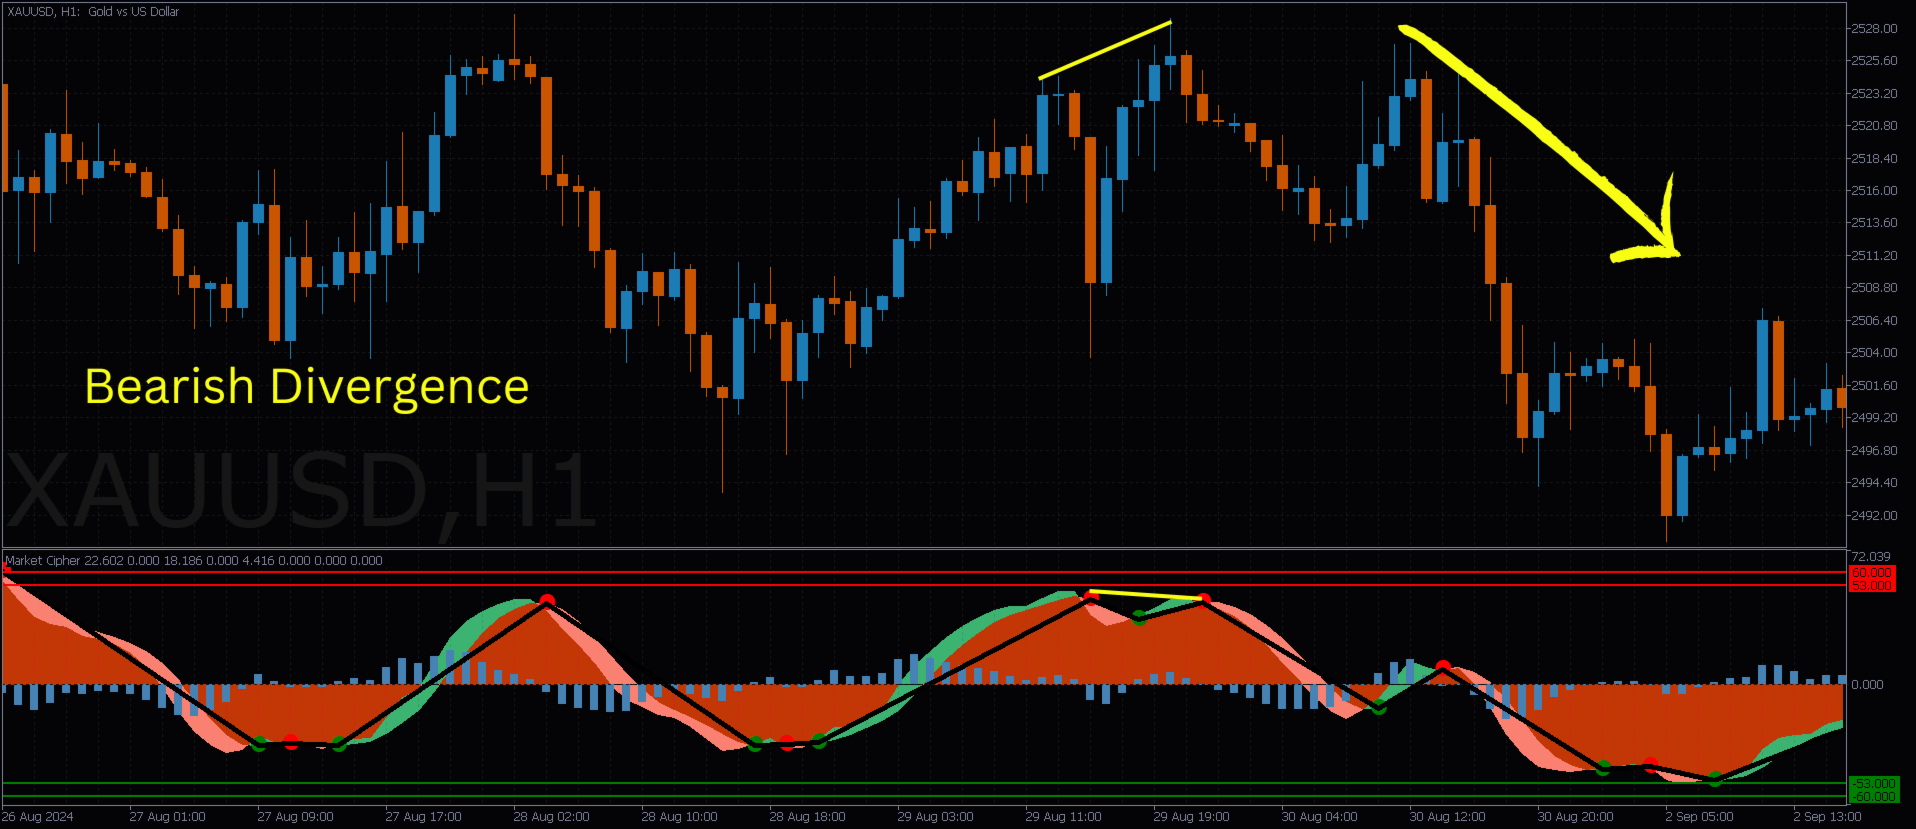
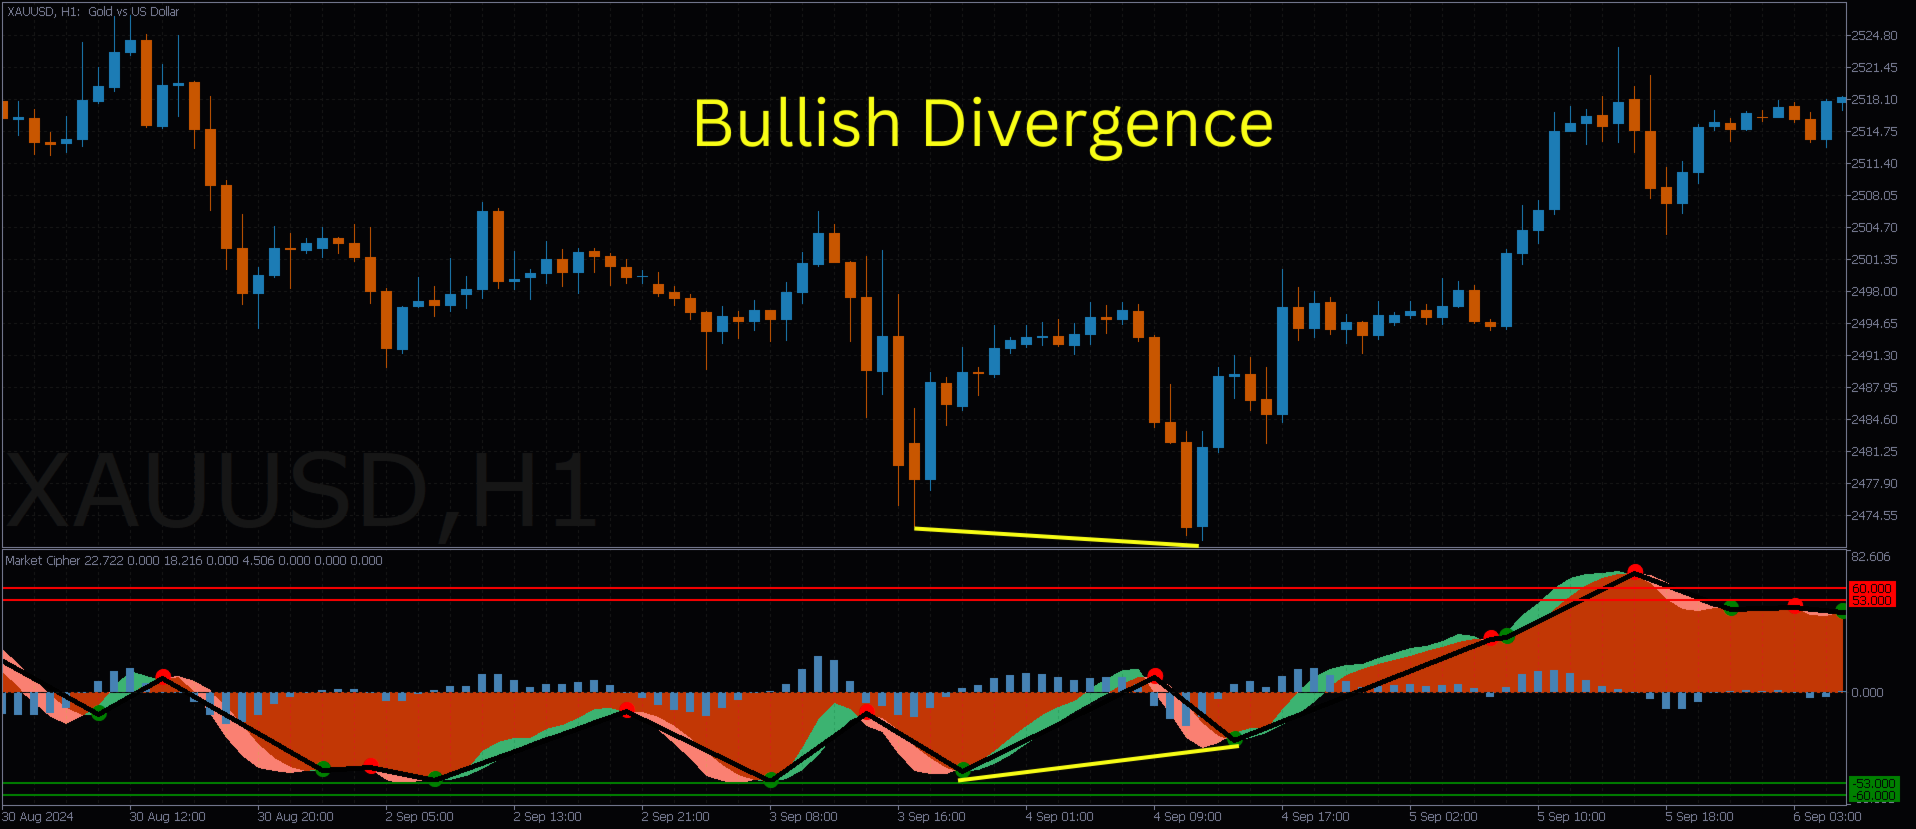
2. Divergence Strategy
- Bullish Divergence: Price makes lower lows while momentum makes higher lows → potential buy signal.
- Bearish Divergence: Price makes higher highs while momentum makes lower highs → potential sell signal.
- Look for divergence especially near overbought/oversold areas to increase probability of success.
3. Combined Approach
- Confirm divergence signals with overbought/oversold zones to filter out weak setups.
- For example: A bullish divergence near the oversold zone is stronger than one in a neutral area.
Alert System
Notification Options
- Enable alerts through messages, email, or push notifications depending on your platform settings.
Alert Conditions
- Bullish Alerts: Triggered when momentum indicates a potential upward move.
- Bearish Alerts: Triggered on momentum suggesting a possible downward move.
Visual Customization
- Adjust line style and width to fit your charting preference.
- Colors for overbought and oversold zones help clearly distinguish thresholds on the chart.