Order Block by Gerega
- インディケータ
- バージョン: 1.0

The Order Block Indicator for MT5 is a powerful tool designed for traders who use smart money concepts and institutional trading strategies. It automatically detects keyorder blockson the chart, helping traders identify high-probability reversal and continuation zones.
Key Features:
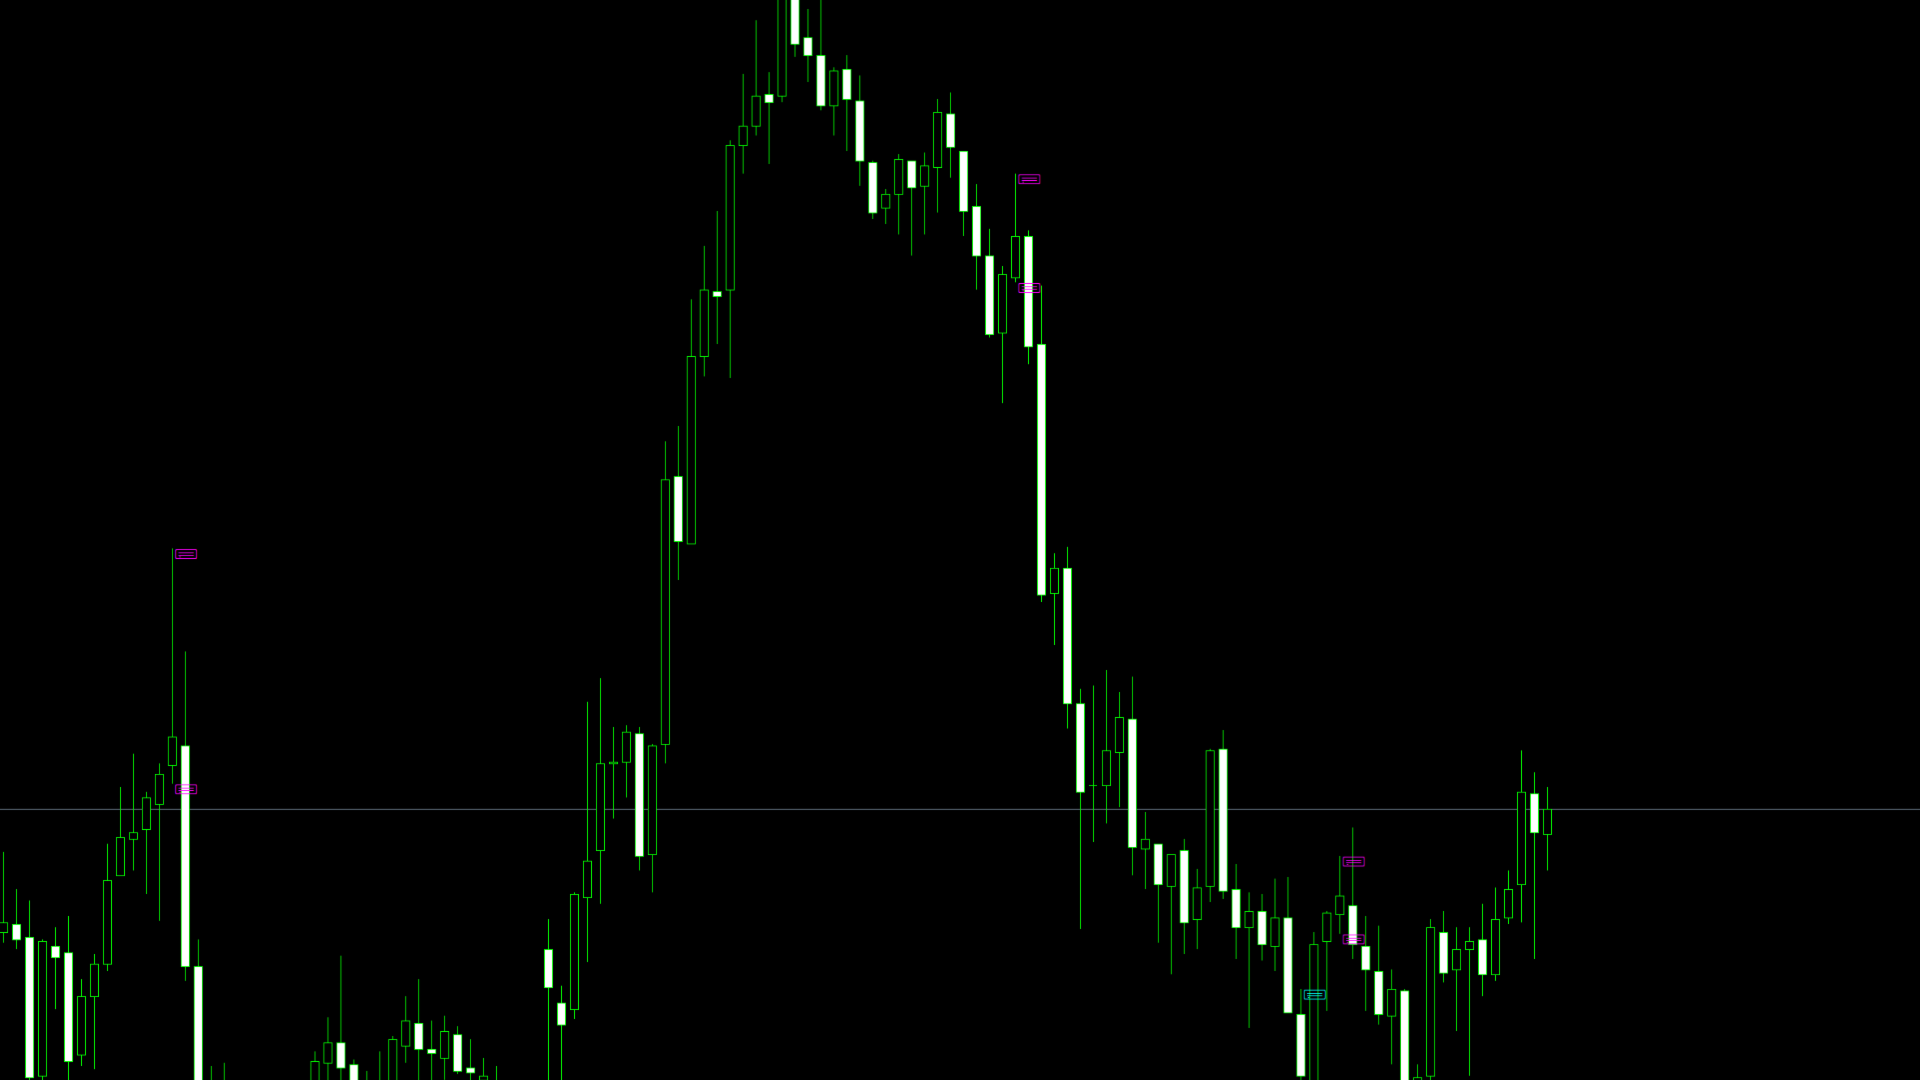
•Automatic Order Block Detection– Highlights strong buying and selling zones based on price action and volume.
•Multi-Timeframe Support– Analyze order blocks across different timeframes for better market insights.
•Custom Alerts– Receive notifications when the price reaches an order block.
•User-Friendly Interface– Easily customizable settings for different trading styles.
•Works with Any Market– Suitable for Forex, stocks, indices, and cryptocurrencies.
This indicator helps traders recognize areas where institutions and large players have placed their orders, providing an advantage in market analysis. Whether you are a scalper, day trader, or swing trader, the Order Block Indicator for MT5 will enhance your trading strategy.


отлично