BarsStreet MT5
- インディケータ
- バージョン: 1.0
- アクティベーション: 10

In the dynamic world of forex trading, technical analysis is an essential tool for traders seeking to navigate the complexities of the currency markets. One key element of this analysis is the interpretation of candlestick patterns, particularly the phenomenon of consecutive one-sided candles. These candles, characterized by a uniform direction — either completely bullish or bearish — offer significant insight into market sentiment and potential future movements. Understanding the implications of consecutive one-sided candles is essential for traders seeking to improve their strategies, effectively manage risk, and capitalize on market trends.
Features
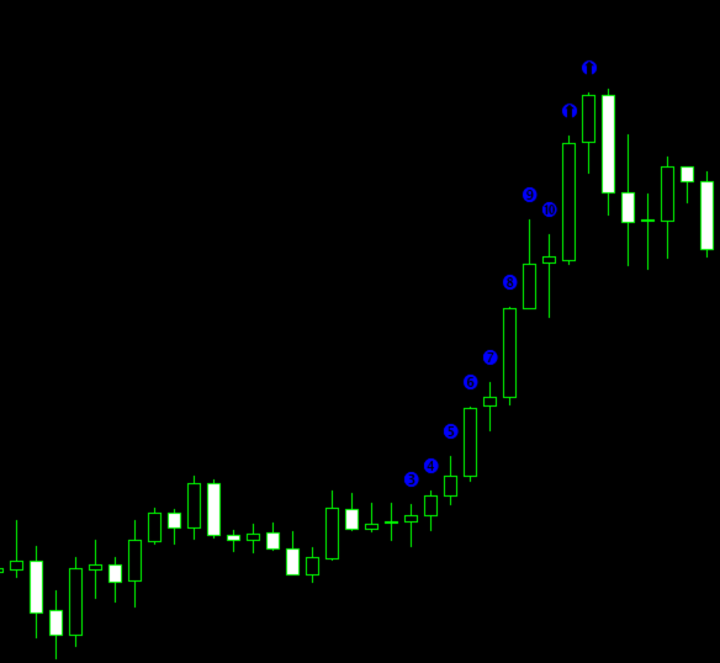
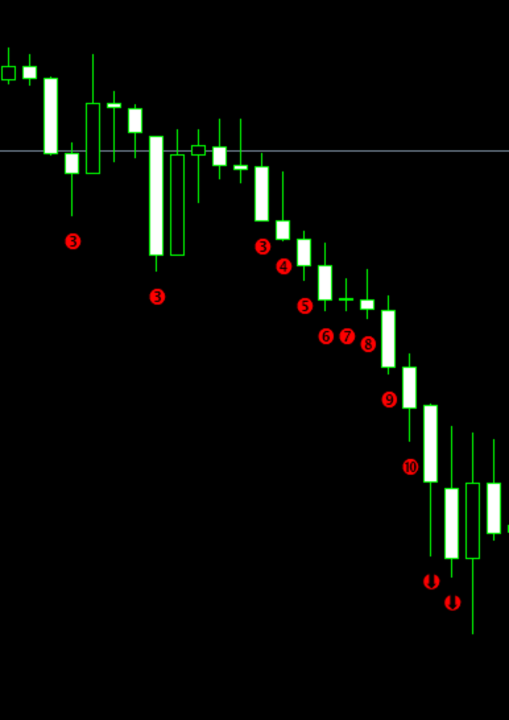
- This indicator determines the consecutive bullish and bearish bars;
- It graphically displays from 2 to 12 consecutive bullish and bearish bars with an alert;
- It is possible to disable the alert and unnecessary graphical elements;
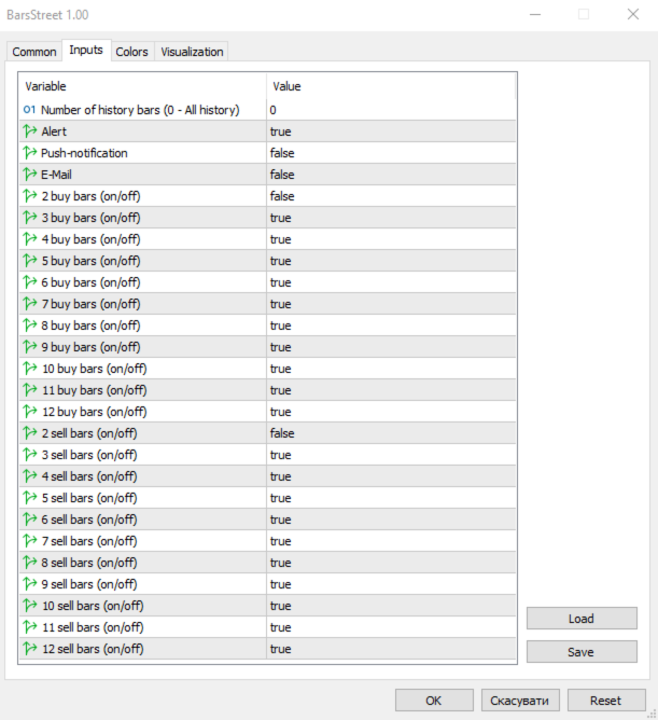
- It is also possible to adjust the number of bars in history, where the graphical elements of the indicator are to be drawn (0 = all available bars);
- There is an option to change the size of the graphical elements.
This indicator is well suited for trading binary options.
Parameters
- Number of history bars - the number of bars for calculating the indicator (0 - all history).
- Alert - alert about the appearance of a new graphical label.
- Push-notification - push-natification about the appearance of a new graphical label.
- Email - email about the appearance of a new graphical label.
- 2 buy bars (on/off) - enable/disable the graphical label of the indicator.
- 3 buy bars (on/off) - enable/disable the graphical label of the indicator.
- 4 buy bars (on/off) - enable/disable the graphical label of the indicator.
- 5 buy bars (on/off) - enable/disable the graphical label of the indicator.
- 6 buy bars (on/off) - enable/disable the graphical label of the indicator.
- 7 buy bars (on/off) - enable/disable the graphical label of the indicator.
- 8 buy bars (on/off) - enable/disable the graphical label of the indicator.
- 9 buy bars (on/off) - enable/disable the graphical label of the indicator.
- 10 buy bars (on/off) - enable/disable the graphical label of the indicator.
- 11 buy bars (on/off) - enable/disable the graphical label of the indicator.
- 12 buy bars (on/off) - enable/disable the graphical label of the indicator.
- 2 sell bars (on/off) - enable/disable the graphical label of the indicator.
- 3 sell bars (on/off) - enable/disable the graphical label of the indicator.
- 4 sell bars (on/off) - enable/disable the graphical label of the indicator.
- 5 sell bars (on/off) - enable/disable the graphical label of the indicator.
- 6 sell bars (on/off) - enable/disable the graphical label of the indicator.
- 7 sell bars (on/off) - enable/disable the graphical label of the indicator.
- 8 sell bars (on/off) - enable/disable the graphical label of the indicator.
- 9 sell bars (on/off) - enable/disable the graphical label of the indicator.
- 10 sell bars (on/off) - enable/disable the graphical label of the indicator.
- 11 sell bars (on/off) - enable/disable the graphical label of the indicator.
- 12 sell bars (on/off) - enable/disable the graphical label of the indicator.
The version for MT4 is here