Elder SafeZone Short
- インディケータ
-
Financial Trading Seminars Inc.
 Dr. Alexander Elder
Dr. Alexander Elder is a professional trader based in New York City. He is the author of 11 books, including Trading for a Living (1996) and - バージョン: 2.0
- アップデート済み: 17 11月 2021
- アクティベーション: 5
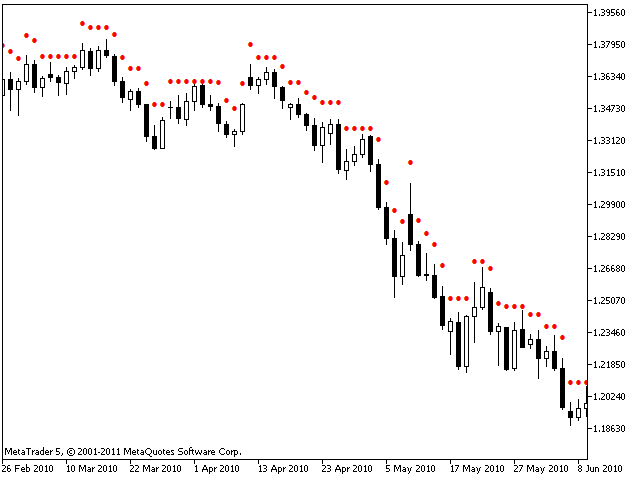
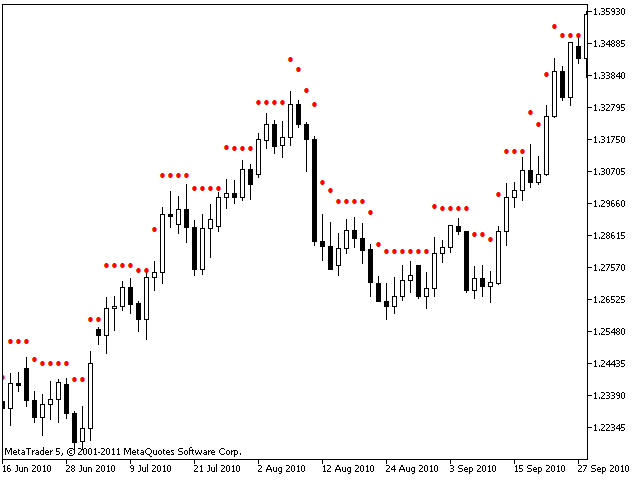
SafeZone is a method for setting stops on the basis of recent volatility, outside the level of market noise. It is described in "Come into my Trading Room" book.
In a downtrend, SafeZone defines noise as the portion of the current bar that extends above the high of the previous bar, against the downtrend. It averages the noise level over a period of time and multiplies it by a trader-selected factor.
For short trades, it adds the average noise level, multiplied by a factor, to the latest high to compute the stop. Stops are allowed to move only in the direction of the trade, always tightening. When a trade is stopped out, this indicator reverses and starts a new sequence.
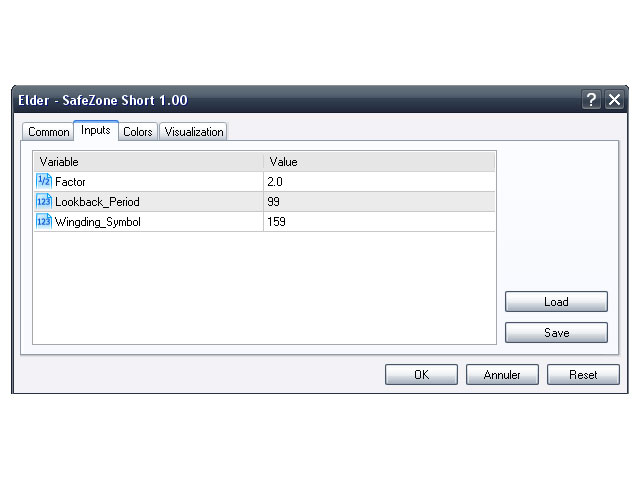
Parameters:
- Factor (3) – This is the factor by which we multiply the average level of noise computed by SafeZone.
- Lookback_Period (99) – The number of bars that the SafeZone looks back when calculating an average market noise.
- Wingding_Symbol(159) – Symbol to be displayed.