Elder Force Index With ATR Channels

3
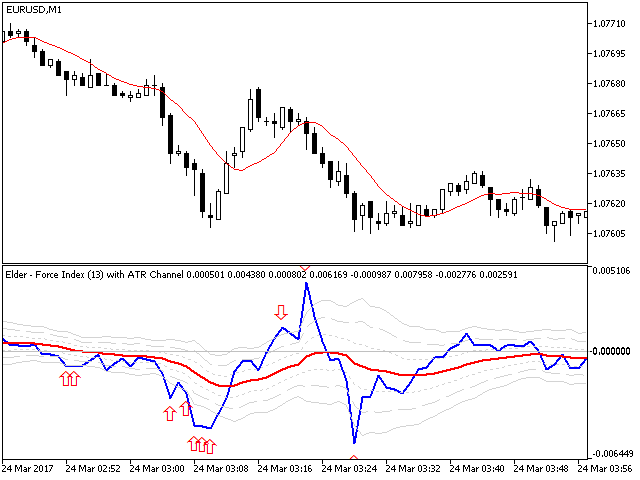
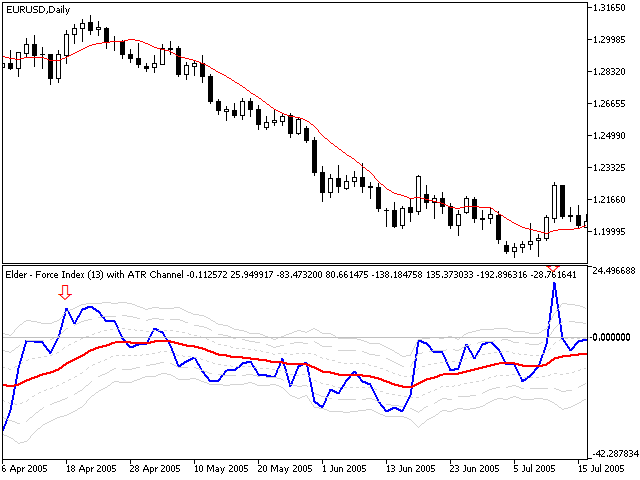
Force Index に Average True Range (ATR) チャネルを追加することは、Kerry Lovvorn によって提案されていました。 これらのチャネルを追加すると、Force Index が中間のトップとボトムを識別するための優れたツールになります。 ATR チャネルを使用した Force Index はすべてのターンを捕捉するわけではありませんが、識別されたターンは非常に真剣な注目に値します。

注: Average True Range の「true」という言葉は、価格ギャップに対処することを指します。 Force Index にはギャップがないため、ここでは ATR は Average Range と同じになります。

フォース インデックスが 3-ATR チャネルを上回ったり下回ったりするたびに、ティッカーが持続不可能な極端な領域に到達したことを示します。 そこで上昇も下落も疲弊し、価格が反転する傾向にあります。 これは、上部領域と下部領域の両方を同等に効率的に呼び出すことができる数少ないツールの 1 つです。 エルダーディスクは、フォースインデックスのEMAが3-ATRチャネルを上回ったときに、プロットの上に赤い矢印を配置します。 EMA が 3-ATR チャネルを下回ると、プロットの下に赤い矢印が表示されます。

私たちの経験では、これらのシグナルは週足チャートで特にうまく機能します。 もちろん、ユーザーは任意の時間枠でそれらを試してみることができます。


パラメータは次のとおりです。
  • Force Index Period (13) – 生の Force Index の MA の長さ
  • Force Index MA モード (指数関数) – Force Index の移動平均モード
  • Force Index Volume type (ティック) - Force Index を適用するボリュームのタイプ
  • ATR 期間 (14) - 生の ATR の長さ
  • ATR アンプリフィケーター (100) - ATR を増幅するためのモディファイアー
  • バンドの MA のモード (指数関数) – すべてのバンドの MA モード。
  • バンドの MA の長さ (21) - バンドの MA の長さ
  • 第 1 バンド係数 (1) - 第 1 バンドの係数 (+ および -)
  • 2 番目のバンド係数 (1.5) - 2 番目のバンドの係数 (+ および -)
  • 3rd バンド係数 (2) - 3 番目のバンドの係数 (+ および -)
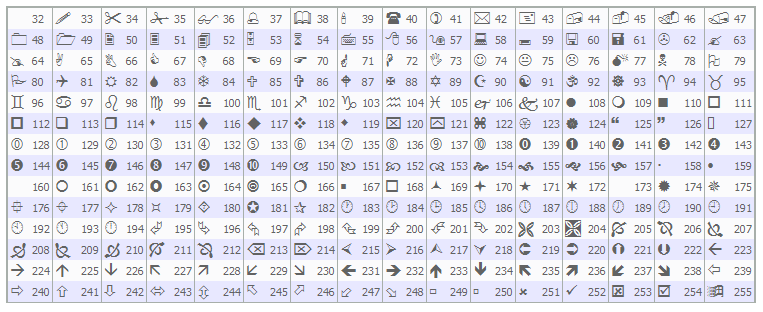
  • 上のスパイク サインの Wingdings コード (242) – シンボル (下矢印) の Wingdings コード。 スクリーンショットのセクションで、使用可能な記号のリストを確認できます。
  • 上のスパイクサインの色 (赤) - バンドの上のシンボルの色
  • 以下のスパイク サインの Wingdings コード (241) – シンボル (上矢印) の Wingdings コード。 スクリーンショットのセクションで、使用可能な記号のリストを確認できます。
  • 下のスパイクサインの色 (ライムグリーン) - バンドの下のシンボルの色


フォーマットのヒント: フォース インデックス チャネルには、フォース インデックス、平滑化されたフォース インデックス、および 1、2、および 3 ATR の上部バンドと下部バンドの 7 つのプロットがあります。

フォースインデックスは青色の太い線で描画されます。 平均力は赤い実線です。 1 ATR における上部と下部のバンドは点線で描かれています。 2 ATR の上部と下部のバンドは破線を使用します。 3 ATR の上部と下部のバンドは灰色の実線です。
おすすめのプロダクト
Noize Absorption Index - is the manual trading system that measures the difference of pressure between bears forces and bulls forces. Green line - is a noize free index that showing curent situation. Zero value of index shows totally choppy/flat market.Values above zero level shows how powerfull bullish wave is and values below zero measures bearish forces.Up arrow appears on bearish market when it's ready to reverse, dn arrow appears on weak bullish market, as a result of reverse expectation.
ADVANCED FUNCTIONALITIES: Trend Score (0-100) with visual bar Intelligent signals with adjustable strength (1-10) Risk management with automatic TP/SL Audible and visual alerts Price zones with smooth filling Multi-indicator analysis (RSI, ATR, BB, EMAs) DESIGN FEATURES Modern Visual: Smooth and well-spaced lines (EMA with 2-3px width) Vibrant and professional colors (Sky Blue, Orange, Gold) Modern arrows (code 233/234) for buy/sell signals Configurable dark/light theme Adjustable transparency f
Universal Soul Reaper is an atmospheric market-flow oscillator designed to interpret price behavior as a cycle of spiritual energy. Instead of reacting to raw price alone, it visualizes the state of the market’s soul —revealing when momentum is awakening, stabilizing, or fading. The indicator operates in a separate window and presents three interwoven entities: the Ectoplasmic Veil , the Spirit Boundary , and the Soul Core . Together, they form a living framework that helps traders sense pressu
SMC Venom Model BPR インジケーターは、スマート マネー (SMC) コンセプトで取引するトレーダー向けのプロフェッショナル ツールです。価格チャート上の 2 つの主要なパターンを自動的に識別します。 FVG   (フェアバリューギャップ) は、3 本のローソク足の組み合わせで、最初のローソク足と 3 番目のローソク足の間にギャップがあります。ボリュームサポートのないレベル間のゾーンを形成し、価格修正につながることがよくあります。 BPR   (バランス価格範囲) は、2 つの FVG パターンの組み合わせで、「ブリッジ」を形成します。これは、価格がボリュームアクティビティの少ない動きで動くときに、ブレイクアウトしてレベルに戻るゾーンで、ローソク足の間にギャップを作成します。 これらのパターンは、大規模な市場プレーヤーと一般参加者の相互作用が発生するチャート上のボリュームと価格動向の分析に基づいて、トレーダーが主要なサポート/レジスタンス レベル、ブレイクアウト ゾーン、エントリ ポイントを識別するのに役立ちます。 インジケーターは、長方形と矢印の形でパターンを視覚
Binary Options Assistant (BOA) Multi Currency Dashboard for Binary Options (MT5) . You can use any of the BOA Signals Indicators with the dashboard. Just change the BOA Signals Indicator Name in the dashboard settings to the indicator you want to get signals from. For example: CHILL. BLAZE:  BOA_BLAZE_Indicator_v1   Strategy :   BLW Online Trading Binary Options Strategy (3 Moving Average) LAVA:  BOA_LAVA_Indicator_v1   Strategy:   Lady Trader Binary Options Strategy (Bollinger Bands & Stochas
Fibo Daily Channel Indicator The  Indicator is a powerful tool for traders, providing precise daily support and resistance levels based on Fibonacci retracement and extension calculations. This indicator automatically draws key pivot points (PP, R1, R2, S1, S2) as well as additional extension levels (R3, R4, S3, S4), helping traders identify potential reversal and breakout zones with ease. It includes customizable alerts and push notifications, allowing traders to receive updates whenever the pr
**   All Symbols   x   All Timeframes   scan just by pressing scanner button ** Discount: The price is $50$, But now it is just $39, Limited time offer is active. *** Contact me  to send you instruction and add you in "Trend Reversal group" for sharing or seeing experiences with other users. Introduction: Trendlines are the most famous technical analysis in trading . Trendlines continually form on the charts of markets across all the different timeframes providing huge opportunities for traders
プレミアムレベルは、正しい予測の精度が80%を超える独自の指標です。 この指標は、最高のトレーディングスペシャリストによって2か月以上テストされています。 あなたが他のどこにも見つけられない作者の指標! スクリーンショットから、このツールの正確さを自分で確認できます。 1は、1キャンドルの有効期限を持つバイナリーオプションの取引に最適です。 2はすべての通貨ペア、株式、商品、暗号通貨で機能します 手順: 赤い矢印が表示されたらすぐにダウントレードを開き、青い矢印が表示されたら閉じます。青い矢印の後に開くこともできます。 試してテストしてください!推奨設定はデフォルトです! 日足チャートで最高の精度を示します! インディケータは、2600 Pipsの収益性に対して、約10Pipsという非常に小さなマージンを使用します。
##   ONLY GOLD ##   Тiльки Золото ## **Mercaria Professional Trading Zones - Complete Guide** ## **Mercaria Professional Trading Zones - Повний посібник** ### **How Mercaria Zones Work / Як працюють зони Mercaria** **English:** Mercaria Zones is an advanced trading indicator that identifies high-probability support and resistance areas using ZigZag extremes combined with mathematical zone calculations. The indicator works on multiple timeframes simultaneously, providing a comprehensive view
Improved version of the free HMA Trend indicator (for MetaTrader 4) with statistical analysis. HMA Trend is a trend indicator based on the Hull Moving Average (HMA) with two periods. HMA with a slow period identifies the trend, while HMA with a fast period determines the short-term movements and signals in the trend direction. The main differences from the free version: Ability to predict the probability of a trend reversal using analysis of history data. Plotting statistical charts for analyzi
The Antique Trend Indicator is a revolutionary trend trading and filtering solution with all the important features of a trend tool built into one tool! The Antique Trend indicator is good for any trader, suitable for any trader both for Forex and binary options. There is no need to configure anything, everything has been perfected by time and experience, it works great during flats and trends. The Antique Trend indicator is a tool for technical analysis of financial markets, reflecting curren
市場ボリュームプロファイル指標 + スマートオシレーター。通貨ペア、株式、先物、暗号資産など、ほぼすべての銘柄で動作し、リアルボリュームとティックボリュームの両方に対応しています。プロファイル作成範囲は、1週間や1ヶ月などの自動設定のほか、境界線(赤と青の2本の垂直線)を動かして手動で設定することも可能です。ヒストグラム形式で表示され、特定の価格レベルにおけるヒストグラムの幅は、その価格帯で行われた取引量(約定数)を表します。 Mode level line color パラメータを使用すると、価格が反発する可能性が高い重要なボリュームレベルを自動表示できます。また、 Maximum color パラメータは、指定した範囲全体で最も取引が集中した最大ボリュームレベルを個別に表示します。 スマートオシレーターは買われすぎ・売られすぎのゾーンを表示します。複数のインジケーターからの情報を分析し、処理されたデータに基づいて、買われすぎと売られすぎのゾーンを対応する色で塗りつぶします。 Volume every day では、 Range period パラメータでプロファイル作成の時間間隔を
Laguerre SuperTrend Clouds   adds an Adaptive Laguerre averaging algorithm and alerts to the widely popular SuperTrend indicator. As the name suggests,   Laguerre SuperTrend Clouds (LSC)   is a trending indicator which works best in trendy (not choppy) markets. The SuperTrend is an extremely popular indicator for intraday and daily trading, and can be used on any timeframe. Incorporating Laguerre's equation to this can facilitate more robust trend detection and smoother filters. The LSC uses the
# DRAWDOWN INDICATOR V4.0 - The Essential Tool to Master Your Trading ## Transform Your Trading with a Complete Real-Time Performance Overview In the demanding world of Forex and CFD trading, **knowing your real-time performance** isn't a luxury—it's an **absolute necessity**. The **Drawdown Indicator V4.0** is much more than a simple indicator: it's your **professional dashboard** that gives you a clear, precise, and instant view of your trading account status. --- ## Why This Indicator
KT Renko Patterns は、レンコチャートの各レンガをスキャンしながら、さまざまな金融市場でトレーダーによく使用されている有名なチャートパターンを検出します。 時間ベースのチャートと比較して、レンコチャートは視認性が高くシンプルなため、パターンベースのトレードがより簡単かつ明確になります。 KT Renko Patterns は複数のレンコパターンを搭載しており、その多くは Prashant Shah 氏の著書『Profitable Trading with Renko Charts』でも詳しく解説されています。 KT Renko Patterns インジケーターに基づいた 100% 自動化された EA は、こちらからご利用いただけます - KT Renko Patterns EA 。 機能一覧 最大8種類の明確なレンコパターンを表示し、あいまいさなく取引をサポートします。 完全な客観性を保つため、すべてのパターンにストップロスとフィボナッチターゲットが設定されています。 KT Renko Patterns は各パターンの精度を継続的に測定し、重要な統計情報をチャート
TRI Visualizer Enhanced - 熱力学的市場分析の革命 概要 TRI(Thermal Range Indicator)Visualizer Enhanced は、従来のテクニカル分析を超越した、物理学の熱力学理論を応用した革新的なマーケット分析インジケーターです。市場の価格変動を「熱力学的エネルギー」として捉え、これまで見落とされていた市場の微細な変化を高精度で検出します。 革新的な仕組み 1. デュアル計算エンジン クラシックTRIモード 基本公式: |終値-始値| + (高値-安値) ローソク足の実体とヒゲを統合した純粋なボラティリティ測定 シンプルで直感的、あらゆる市場環境で安定動作 熱力学的TRIモード(独自開発) 価格加速度 :2次微分による価格変化の勢いを測定 出来高変化率 :相対的な出来高の変化を動的に評価 ポジションエネルギー :正規化された価格変動エネルギーを計算 熱力学的係数 :物理学の熱力学法則を市場分析に応用 2. 高度な平滑化システム SMA(単純移動平均) :基本的なノイズ除去 EMA(指数移動平均) :最新データ重視の平滑化
The Riko Trend indicator is a revolutionary trend trading and filtering solution with all the important features of a trend tool built into one tool! The Riko Trend indicator is good for any trader, suitable for any trader for both forex and binary options. You don’t need to configure anything, everything is perfected by time and experience, it works great during a flat and in a trend. The Riko Trend indicator is a technical analysis tool for financial markets that reflects the current price f
Description : Rainbow EA MT5 is a simple Expert advisor based on   Rainbow MT5 indicator witch is based on Moving average with period 34. The indicator is incorporated in the EA, therefore, it is not required for the EA to operate, but if you wish, you can download it from   my product page . The Expert Advisor settings are as follows : Suitable for Timeframes up to H1 The parameters below can be set according to your trading rules. StopLoss ( Stop Loss in pips) TakeProfit ( Take Profit in pips
Crash 1000 Scalping Indicator for the Crash 1000 Deriv Synthetic Index. Introduction The Crash 1000 Scalping Indicator is a specialized tool designed for the Crash 1000 index on the Deriv Synthetic market. This indicator is particularly useful for scalping on the M1 timeframe, helping traders to identify precise entry and exit points for buy positions. It is designed to be non-repainting, providing clear signals with audible alerts and push notifications, and is compatible with mobile devices th
これはほぼ間違いなく、MetaTraderプラットフォームで見つけることができる最も完全な調和価格形成自動認識インジケーターです。 19種類のパターンを検出し、フィボナッチプロジェクションをあなたと同じように真剣に受け止め、潜在的逆転ゾーン(PRZ)を表示し、適切なストップロスとテイクプロフィットレベルを見つけます。 [ インストールガイド | 更新ガイド | トラブルシューティング | よくある質問 | すべての製品 ] 19の異なる調和価格形成を検出します プライマリ、派生および補完フィボナッチ投影(PRZ)をプロットします 過去の価格行動を評価し、過去のすべてのパターンを表示します この指標は、独自の品質とパフォーマンスを分析します 適切なストップロスとテイクプロフィットのレベルを表示します ブレイクアウトを使用して適切な取引を通知します すべてのパターン比をグラフにプロットします 電子メール/音声/視覚アラートを実装します スコット・M・カーニーの本に着想を得て、この指標は最も純粋で急を要するトレーダーのニーズを満たすように設計されています。ただし、トレードを容易にする
MT4版  |  FAQ Owl Smart Levels Indicator は、 Bill Williams の高度なフラクタル、市場の正しい波構造を構築する Valable ZigZag、エントリの正確なレベルをマークする Fibonacci レベルなどの一般的な市場分析ツールを含む 1 つのインジケーター内の完全な取引システムです。 利益を得るために市場と場所に。 戦略の詳細な説明 インジケータを操作するための指示 顧問-取引助手 プライベートユーザーチャット ->購入後に私に書いて、私はプライベートチャットにあなたを追加し、あなたはそこにすべてのボーナスをダウンロードすることができます 力はシンプルさにあります! Owl Smart Levels 取引システムは非常に使いやすいので、専門家にも、市場を勉強し始めて自分で取引戦略を選択し始めたばかりの人にも適しています。 戦略と指標に秘密の数式や計算方法が隠されているわけではなく、すべての戦略指標は公開されています。 Owl Smart Levels を使用すると、取引を開始するためのシグナルをすばやく確認し、注文を出すための
Volality Index scalper indicator  Meant for Volality pairs such as Volality 10, 25, 50, 75 and 100 The indicator works on all timeframes from the 1 minute to the monthly timeframe the indicator is non repaint the indicator has 3 entry settings 1 color change on zero cross 2 color change on slope change 3 color change on signal line cross Orange line is your sell signal Blue line is your buy signal.
STRICTLY FOR BOOM INDEX ONLY!!!!! Here I bring the Maximum Trend Arrows OT1.0 MT5 indicator. This indicator is made up of a combination of different trend indicators for entries and exits, for entries an orange arrow will paint on the chart below the current market and a red flag for closing of trades and it produces buy arrows only. When the orange arrow appears, it will appear along with it's sound to notify you. The 1H timeframe is recommended, don't use it anywhere else than on the 1H timefr
The new update makes this indicator a complete tool for studying, analyzing and operating probabilistic patterns. It includes: On-chart Multi-asset percentage monitor. Configurable martingales. Twenty-one pre-configured patterns, including Mhi patterns and C3. An advanced pattern editor to store up to 5 custom patterns. Backtest mode to test results with loss reports. Trend filter. Hit operational filter. Martingale Cycles option. Various types of strategies and alerts. Confluence between patter
Introducing the Power Trade Plus indicator designed by a small group of traders with a few years of experience trading the market profitably.  The Power Trade Plus is derived from the Power Trade indicator,  the indicator strive in powerful sniper entries and take profit levels,  with an algorithm that's can determine the markets volatility and Provides entries based on the current market volatility. This indicator is much more effective in stock ,currencies and indices.
The  SuperTrend Advance Trading  is a widely-used technical indicator based on  SuperTrend Strategy + Price Action + EMA . How it works: -  Buy/Sell Signals  can be generated when the trend reverses, the conditions of Price action, TrendLine and EMA are met. - After the  Signal  appears, be patient and wait until the candle closes, at that time place the order as soon as possible. You may have time to review your entry, consider whether it is a good entry or not. - Carefully review the entry, up
US30NinjaMT5
Satyaseelan Shankarananda Moodley
US30 Ninja is a 5 minute scalping indicator that will let know you when there is a trade set up (buy or sell). Once the indicator gives the trade direction, you can open a trade and use a 30 pip stop loss and a 30 pip to 50 pip take profit. Please trade at own own risk. This indicator has been created solely for the US30 market and may not yield positive results on any other pair. 
Stratos Pali Indicator is a revolutionary tool designed to enhance your trading strategy by accurately identifying market trends. This sophisticated indicator uses a unique algorithm to generate a complete histogram, which records when the trend is Long or Short. When a trend reversal occurs, an arrow appears, indicating the new direction of the trend. Important Information Revealed Leave a review and contact me via mql5 message to receive My Top 5 set files for Stratos Pali at no cost ! Down
An indicator of pattern #31 ("Long Island") from Encyclopedia of Chart Patterns by Thomas N. Bulkowski. The second gap is in the opposite direction. Parameters: Alerts - show alert when an arrow appears   Push - send a push notification when an arrow appears (requires configuration in the terminal) GapSize - minimum gap size in points ArrowType - a symbol from 1 to 17 ArrowVShift - vertical shift of arrows in points   ShowLevels - show levels ColUp - color of an upward line ColDn - color of a d
Introduction The "Two Moving Average Crossover" indicator for MetaTrader 5 (MT5) is a technical analysis tool that displays two moving averages and notifies when the moving averages cross each other. The indicator calculates and plots two moving averages, one of which is faster and the other is slower. When the faster moving average crosses above the slower moving average, it is considered a bullish signal, indicating a potential trend reversal or the start of a new uptrend. Conversely, when th
このプロダクトを購入した人は以下も購入しています
このインジケーターを購入すると、プロ仕様のトレードマネージャーを無料で差し上げます。 まず第一に、このトレーディングシステムがノンリペイント、ノンリドロー、ノンラグのインジケーターであることを強調する価値がある。これにより、手動取引とロボット取引の両方に理想的なものになっています。 オンラインコース、マニュアル、プリセットのダウンロード。 「スマートトレンドトレーディングシステム MT5」は、新規および経験豊富なトレーダー向けにカスタマイズされた包括的なトレーディングソリューションです。10以上のプレミアムインジケーターを組み合わせ、7つ以上の堅実なトレーディング戦略を備えており、多様な市場状況に対応する多目的な選択肢となっています。 トレンドフォロー戦略:トレンドを効果的に乗り越えるための正確なエントリーとストップロス管理を提供します。 リバーサル戦略:潜在的なトレンドの反転を特定し、トレーダーがレンジ相場を活用できるようにします。 スキャルピング戦略:高速で正確なデイトレードおよび短期取引のために設計されています。 安定性:すべてのインジケーターはノンリペイント、ノンリドロー、ノ
このインジケーターを購入された方には、以下の特典を 無料 で提供しています: 各トレードを自動で管理し、ストップロスとテイクプロフィットを設定し、戦略ルールに基づいてポジションを決済する補助ツール 「Bomber Utility」 様々な銘柄に合わせたインジケーターの設定ファイル(セットファイル) 「最小リスク」、「バランスリスク」、「待機戦略」 の3つのモードで使用できる Bomber Utility 用の設定ファイル このトレーディング戦略をすぐに導入・設定・開始できる ステップバイステップのビデオマニュアル ご注意: 上記の特典を受け取るには、MQL5のプライベートメッセージシステムを通じて販売者にご連絡ください。 オリジナルのカスタムインジケーター 「Divergence Bomber(ダイバージェンス・ボンバー)」 をご紹介します。これは、MACDのダイバージェンス(乖離)戦略に基づいた 「オールインワン」型のトレーディングシステム です。 このテクニカルインジケーターの主な目的は、価格とMACDインジケーターの間に発生するダイバージェンスを検出 し、将来の価格の動きを示す
まず第一に、この取引インジケーターは再描画されず、再描画されず、遅延しないことを強調する価値があります。これにより、手動取引とロボット取引の両方に理想的なものになります。 ユーザーマニュアル:設定、入力、戦略。 アトミックアナリストは、価格の強さとモメンタムを利用して市場でより良いエッジを見つけるためのPA価格アクションインジケーターです。ノイズや誤ったシグナルを除去し、取引ポテンシャルを高めるための高度なフィルターを備えています。複雑なインジケーターの複数のレイヤーを使用して、アトミックアナリストはチャートをスキャンし、複雑な数学的計算をシンプルなシグナルと色に変換します。これにより、どのような初心者トレーダーでも理解して使用し、一貫した取引の決定を行うことができます。 「アトミックアナリスト」は、新規および経験豊富なトレーダー向けにカスタマイズされた包括的な取引ソリューションです。プレミアムインジケーターとトップノッチの機能を1つの取引戦略に組み合わせ、すべてのタイプのトレーダーにとって汎用性のある選択肢にします。 デイリートレーディングとスキャルピング戦略:高速で正確なデイ
Entry In The Zone and SMC Multi Timeframe は、Smart Money Concepts(SMC)に基づいて開発された リアルタイム市場分析ツール です。 本システムは、トレーダーがマーケットストラクチャーを体系的に分析し、市場全体の方向性をより明確に把握できるよう設計されています。 システムは複数の時間軸にわたり、 反転ポイント(Reversal Points)・主要ゾーン(Key Zones)・マーケットストラクチャー を自動的に解析します。さらに、 POI(Point of Interest)・ノーリペイントシグナル・Auto Fibonacci Levels を表示し、プルバックや反転ポイントを高精度で検出します。 リアルタイムシグナルとアラートにより、価格が主要ゾーンに到達したときや、ゾーン内で反転シグナルが発生した際に、重要な機会を逃すことはありません。 また、本システムは インジケーター と シグナルシステム の両方の機能を兼ね備えた 2-in-1ツール であり、ゾーン分析とリアルタイムエントリーシグナルを一体化しています。 さらに
SuperScalp Pro — 高度なマルチフィルター対応スキャルピングインジケーターシステム SuperScalp Pro は、クラシックな Supertrend と複数のインテリジェントな確認フィルターを組み合わせた高度なスキャルピング用インジケーターシステムです。M1〜H4 のすべての時間足で効率的に機能し、特に XAUUSD、BTCUSD、および主要なFX通貨ペアに適しています。単体のシステムとして、また既存の取引戦略へ柔軟に統合して使用できます。 本インジケーターは 11 以上のフィルターを統合しており、短期・長期の EMA、トレンド判定に用いる 3 本の EMA、EMA スロープ(EMA slope)、RSI、ADX、出来高、VWAP、ボリンジャーバンドのブレイクアウト、MACD ダイバージェンスフィルターなどを含みます。スマートキャンドルフィルターはローソク足の終値を確認して弱いシグナルを排除し、3 本の EMA と MACD ダイバージェンスを組み合わせたトレンド認識メカニズムにより勝率の高いシグナルの選別を支援します。 SuperScalp Pro は ATR に基
FX Power: 通貨の強弱を分析して、より賢い取引を実現 概要 FX Power は主要通貨と金の実際の強弱をあらゆる市場状況で理解するための必須ツールです。強い通貨を買い、弱い通貨を売ることで、 FX Power は取引の意思決定を簡素化し、高い確率の取引機会を見出します。トレンドを追従する場合でも、極端なデルタ値を使用して反転を予測する場合でも、このツールはあなたの取引スタイルに完全に適応します。ただ取引するだけではなく、 FX Power で賢く取引をしましょう。 1. なぜ FX Power がトレーダーにとって非常に有益なのか 通貨と金のリアルタイム強弱分析 • FX Power は主要通貨と金の相対的な強弱を計算し、マーケットダイナミクスに関する明確な洞察を提供します。 • どの資産がリードしているか、または後れを取っているかを監視して、取引するペアを賢く選びましょう。 マルチタイムフレームの包括的なビュー • 短期、中期、長期のタイムフレームで通貨と金の強弱を追跡し、マーケットトレンドに基づいて取引戦略を調整できます。 • スキャルピングからスイングトレード
Azimuth Pro
Ottaviano De Cicco
5 (1)
発売プロモーション Azimuth Proは先着100名様限定で 299ドル でご提供します。最終価格は 499ドル となります。 リテールとインスティテューショナルのエントリーの違いはインジケーターではなく、ロケーションにあります。 多くのトレーダーは、モメンタムを追いかけたり、遅行シグナルに反応して、任意の価格レベルでエントリーします。機関投資家は、需給が実際にシフトする構造的なレベルに価格が到達するのを待ちます。 Azimuth Proはこれらのレベルを自動的にマッピングします:スイングアンカーVWAP、マルチタイムフレーム構造ライン、高確率ロケーションにのみ出現するABCパターン。 Azimuth Proは、構造分析とインテリジェントな自動化の両方を求めるプロフェッショナルトレーダー向けに構築されています。 Azimuthが外科的精度で市場構造をマッピングする一方、Azimuth Proはインテリジェンスレイヤーを追加します:トレーディングスタイルの自動検出、スマート設定された移動平均線、20年のデータでバックテストされた最適化パラメータ。その結果、お使いの銘柄と
Quantum Trend Sniper
Bogdan Ion Puscasu
4.74 (53)
ご紹介   クォンタム トレンド スナイパー インジケーターは 、トレンド反転を特定して取引する方法を変革する画期的な MQL5 インジケーターです。 13年以上の取引経験を持つ経験豊富なトレーダーのチームによって開発されました。     クォンタムトレンドスナイパーインジケーター   は、非常に高い精度でトレンドの反転を識別する革新的な方法で、あなたのトレーディングの旅を新たな高みに押し上げるように設計されています。 ***Quantum Trend Sniper Indicatorを購入すると、Quantum Breakout Indicatorを無料で入手できます!*** クォンタム ブレイクアウト インジケーターは、トレンドの反転を特定するとアラートを発し、矢印を示し、3 つのテイクプロフィットレベルを提案します。 初心者トレーダーにもプロのトレーダーにも適しています。 量子EAチャネル:       ここをクリック MT4のバージョン:       ここをクリック 推奨事項: 期間:すべての時間枠。最良の結果を得るには、M15、M30、H1 のタイムフ
無料の AUX インジケーターと EA サポ   直接ダウンロード — ここをクリック [ D.I.C.E ] The DICE Indicator Divergence in Chaos Environment は、エリオット波動理論とトレーディングカオス手法を組み合わせて使用するトレーダーのために設計された MT5 専用ツールです。価格変動の中の隠れたおよび通常のダイバージェンスを検出し、ビル・ウィリアムズが説明したカオス市場環境と同期します。 主な特徴 エリオット波動に対応したダイバージェンス検出:波動構造と調和した強気・弱気ダイバージェンスを識別。 カオス手法の統合:AO(オーサムオシレーター)と市場構造に整合。 マルチタイムフレームスキャン:異なる時間枠でダイバージェンスを分析し、トレンドの転換を確認。 視覚的アラートとオブジェクト:チャート上の矢印、ライン、マーカーで即座に識別。 市場適応読解:カオス的状況に自動適応し、ノイズを除去して有効なセットアップを維持。 ブレイクプルバックエントリー手法:シンプルなフィボナッチリトレースメントとピボットポイントを使用。 利点 ダイ
スイングトレーディング は、トレンドの方向のスイングと可能な反転スイングを検出するように設計された最初のインジケーターです。トレーディングの文献で広く説明されているベースラインスイングトレーディングアプローチを使用します。インディケータは、いくつかの価格と時間のベクトルを調査して、全体的なトレンドの方向を追跡し、市場が売られ過ぎまたは買われ過ぎて修正の準備ができている状況を検出します。 [ インストールガイド | 更新ガイド | トラブルシューティング | よくある質問 | すべての製品 ] むち打ちを起こさずに市場スイングの利益 インジケーターは常にトレンドの方向を表示します 色付きの価格帯は機会のベースラインを表します 色付きのダッシュは、可能な反転スイングを表します この指標は、独自の品質とパフォーマンスを分析します 複数時間枠のダッシュボードを実装します カスタマイズ可能なトレンドおよびスイング期間 電子メール/サウンド/プッシュアラートを実装します インジケータは再描画またはバックペインティングではありません Swing Tradingとは Swing Tradingは
優れたテクニカルインジケーター「Grabber」をご紹介します。これは、すぐに使える「オールインワン」トレーディング戦略として機能します。 ひとつのコードに、市場のテクニカル分析ツール、取引シグナル(矢印)、アラート機能、プッシュ通知が強力に統合されています。 このインジケーターを購入された方には、以下の特典を無料で提供します: Grabberユーティリティ:オープンポジションを自動で管理するツール ステップバイステップのビデオマニュアル:インジケーターのインストール、設定、取引方法を解説 カスタムセットファイル:インジケーターをすばやく自動設定し、最大限の成果を出すための設定ファイル 他の戦略はもう忘れてください!Grabberだけが、あなたを新たなトレードの高みへと導いてくれるのです。 Grabber戦略の主な特徴: 推奨タイムフレーム:M5〜H4 対応通貨ペア・資産:どれでも使用可能ですが、私が実際に検証した以下を推奨します(GBPUSD、GBPCAD、GBPCHF、AUDCAD、AUDUSD、AUDSGD、AUDCHF、NZDUSD、NZDCAD、EURCAD、EURUSD、E
Super Signal – Skyblade Edition プロ仕様のノンリペイント / ノーラグ・トレンドシグナルシステム。卓越した勝率を実現 | MT4 / MT5 対応 1分足、5分足、15分足などの低い時間足で最も効果を発揮します。 主な特徴: Super Signal – Skyblade Edition は、トレンド取引に特化したスマートなシグナルシステムです。マルチレイヤーのフィルターロジックを用いて、明確な方向性と実際のモメンタムに支えられた強力なトレンドのみを検出します。 このシステムは 天井や底を予測するものではありません 。次の3つの条件がすべて満たされた場合にのみシグナルを発生させます: 明確なトレンド方向 モメンタムの増加 健全なボラティリティ構造 市場セッションに基づく流動性分析と組み合わせることで、シグナルの精度とタイミングがさらに向上します。 シグナルの特性: すべての矢印シグナルは 100% 非リペイント / 遅延なし 一度出現したシグナルは固定され、点滅・消失しません チャート上の矢印、情報パネル、ポップアップ通知、音声アラート、プッシュ通知
The Trend Forecaster indicator utilizes a unique proprietary algorithm to determine entry points for a breakout trading strategy. The indicator identifies price clusters, analyzes price movement near levels, and provides a signal when the price breaks through a level. The Trend Forecaster indicator is suitable for all financial assets, including currencies (Forex), metals, stocks, indices, and cryptocurrencies. You can also adjust the indicator to work on any time frames, although it is recommen
Berma Bands
Muhammad Elbermawi
5 (7)
Berma Bands (BBs) インジケーターは、市場のトレンドを特定して活用したいトレーダーにとって貴重なツールです。価格と BBs の関係を分析することで、トレーダーは市場がトレンド段階にあるか、レンジ段階にあるかを判断できます。 詳細については、[ Berma Home Blog ] をご覧ください。 バーマ バンドは、上部バーマ バンド、中部バーマ バンド、下部バーマ バンドの 3 つの異なる線で構成されています。これらの線は価格の周りにプロットされ、全体的な傾向に対する価格の動きを視覚的に表します。これらのバンド間の距離から、ボラティリティや潜在的な傾向の反転についての洞察を得ることができます。 バーマ バンドの線がそれぞれ離れると、市場が横ばいまたはレンジ相場の期間に入っていることを示すことがよくあります。これは、明確な方向性の偏りがないことを示しています。トレーダーは、これらの期間中にトレンドを特定するのが難しいと感じる可能性があり、より明確なトレンドが出現するまで待つ場合があります。 バーマ バンドの線が 1 本の線に収束すると、強いトレンド環境の兆候となること
TPSproTrend PRO は、市場が実際に方向転換する瞬間を識別し、動きの開始時にエントリー ポイントを形成します。 価格が動き始めた直後に市場に参入し、すでに動き出した後に参入してはいけません。 インジケーター   シグナルを再描画せず、エントリーポイント、ストップロス、テイクプロフィットを自動的に表示するため、取引が明確かつ視覚的かつ構造化されます。 説明書 RUS   -   MT4 バージョン 主な利点 再描画のない信号。 すべての信号は固定です。 矢印が表示された場合 -     もう変化したり消えたりすることはありません。 誤ったシグナルのリスクなしに、安定したデータに基づいて取引の決定を下すことができます。 既製の買い/売りエントリーポイント このインジケーターは、取引を開始するのに最適なタイミングを自動的に決定し、チャート上に矢印で表示します。 推測や主観的な分析は不要。明確なシグナルだけです。 自動ストップロスとテイクプロフィットゾーン 信号の直後に次のものが表示されます: エントリーポイント リスク制限ゾーン(ストップロス) 利益確定ゾーン これにより、
もちろんです。以下は、提供いただいたテキストの日本語への翻訳です: MT4用の天文学指標をご紹介します:究極の天体トレーディングコンパニオン トレーディング体験を天空の高みに高める準備はできていますか?私たちの革命的なMT4用の天文学指標をご紹介します。この革新的なツールは、複雑なアルゴリズムの力を借りて、類まれなる天文学的洞察と精密な計算を提供します。 あなたの指先で宇宙の情報を:   宝のような天文学的データが明らかになる包括的なパネルをご覧ください。惑星の地理的/太陽中心座標、太陽と地球の距離、星の大きさ、伸び、星座、黄道座標および赤道座標、さらには水平座標まで、それぞれが綿密に計算され美しく表示されています。指標によって生成される垂直線は時間値に対応し、トレーディングの旅に宇宙の視点を提供します。 惑星のラインと関係:   グラフを飾る惑星のラインの魔法を体験し、スケールと角度をカスタマイズできます。直感的なコントロールパネルを介して各惑星のラインの表示を簡単に切り替えることができます。指定された時刻範囲内での合会、六分会、四分会、三分会、対会、逆行の指標で天体の関係の芸術を発
Trend Ai indicatorは、トレンドの識別と実用的なエントリポイントと反転アラートを組み合わせることで、トレーダーの市場分析を強化する優れたツールです。 この指標は、ユーザーが自信と正確さで外国為替市場の複雑さをナビゲートすることを可能にします トレンドAiインジケーターは、主要なシグナル以外にも、プルバックやリトレースメント中に発生するセカンダリエントリポイントを識別し、トレーダーが確立されたトレンド内の価格修正を活用できるようにします。 重要な利点: *MT4およびMT5の仕事 *明確な買いまたは売りシグナル *再描画しません ·すべての資産で動作します 私はeaやセットをtelegram it詐欺で販売しないように注意してください。 すべての設定はここでブログで無料です。  重要! 指示とボーナスを得るために購入後すぐに私に連絡してください! 私の他のプロダクトと同様、実質操作の監視はここに見つけることができます: https://www.mql5.com/en/users/mechanic/seller&nbsp ; 設定および入力: すべての
Gold Sniper Scalper Proは、MetaTrader 5向けのプロフェッショナルなindicatorで、トレーダーがエントリーポイントを特定し、リスクを効果的に管理するために設計されています。 このindicatorは、シグナル検出システム、Entry/SL/TPの自動管理、ボリューム分析、リアルタイムパフォーマンス統計を含む包括的な分析ツールセットを提供します。 システムを理解するためのユーザーガイド   |   他の言語のユーザーガイド 主な機能 シグナル検出システム このindicatorは、price actionと市場構造の分析に基づいて潜在的なエントリーポイントを自動検出します。トレード機会を検出すると: - BUY(青)またはSELL(赤)の矢印がchart上に表示されます - ローソク足が色付けされ、シグナルゾーンが識別されます - Entry/SL/TPレベルが自動計算されます シグナルは価格がEntryレベルに触れた時のみ発動し、市場に確認されていないシグナルをフィルタリングします。 インテリジェントなEntry/SL/TP管理 - Ent
現在33%オフ 初心者にもエキスパートトレーダーにも最適なソリューション このインジケーターは独自の機能と新しい公式を多数内蔵しており、ユニークで高品質かつ手頃な取引ツールです。このアップデートでは、2つの時間枠ゾーンを表示できるようになります。より長いTFだけでなく、チャートTFとより長いTF(ネストゾーンを表示)の両方を表示できます。すべてのSupply Demandトレーダーの皆さんのお気に召すはずです。:) 重要情報の公開 Advanced Supply Demandの可能性を最大化するには、 https://www.mql5.com/ja/blogs/post/720245 にアクセスしてください。   エントリーまたはターゲットの正確なトリガーポイントを正確に特定できれば取引がどのように改善されるか想像してみてください。新しい基盤となるアルゴリズムに基づいて構築されているため、買い手と売り手の間の潜在的な不均衡をさらに簡単に特定できます。これは、最も強い需要と供給のゾーンと、過去のパフォーマンス(古いゾーンを表示)がグラフィカルに表現されるためです。これらの機能は、最適な
Golden Spike Premium
Kwaku Bondzie Ghartey
5 (1)
Golden Spikes Indicator Technical indicator for synthetic indices trading on M1 timeframe. Compatible with Boom/Crash indices on Deriv platform and Gain/Pain indices on Weltrade platform. send me A private  message to receive trade ASISTANT EA.. booklet guide:  https://drive.google.com/file/d/1knQJqGHZSP5eQN24ndRz2ayZVCst6XhN/view?usp=sharing Also check my premium spikes bot: https://www.mql5.com/en/market/product/142350 Features Uses Parabolic SAR, RSI, and Bollinger Bands analysis Three risk
ARIPoint
Temirlan Kdyrkhan
1 (1)
ARIPoint is a powerful trading companion designed to generate high-probability entry signals with dynamic TP/SL/DP levels based on volatility. Built-in performance tracking shows win/loss stats, PP1/PP2 hits, and success rates all updated live. Key Features: Buy/Sell signals with adaptive volatility bands Real-time TP/SL/DP levels based on ATR Built-in MA Filter with optional ATR/StdDev volatility Performance stats panel (Success, Profit/Loss, PP1/PP2) Alerts via popup, sound, push, or email Cu
Shock Pullback
Suleiman Alhawamdah
5 (1)
簡単に言えば、現在のローソク足の横に「ピップス」として知られる白い数字の動きが現れ始めたら、取引を開始できます。白い「ピップス」は、買いまたは売りの取引が現在アクティブであり、白色で示されるように正しい方向に動いていることを示しています。白いピップスの動きが止まり、静的な緑色に変わったとき、それは現在のモメンタムの終了を示します。数字の緑色は、買いまたは売りの取引から得られた「ピップス」での総利益を表します。 さらに、インジケーター内の他の高度でプロフェッショナルな分析ツールに従って取引を開始することも可能です。インジケーターに表示されるシグナルや色を観察することで、高精度で多数のスキャルピングチャンスを捉えることができます。テスト中またはリアルチャート上でインジケーターの動作を理解しておくことをお勧めします。 ほとんどのFX市場に対応:金(ゴールド)や人気の株価指数市場(ダウ・ジョーンズ、S&P500、ナスダック、DAXなど)、およびEUR/USD、GBP/USD、USD/JPYなどの主要通貨ペアでの取引に最適です。また、ビットコイン、イーサリアム、ステーブルコインなどの主要な暗号
Quantum TrendPulse を ご紹介します。これは、   SuperTrend   、   RSI   、および Stochastic のパワーを 1 つの包括的なインジケーターに組み合わせて、取引の可能性を最大限に引き出す究極の取引ツールです。精度と効率を求めるトレーダー向けに設計されたこのインジケーターは、市場のトレンド、勢いの変化、最適なエントリー ポイントとエグジット ポイントを自信を持って特定するのに役立ちます。 主な特徴: SuperTrend 統合: 現在の市場動向に簡単に追従し、収益性の波に乗ることができます。 RSI精度: 買われすぎと売られすぎのレベルを検出し、市場の反転のタイミングに最適で、SuperTrendのフィルターとして使用されます。 確率的精度: 確率的振動を活用して、変動の激しい市場で隠れたチャンスを見つけます。SuperTrend のフィルターとして使用されます。 マルチタイムフレーム分析:   M5 から H1 または H4 まで、さまざまなタイムフレームで市場を常に把握します。 カスタマイズ可能なアラート: カスタム取引条件が満たされ
まず第一に、この取引ツールはノンリペイント、ノンリドロー、ノンラグの指標であり、プロの取引に理想的ですことを強調する価値があります。 オンラインコース、ユーザーマニュアル、デモ。 スマートプライスアクションコンセプトインジケーターは、新米から経験豊富なトレーダーまで、非常 に強力なツールです。Inner Circle Trader AnalysisやSmart Money Concepts Trading Strategiesなど、20以上の有用な指標を1つに組み合わせています。このインジケーターはスマートマネーコンセプトに焦点を当て、大手機関の取引方法を提供し、彼らの動きを予測するのに役立ちます。 特に、流動性分析に優れており、機関がどのように取引しているかを理解しやすくしています。市場のトレンドを予測し、価格の動きを慎重に分析するのに優れています。機関の戦略とトレードを合わせることで、市場の動向についてより正確な予測ができます。このインジケーターは多目的であり、市場構造を分析し、重要な注文ブロックを特定し、さまざまなパターンを認識するのに優れています。 このインジケーター
FX Volume MT5
Daniel Stein
4.79 (24)
FX Volume:ブローカー視点で捉える本物の市場センチメント クイック概要 トレード手法をさらに高めたいとお考えですか? FX Volume は、リテールトレーダーやブローカーのポジション状況をリアルタイムで提供します。これは、COTのような遅延レポートよりもはるかに早く知ることができます。安定した利益を目指す方も、さらなる優位性を求める方も、 FX Volume は大きな不均衡を見極め、ブレイクアウトを確認し、リスク管理を洗練させるのに役立ちます。今すぐ始めて、実際の出来高データがどのように意思決定を変革するかを体感してください! 1. FX Volume がトレーダーにとって非常に有益な理由 高精度の早期警戒シグナル • 各通貨ペアを売買しているトレーダー数を、他者よりも早く、ほぼリアルタイムで把握できます。 • FX Volume は、複数のリテールブローカーから得られる本物の出来高データを収集し、分かりやすい形式で提供する 唯一 のツールです。 強力なリスク管理 • ロングやショートの大きな偏り(インバランス)を特定し、潜在的なトレンド転換を見逃しません。ストップ
Gartley Hunter Multi - An indicator for searching for harmonic patterns simultaneously on dozens of trading instruments and on all possible timeframes. Manual (Be sure to read before purchasing) | Version for MT4 Advantages 1. Patterns: Gartley, Butterfly, Shark, Crab. Bat, Alternate Bat, Deep Crab, Cypher 2. Simultaneous search for patterns on dozens of trading instruments and on all possible timeframes 3. Search for patterns of all possible sizes. From the smallest to the largest 4. All fou
Was: $249  Now: $99   Market Profile defines a number of day types that can help the trader to determine market behaviour. A key feature is the Value Area, representing the range of price action where 70% of trading took place. Understanding the Value Area can give traders valuable insight into market direction and establish the higher odds trade. It is an excellent addition to any system you may be using. Inspired by Jim Dalton’s book “Mind Over Markets”, this indicator is designed to suit the
Was: $299  Now: $99  Supply Demand uses previous price action to identify potential imbalances between buyers and sellers. The key is to identify the better odds zones, not just the untouched ones. Blahtech Supply Demand indicator delivers functionality previously unavailable on any trading platform. This 4-in-1 indicator not only highlights the higher probability zones using a multi-criteria strength engine, but also combines it with multi-timeframe trend analysis, previously confirmed swings a
MetaForecast M5
Vahidreza Heidar Gholami
5 (3)
MetaForecastは、価格データのハーモニクスに基づいて、どんな市場の未来を予測し視覚化します。市場が常に予測可能ではありませんが、価格にパターンがある場合、MetaForecastは可能な限り正確な未来を予測できます。他の類似製品と比較して、MetaForecastは市場のトレンドを分析することでより正確な結果を生成することができます。 入力パラメータ Past size (過去のサイズ) MetaForecastが将来の予測を生成するために使用するバーの数を指定します。モデルは選択したバー上に描かれた黄色の線で表されます。 Future size (将来のサイズ) 予測すべき将来のバーの数を指定します。予測された将来は、ピンクの線で表示され、その上に青い回帰線が描かれます。 Degree (程度) この入力は、MetaForecastが市場で行う分析のレベルを決定します。 Degree 説明  0 Degree 0の場合、価格の全てのピークや谷、そして詳細をカバーするために、「Past size」の入力に大きな値を使用することが推奨されています。  1 (推奨) Degre
Rtc ML Ai | Predictor CORE MACHINE LEARNING ENGINE Adaptive ML Market Predictor – Multi-Bar Trend & Candle Forecast What This Indicator Does This indicator is a  real-time market prediction engine  designed to analyze price behavior and estimate  future market tendencies . Unlike conventional indicators, this system  does not rely on static parameters or historical curve-fitting , but adapts its internal state dynamically during live market operation. Instead of using static rules, the indic
作者のその他のプロダクト
Elder Impulse System
Financial Trading Seminars Inc.
インパルスシステムは、「Come into myTradingRoom」の本で最初に説明されました。 MACDヒストグラムと価格の指数移動平均(EMA)の両方の方向を使用して、インパルスを定義します。 ルールは衝動に逆らって取引することは決してありません。 そのカラーコードはあなたにいくつかの信号を与えます: EMAとMACD-ヒストグラムの両方が上昇している場合、インパルスシステムはバーの色を緑色にします(短絡は許可されません)。 EMAとMACD-ヒストグラムの両方が低下している場合、インパルスシステムはバーの色を赤に着色します(購入は許可されていません)。 EMAとMACD-ヒストグラムが異なる方向を指している場合、インパルスシステムはバーの色をシアンに着色します(長くても短くてもかまいません)。 パラメーター: MACD_Short_Length (12)–MACD計算用の短いEMA。 MACD_Long_Length (26)–MACD計算用の長いEMA。 MACD_Smoothing_Length (9)–信号線の平滑化値。 Short_EMA_Length (13)
Elder Impulse Release
Financial Trading Seminars Inc.
The purpose of Impulse Release is to prevent trading in the wrong direction. While the Impulse System operates in a single timeframe, Impulse Release is based on two timeframes. It tracks both the longer and the shorter timeframes to find when the Impulse points in the same direction on both. Its color bar flashes several signals: If one timeframe is in a buy mode and the other in a sell mode, the signal is "No Trade Allowed", a  black bar. If both are neutral, then any trades are allowed, showi
Elder MACD Combo
Financial Trading Seminars Inc.
MACD Histogram tracks the difference between the MACD line and the Signal line (which is the exponential moving average of the first line). For better visibility, when plotting the lines and the histogram in the same window, we scale up the histogram by a factor of 2. Furthermore, we use two separate plots for the histogram, which allows us to color-code the bars for upticks and downticks. The MACD Combo overlays MACD lines on MACD Histogram. Putting both plots in the same window enables you to
Elder Chandelier Long Exit
Financial Trading Seminars Inc.
The Chandelier Exit, introduced by Charles LeBeau, is described in "Come into My Trading Room" book. It calculates each stop on a long position in an uptrend from the highest point reached during that rally, and gets its name from the chandelier, which hangs from the highest point in the room. The Chandelier Exit uses a multiple of the Average True Range (ATR), subtracting it from the highest high since the trade was entered. It creates a new trade whenever the previous trade is stopped out. Cha
One of the key rules in trading is never move your stops in such a way that your risk increases. Our stop sequence shows the automatic tightening of stops. They appear as a series of decreasing risk points until the trade is eventually stopped out. The problem is that if you enter a trade at any other point than the initial dot of the sequence, you may be placing the stop too close. Stop-entry plots show you the initial value for the stop for each bar. You can use them when you put on a trade, a
The Chandelier Exit, introduced by Charles LeBeau, is described in "Come into My Trading Room" book. It calculates each stop on a short position in a downtrend from the lowest point reached during that decline. The Chandelier Exit uses a multiple of the Average True Range (ATR), adding it to the lowest low since the trade was entered. It creates a new trade whenever the previous trade is stopped out. Chandelier Stops differ from traditional stops by having the ability to move against you if the
One of the key rules in trading is never move your stops in such a way that your risk increases. Our stop sequence shows the automatic tightening of stops. They appear as a series of decreasing risk points until the trade is eventually stopped out. The problem is that if you enter a trade at any other point than the initial dot of the sequence, you may be placing the stop too close. Stop-entry plots show you the initial value for the stop for each bar. You can use them when you put on a trade, a
Elder ray
Financial Trading Seminars Inc.
Elder-Ray is made of both Bulls Power and Bears Power as described in "Come into my Trading Room" book. It is tracking the relative power of bulls and bears by measuring how far the high and the low of each bar get away from the average price. Elder-ray is an indicator developed by Dr. Elder and named for its similarity to x-rays. It shows the structure of bullish and bearish power below the surface of the markets. Elder-ray combines a trendfollowing moving average with two oscillators to show w
Elder MACD XOver
Financial Trading Seminars Inc.
The MACD XOver indicator was developed by John Bruns to predict the price point at which MACD Histogram will reverse the direction of its slope. The indicator is plotted one day ahead into the future, allowing, if your strategy depends on MACD Histogram, to predict its reversal point for tomorrow (or the next bar in any timeframe). If the closing price tomorrow is above the value of this indicator, then MACD Histogram will tick up. If the closing price tomorrow is below the value of this indicat
Elder Market Thermometer
Financial Trading Seminars Inc.
The Market Thermometer is described in "Come into my Trading Room" book.  It measures the degree of volatility, as reflected in greater or smaller intraday ranges. When the Market Temperature spikes above its average or stays below its average for a number of days, it gives trading signals, as described in the book. Parameters: Thermometer_EMA_Length (22) – The length of the moving average of the Market Temperature. The default 22, the average number of trading days in a month. Spike_Alert_Facto
Elder SafeZone Long
Financial Trading Seminars Inc.
SafeZone is a method for setting stops on the basis of recent volatility, outside the level of market noise. It is described in "Come into my Trading Room" book. In an uptrend, SafeZone defines noise as that portion of the current bar that extends below the low of the previous bar, going against the prevailing trend. It averages the noise level over a period of time and multiplies it by a trader-selected factor. For long trades, SafeZone subtracts the average noise level, multiplied by a factor
One of the key rules in trading is never move your stops in such a way that your risk increases. Our stop sequence shows the automatic tightening of stops. They appear as a series of decreasing risk points until the trade is eventually stopped out. The problem is that if you enter a trade at any other point than the initial dot of the sequence, you may be placing the stop too close. Stop-entry plots show you the initial value for the stop for each bar. You can use them when you put on a trade,
Elder SafeZone Short
Financial Trading Seminars Inc.
SafeZone is a method for setting stops on the basis of recent volatility, outside the level of market noise. It is described in "Come into my Trading Room" book. In a downtrend, SafeZone defines noise as the portion of the current bar that extends above the high of the previous bar, against the downtrend. It averages the noise level over a period of time and multiplies it by a trader-selected factor. For short trades, it adds the average noise level, multiplied by a factor, to the latest high t
One of the key rules in trading is never move your stops in such a way that your risk increases. Our stop sequence shows the automatic tightening of stops. They appear as a series of decreasing risk points until the trade is eventually stopped out. The problem is that if you enter a trade at any other point than the initial dot of the sequence, you may be placing the stop too close. Stop-entry plots show you the initial value for the stop for each bar. You can use them when you put on a trade,
Elder Smoothed ROC
Financial Trading Seminars Inc.
The Smoothed ROC indicator, developed by Fred Schutzman, is described in "Trading for a Living" book. It is created by calculating the rate of change for an exponential moving average of closing prices. When it changes direction, it helps identify and confirm trend changes. Parameters Smoothing_EMA_Length (13) – The length of the EMA used for smoothing; ROC_Period (21) – The length of the rate of change calculation.
フィルタ:
Алексей Маврин
35
Алексей Маврин 2022.06.12 05:58 
 

Добрый день, Александр. После обновления mt5 перестали работать ваши индикаторы MACD и Force index. Первый обновил до последней версии и всё заработало, а вот индекс силы последний раз обновлялся в 2017г. и не может быть использован. Просьба обновить (перекомпилировать) до актуальной версии mt5. Заранее спасибо. "2022.01.30 17:26:53.490 MQL5 'Elder Force Index With ATR Channels.ex5' version is too old, it should be recompiled"

レビューに返信