Simple GMMA MT5
- インディケータ
-
Yuto Tokuhara
 MQL4 / MQL5 / Python Engineer.
I mainly trade Forex pairs and commodities. - バージョン: 0.1
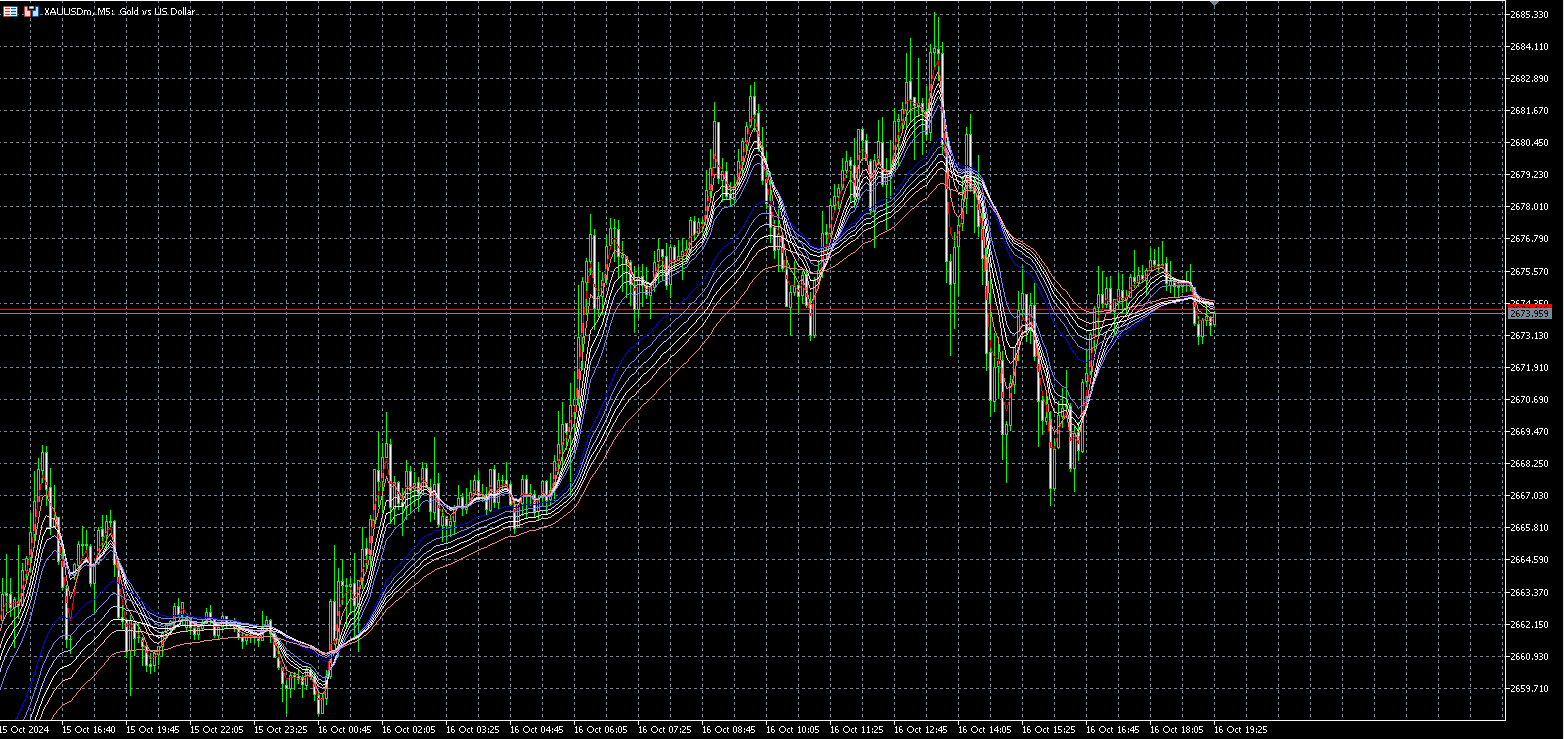
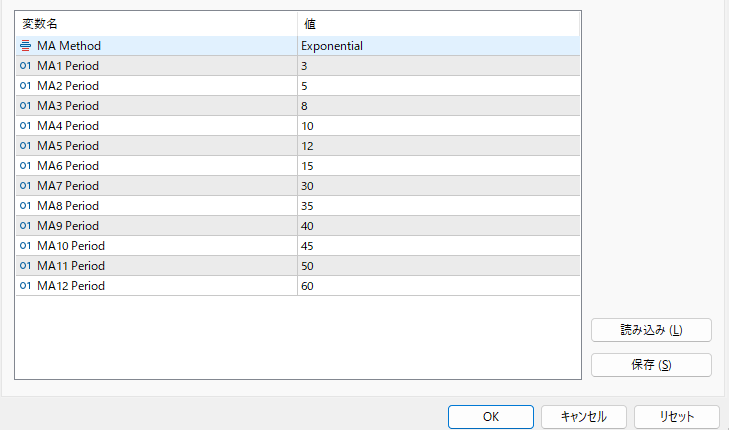
This is a very simple multiple moving average indicator.
It can display 12 moving averages.
The time axis of the moving averages can be changed in the input field of the indicator.
The process is faster than the 12 moving averages included with MT5.
We also have a buffer set up so you can access it from an Expert Advisor.
*For advanced users.
If you have any questions or requests, please message me.
Thank you.
MT4 Version: https://www.mql5.com/en/market/product/122857