SX Currency Strength MT4

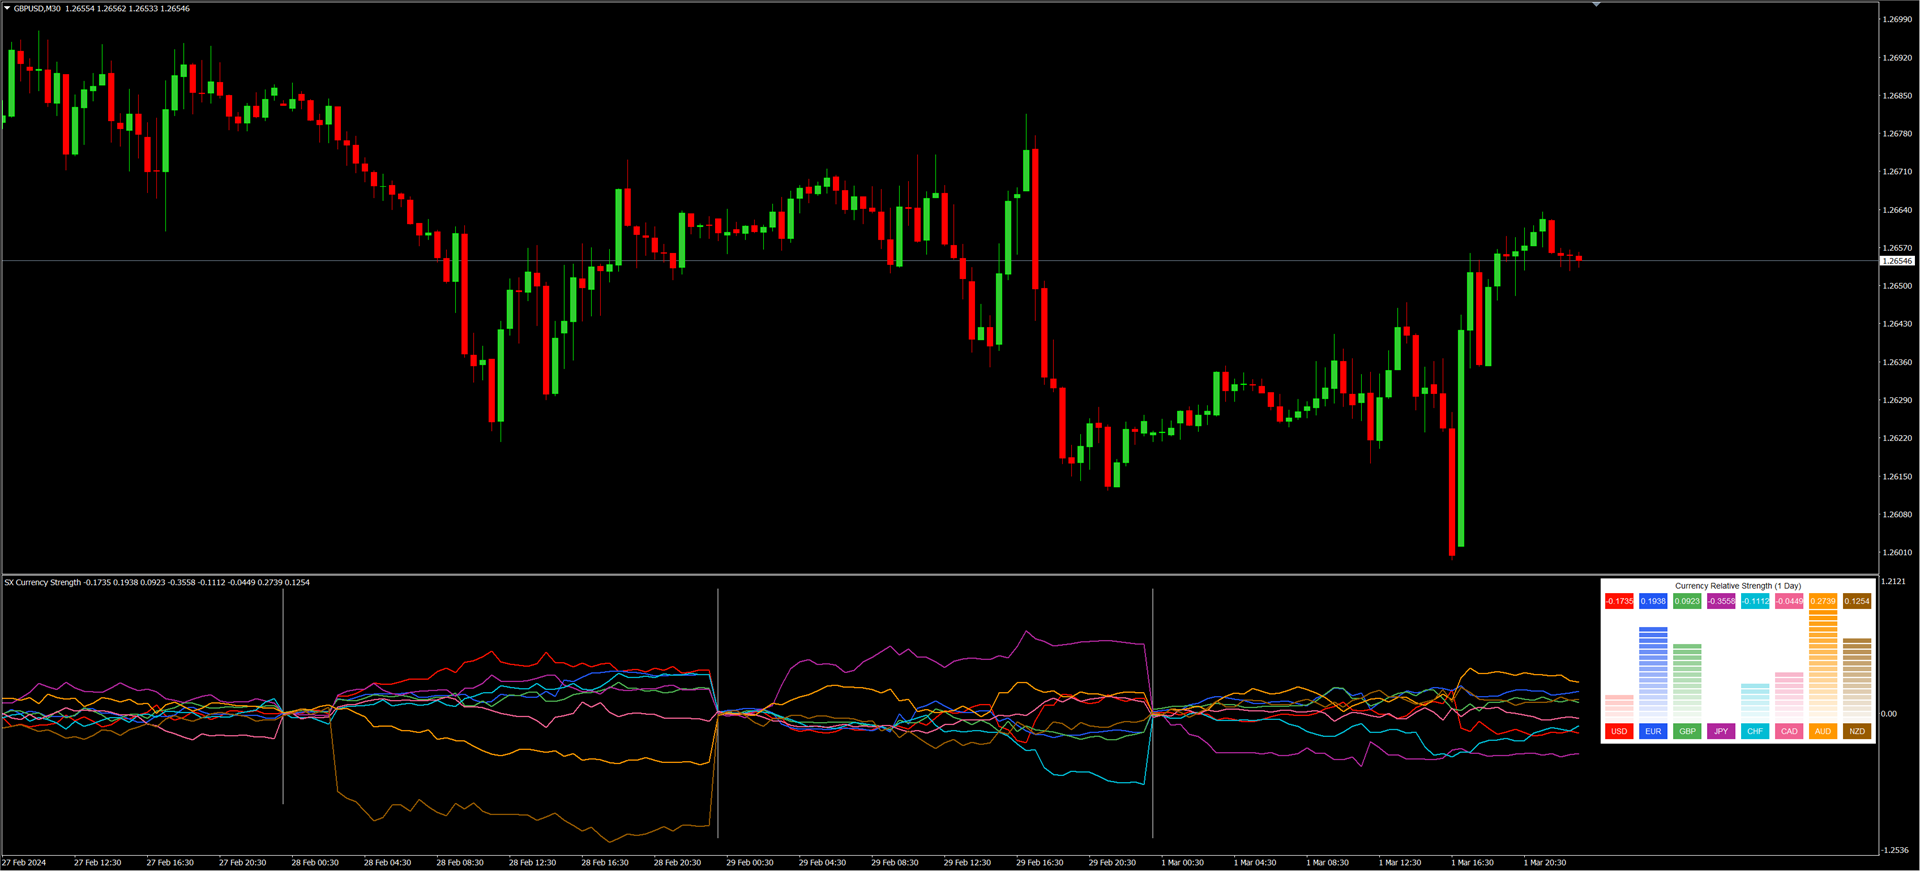
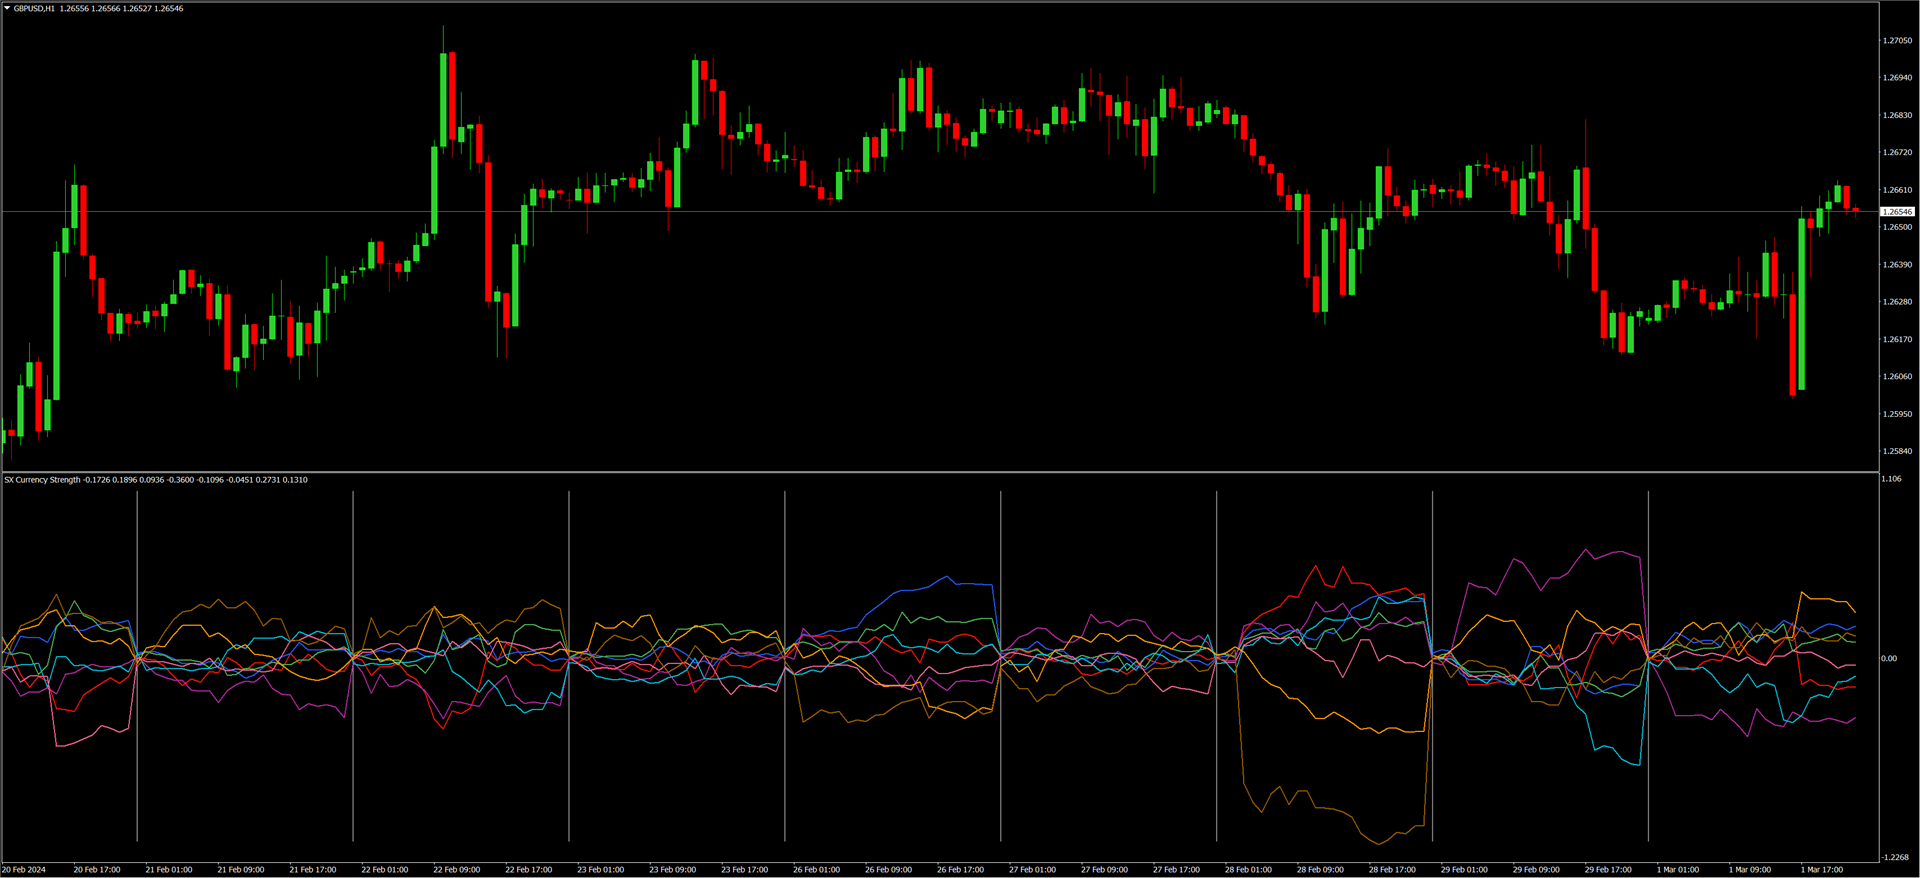
SX Currency Strength indicator allows users to analyze currency strength through a selected period, with results resetting periodically and accumulating thereafter.

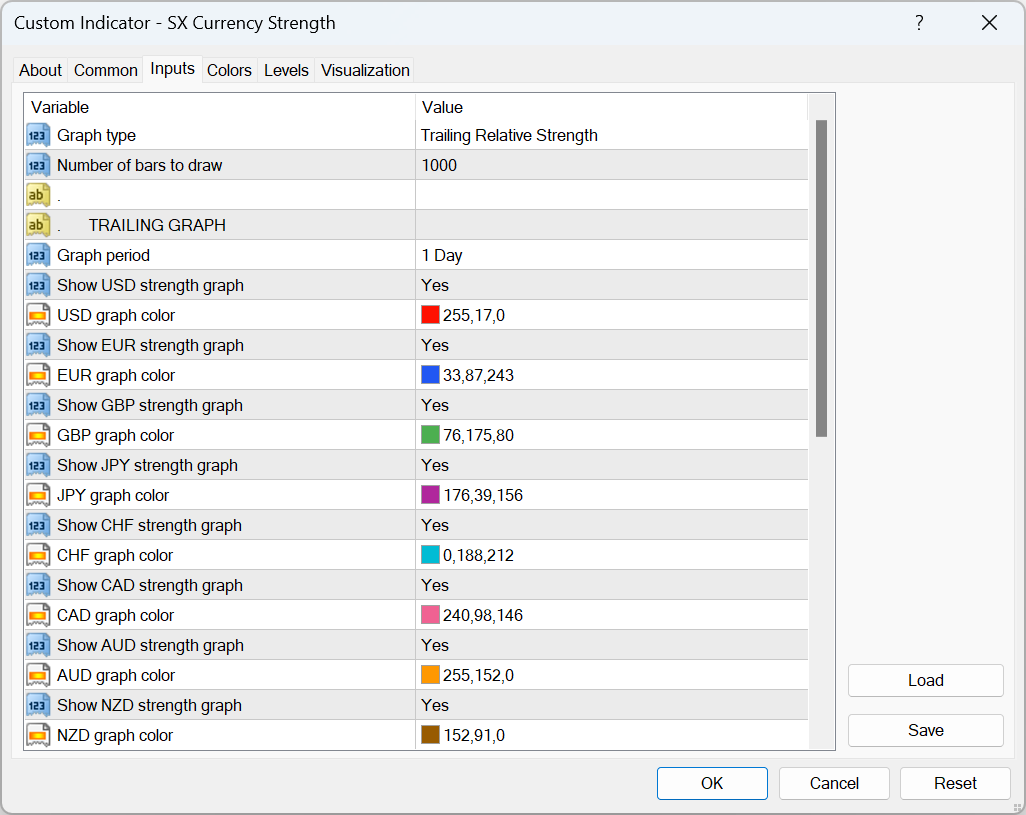
It displays the historical relative strength of eight major currencies (USD, EUR, GBP, JPY, AUD, CHF, CAD and NZD) across a selected timeframe. Assessing a currency's relative strength aids in evaluating its performance against a basket of other currencies.

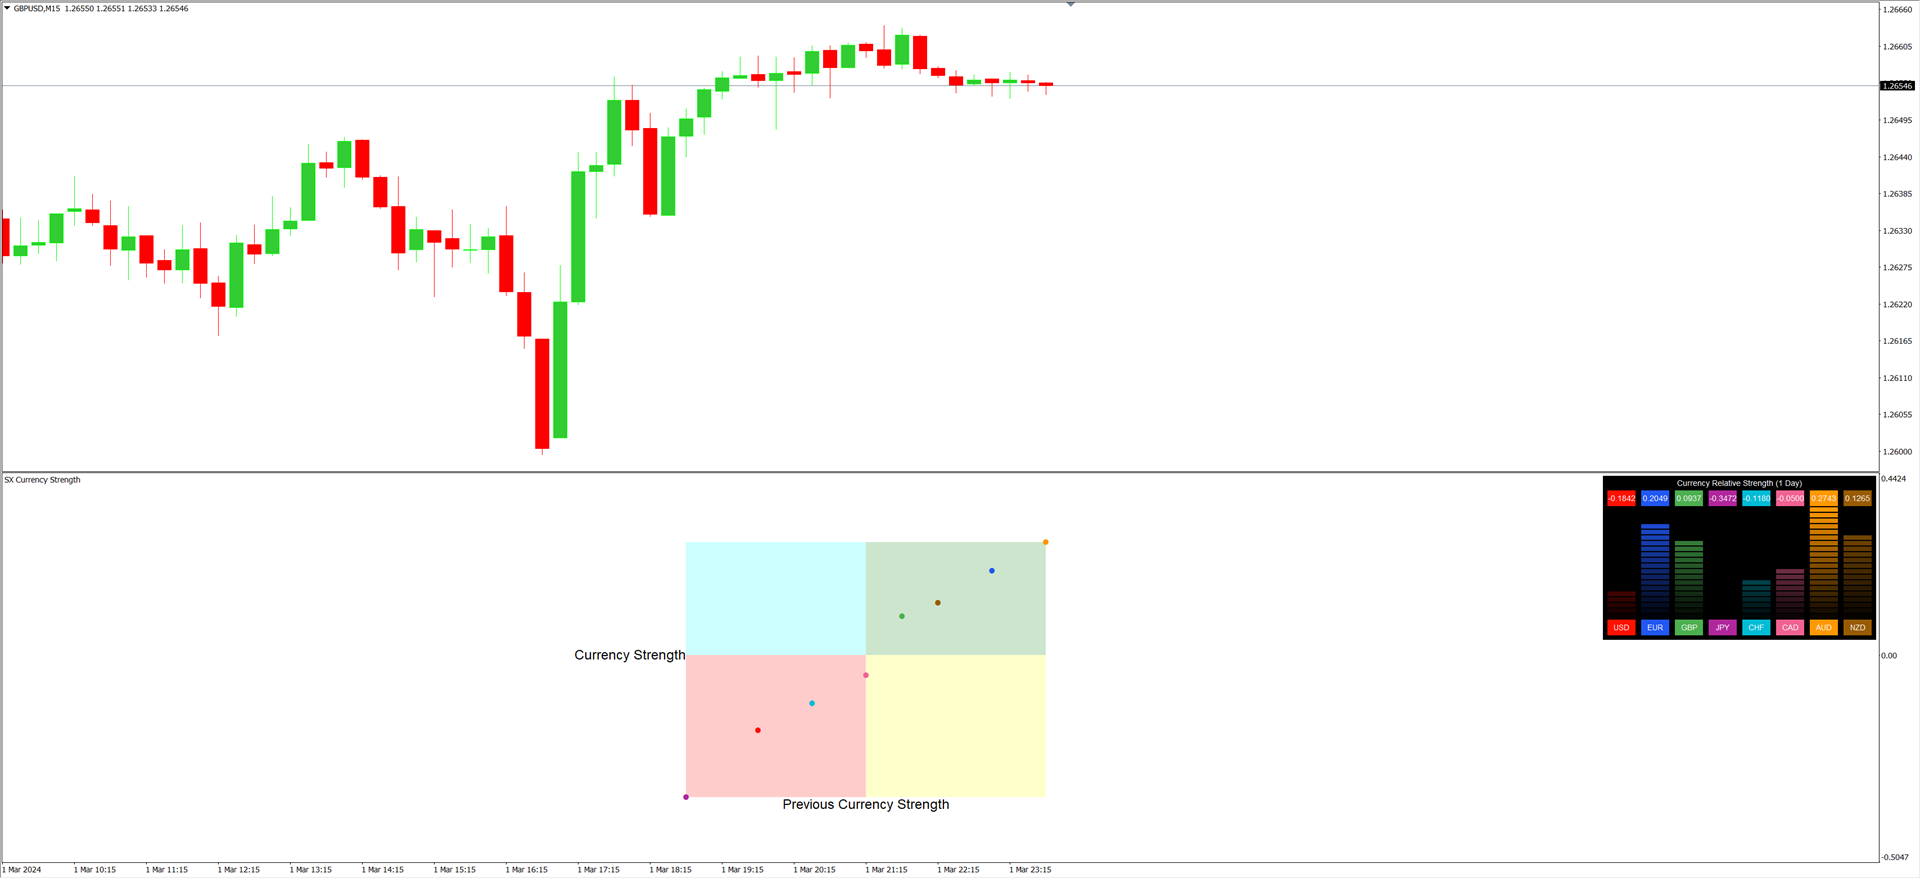
Users can select to visualize relative strength of the currencies in the shape of a scatter plot, offering deeper insights into currency performance evolution.

Modules:

The indicator consists of 3 modules:

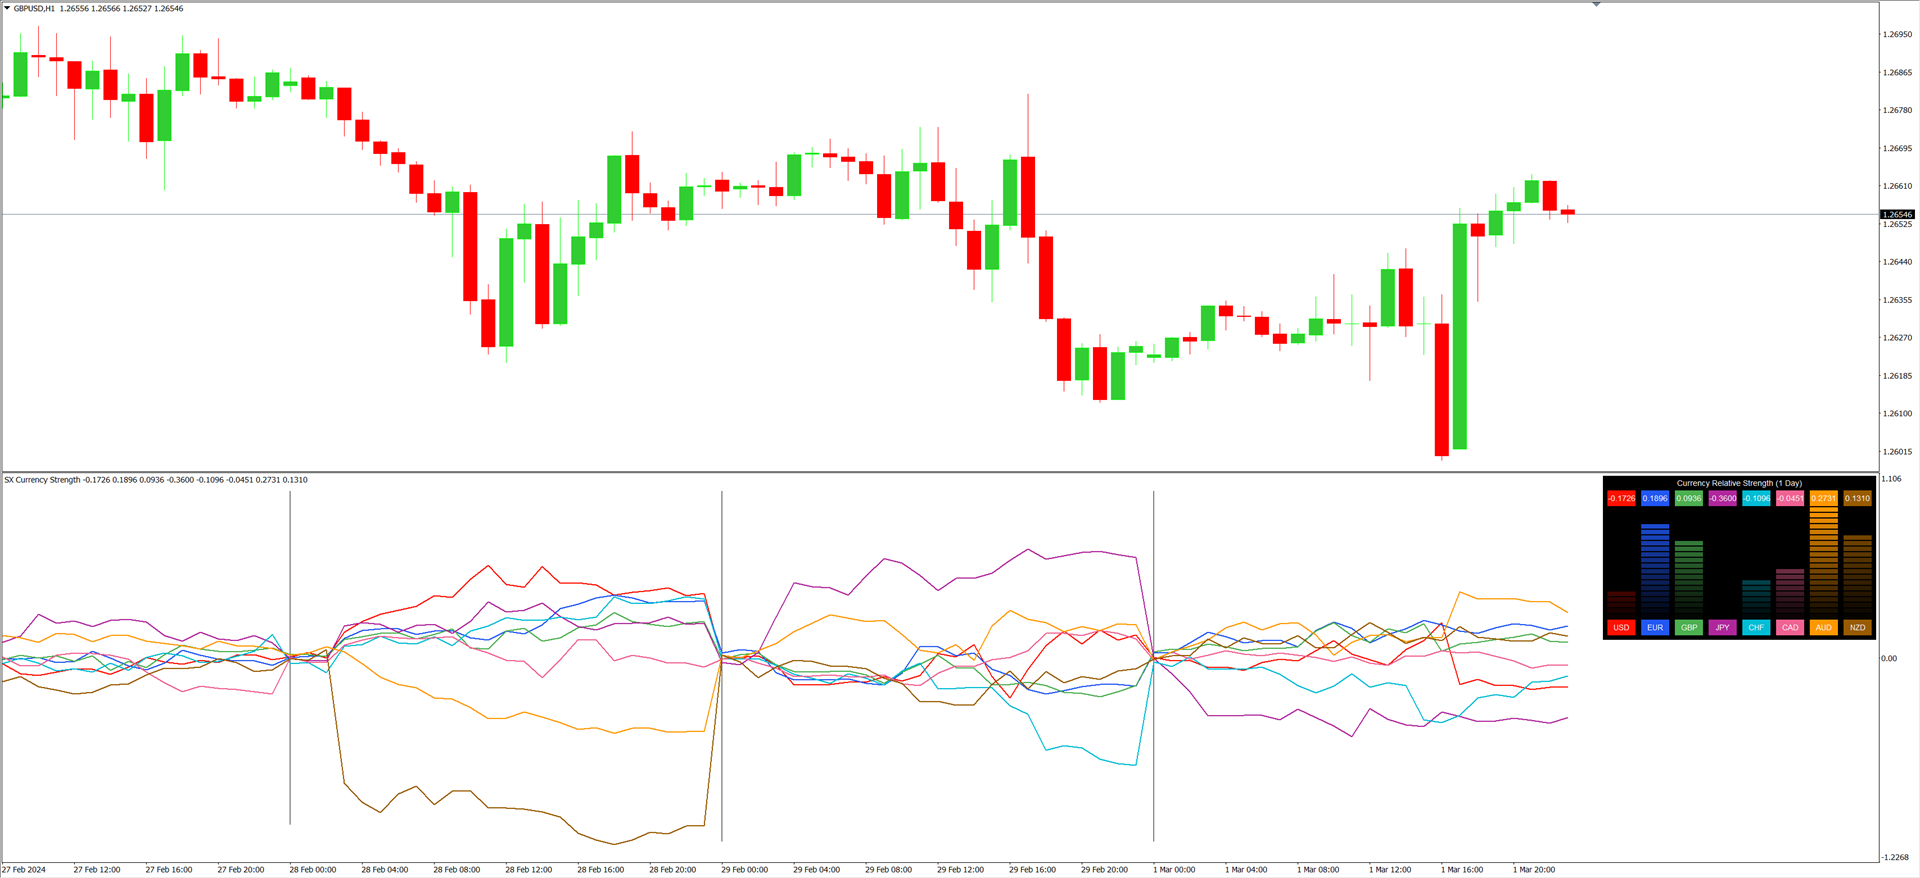
  • Trailing Relative Strength graph

The Currency Strength indicator empowers users to analyze currency strength across a chosen period, with results resetting periodically and accumulating thereafter.

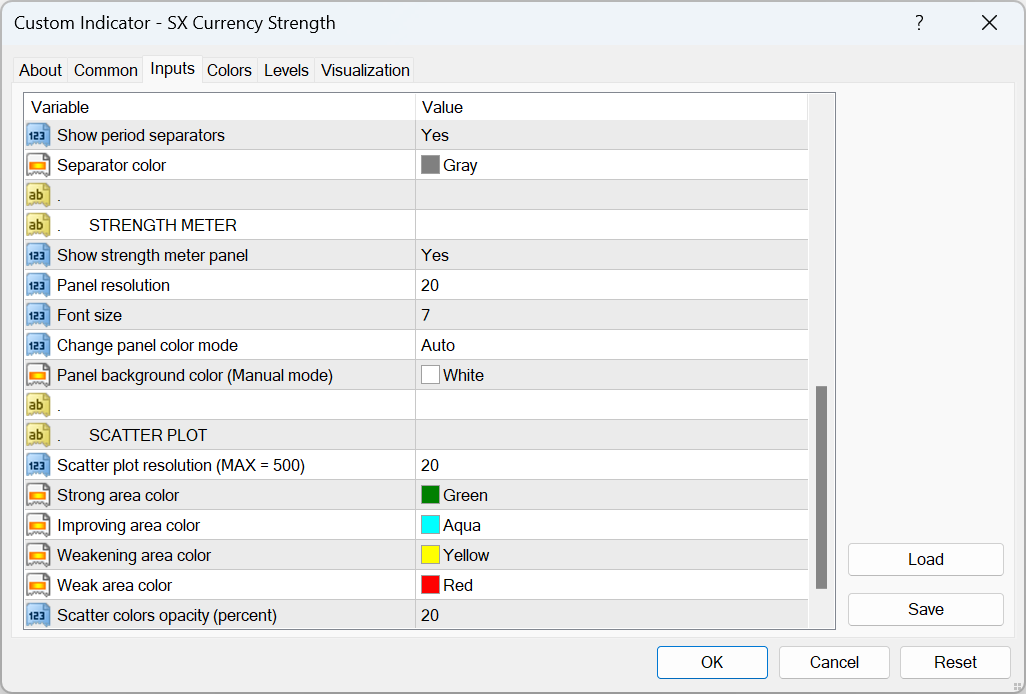
  • Strength Meter Panel

Displays the currency strength meter on a panel.

  • Relative Strength Scatter Plot

This graph illustrates a currency's relative strength compared to its previous value, providing insights into its strength evolution.

The graph is divided into four areas for quick interpretation:

Strong: Positive relative strength (bullish) greater than the previous period's value.

Improving: Negative relative strength (bearish) greater than the previous period's value.

Weakening: Positive relative strength (bullish) lower than the previous period's value.

Weak: Negative relative strength (bearish) lower than the previous period's value.

#Tags: Currency Strength, Currency Relative Strength, Advanced Currency Strength, Best Currency Strength, Strength Meter, Scatter Plot

DISCLAIMER: Please notice that we do not provide any financial advice. We only provide tools for anyone interested in improving their trading.

おすすめのプロダクト
Volume Profile Pro インジケーター このインジケーターは、 Volume Profile Pro ツールであり、「どの価格帯で最も取引が行われているか」を分析するのに役立ちます。以下の特別な機能が追加されています: 表示モード (Display Modes) Volume Profile (通常): 各価格帯の総取引量 (Total Volume) を表示し、重要なサポート・レジスタンスゾーンを可視化します。 Delta / Money Flow: 買い圧力と売り圧力 (Buy vs Sell) の「差(デルタ)」を表示し、その価格でどちらが市場を支配しているかを示します。ボリュームまたはマネーフロー (Money Flow) で表示可能です。 計算モード (Calculation Modes) Pro版の際立った特徴は、期間選択の柔軟性です: Fixed Mode (固定モード): 過去のローソク足の本数を固定で設定します(例:過去100本)。 Dynamic Mode (ダイナミックモード - 注目の機能): 垂直線が表示されます。マウスを使ってこの線をチャート上
Currency Strength Meter is the easiest way to identify strong and weak currencies. This indicator shows the relative strength of 8 major currencies + Gold: AUD, CAD, CHF, EUR, GBP, JPY, NZD, USD, XAU. Gold symbol can be changed to other symbols like XAG, XAU etc. By default the strength value is normalised to the range from 0 to 100 for RSI algorithm: The value above 60 means strong currency; The value below 40 means weak currency; This indicator needs the data of all 28 major currency pairs a
Questo indicatore fractal ti invierà un messaggio telefonico (tramite app mt4) non è necessaria la configurazione dell'indicatore, basta impostare l'ID del tuo smartphone e potrai ricevere il messaggio BUY o SELL in tempo reale (affidabilità 80%) per qualsiasi domanda o dubbio non esitate a contattarmi su mql5.com o telegram (link al gruppo disponibile in bio)
Rainbow Price Visualizer v1.21 See where the market really breathes. Turns your MT4 chart into an ultra-precise heatmap that highlights price zones favored by big players. Why it matters 300 price levels at 0.2‑pip resolution — microscopic detail. 8 visual themes (Rainbow, Fire, Ocean…) for instant readibility. Smart opacity: low noise fades, real zones pop. Lightweight rendering with automatic cleanup. Fully customizable: saturation, opacity, resolution, history depth. Bands project into the f
Volume Volatility is an indicator which analyzes currency pairs, indices, commodities etc. in terms of extremely high and extremely low accumulation to distribution ratio in comparison to values from past. The most important parameter is "Volume Volatility Factor" - this parameter, in big simplification, determines how far distance in the past is analyzed. The lower value of the parameter, the indicator analyzes less data from the past. I recommend you to set and test e.g. 3, 5, 15, 35, and 48 w
The Supply and Demand Zones indicator is one of the best tools we have ever made. This great tool automatically draws supply and demand zones, the best places for opening and closing positions. It has many advanced features such as multi timeframe zones support, displaying the width of zones, alert notifications for retouched zones, and much more. Because of market fractality, this indicator can be used for any kind of trading. Whether you are a positional, swing, or intraday trader does not ma
ON Trend
Abdullah Alrai
5 (1)
トレンドトレーディングの力をマスター このインジケーターは、初心者、中級者、そしてプロのトレーダー向けに設計されています。どの通貨ペアでも、正確に実際のトレンドを特定することで、トレーディングプロセスを簡素化します。 なぜこのインジケーターを選ぶべきなのか? - 簡単なトレード: もはや複雑な分析は必要ありません。インジケーターをチャートにロードし、買いまたは売りのシグナルを待つだけで、1日中チャートに貼り付く必要がありません。 - 明確なエントリーシグナル: インジケーターは正確なエントリーポイントを提供し、買いシグナルには青い矢印、売りシグナルには赤オレンジの矢印が表示されます。さらに、トレンドラインは市場の現在のトレンドを確認するために色が変わります。 - 理想的なタイムフレーム: 最良の結果を得るには、5分足のタイムフレームを使用することをお勧めします。H1のタイムフレームで再度インジケーターを適用してシグナルを確認することで、より正確なデータを得ることができます。 - スキャナーと組み合わせるとさらに強力: 内蔵スキャナーを使用して、すべての通貨ペアのトレンドを簡単に
GS trendS is a trend indicator that can be used for any Forex financial instrument. The indicator does not redraw and does not lag. Recommended timeframe H1. It is possible to select the trend algorithm settings {Only Open, Average Open/Close, Average High/Low} The color indicates the direction of the trend: yellow - direction can be SELL or BUY (S_B) blue - uptrend (BUY) red - downward trend (SELL) The indicator panel displays trend values of 5 timeframes for the current price level. The va
The classic SuperTrend indicator. The best indicator to define trends and small-scale trend changes in any pair and time frame. It is set up in exactly the same way as the TradinView indicator, and can be adjusted and complemented with other indicators to create profitable strategies or expert advisors, or used individually to profit from the market. Based on the average volatility of the last candles and the price movement, it draws a green line below the price if an bullish microtrend is ident
PW Oscillator
Svyatoslav Kucher
5 (1)
PW Oscillator   - индикатор предназначенный для поиска локальных экстремумов, определения текущей тенденции. В расчетах индикатора используется авторская методика. С помощью индикатора можно определять места возможного разворота цены желательно в направлении тенденции, но также с достаточной точностью и против нее. Также с помощью индикатора можно определять текущую тенденцию. Индикатор подходит для любых валютных пар, но для адекватного отображения показания необходимо, чтобы было достаточно ис
Currency Strength Meter is the easiest way to identify strong and weak currencies. This indicator shows the relative strength of 8 major currencies + Gold: AUD, CAD, CHF, EUR, GBP, JPY, NZD, USD, XAU. Gold symbol can be changed to other symbols like XAG, XAU etc. By default the strength value is normalised to the range from 0 to 100 for RSI algorithm: The value above 60 means strong currency; The value below 40 means weak currency; This indicator needs the data of all 28 major currency pairs a
BreakEven Line is a very useful and easy to use indicator. In case of multiple positions opened on the same instrument, the indicator shows the breakeven point where it is possible to close the positions. Its graphic simplicity makes it an unobtrusive and customizable tool. You can enable/disable a line on a chart, so you can make the indicator invisible. Inputs Show cumulative BE (line on/off) Breakeven line color (to change the line color) Breakeven line style Breakeven line width Show short B
TouchGuard Alert – Advanced Price Alert & Notification Indicator for MetaTrader 4 (MT4) TouchGuard Alert   is a fast, lightweight, and highly accurate price-touch   Alert & Notification   system designed for   MetaTrader 4 (MT4)   and   MetaTrader 5 (MT5) . It automatically sends real-time   Alerts, Pop-Up Alerts, Email Notifications, Push Notifications   and early-warning notifications when price touches or approaches your chart objects. Key Features (High-Precision Alert & Notification System)
Trade with Gann on your side!! MASTER CIRCLE 360 CIRCLE CHART, originally created by Gann admitted that this is “The Mother of all charts”. It is one of the last studies that this great trader left for us. The numeric tab le is apparently quite simple like all the tables and is based on square numbers, the SQUARE OF 12 and is by evolution, one of the most important square numbers. Here we can find CYCLE, PRICE AND TIME thanks to angles and grades, to show past and future support and resistance.
インディケータは現在のクオートを作成し、これを過去のものと比較して、これに基づいて価格変動予測を行います。インジケータには、目的の日付にすばやく移動するためのテキスト フィールドがあります。 オプション: シンボル - インジケーターが表示するシンボルの選択; SymbolPeriod - 指標がデータを取る期間の選択; IndicatorColor - インジケータの色; HorisontalShift - 指定されたバー数だけインディケータによって描画されたクオートのシフト; Inverse - true は引用符を逆にします。false - 元のビュー。 ChartVerticalShiftStep - チャートを垂直方向にシフトします (キーボードの上下矢印)。 次は日付を入力できるテキストフィールドの設定で、「Enter」を押すとすぐにジャンプできます。
Visual Range Indicator MT4
AL MOOSAWI ABDULLAH JAFFER BAQER
Explore the Power of Precision with the Range Indicator! This cutting-edge indicator is designed to provide traders with a detailed analysis of market range movements. However, it is essential to note that the Visual Range Indicator is not optimized—it has been crafted for you to tailor it to your trading needs and optimize it for your unique strategy. Your mastery and customization will unlock its true potential! The Strategy Behind the Range Indicator The Visual Range Indicator focuses on id
これはほぼ間違いなく、MetaTraderプラットフォームで見つけることができる最も完全な調和価格形成自動認識インジケーターです。 19種類のパターンを検出し、フィボナッチプロジェクションをあなたと同じように真剣に受け止め、潜在的逆転ゾーン(PRZ)を表示し、適切なストップロスとテイクプロフィットレベルを見つけます。 [ インストールガイド | 更新ガイド | トラブルシューティング | よくある質問 | すべての製品 ] 19の異なる調和価格形成を検出します プライマリ、派生および補完フィボナッチ投影(PRZ)をプロットします 過去の価格行動を評価し、過去のすべてのパターンを表示します この指標は、独自の品質とパフォーマンスを分析します 適切なストップロスとテイクプロフィットのレベルを表示します ブレイクアウトを使用して適切な取引を通知します すべてのパターン比をグラフにプロットします 電子メール/音声/視覚アラートを実装します スコット・M・カーニーの本に着想を得て、この指標は最も純粋で急を要するトレーダーのニーズを満たすように設計されています。ただし、トレードを容易にする
Title : Market Bias Indicator - Oscillator-Based Trading Tool Introduction : Discover the potential of the "Market Bias Indicator," a revolutionary oscillator-based trading tool designed for precise market analysis. If you're in search of a robust alternative to traditional bias indicators, your quest ends here. Market Bias Indicator offers unparalleled accuracy in identifying market sentiment and is your gateway to confident trading decisions. Recommended Trading Pairs : Market Bias Indicator i
POC Delta Order Blocks   is a rule-based order block and volume-delta indicator designed to help traders clearly understand   where real trading activity happened and how price reacts around those zones . Instead of drawing generic candle-based blocks, this indicator uses a   Point of Control (POC)   approach to identify the most actively traded price level between a swing high/low and a confirmed Break of Structure (BOS). The order block is then anchored to the   earliest valid candle that inte
The Vortex Indicator was inspired by the work of an Austrian inventor, Viktor Schauberger, who studied the flow of water in rivers and turbines. Etienne Botes and Douglas Siepman developed the idea that movements and flows within financial markets are similar to the vortex motions found in water. The Vortex Indicator was also partly inspired by J. Welles Wilder's concept of directional movement, which assumes the relationship between price bars gives clues as to the direction of a market. This i
A fair value gap (FVG) is a temporary price gap that occurs when the price of a stock or security is out of line with its fair value.   This gap is often caused by an imbalance between buyers and sellers. How it works Price imbalance When there is an imbalance between buyers and sellers, the price of a security can move too quickly. Price gap This creates an unadjusted area on the price chart, known as the fair value gap Price correction The price is often drawn back to the fair value gap, as i
TWO PAIRS SQUARE HEDGE METER INDICATOR Try this brilliant 2 pairs square indicator It draws a square wave of the relation between your two inputs symbols when square wave indicates -1 then it is very great opportunity to SELL pair1 and BUY Pair2 when square wave indicates +1 then it is very great opportunity to BUY pair1 and SELL Pair2 the inputs are : 2 pairs of symbols         then index value : i use 20 for M30 charts ( you can try other values : 40/50 for M15 , : 30 for M30 , : 10 for H1 ,
Overview Harmonic Patterns MT4 is a technical analysis indicator designed for the MetaTrader 5 platform. It identifies and displays harmonic price patterns, such as Butterfly, Cypher, Crab, Bat, Shark, and Gartley, in both bullish and bearish directions. The indicator calculates key price levels, including entry, stop loss, and three take-profit levels, to assist traders in analyzing market movements. Visual elements and customizable alerts enhance usability on the chart. Features Detects six ha
PV Super Trend Signals - Detects Key Points of Reversals - Enters Trades at Key Points - Closes Trades at Accurate Levels - Extremely accurate - Great for almost every currency - Amazing for EURUSD H1 - Backtested across many currencies over many years on many timeframes - H1 is the best timeframe - Can be used to make stable profit - Can be used to hedge other trading robots - ReInvest with Risk and Leverage features if desired - Backtested accurately across many currencies using tick data -
Monster Harmonics Indicator is a harmonic pattern indicator. It recognizes Gartley, Bat, Crab, Butterfly, Cypher, White Swan, Black Swan, Shark and several other patterns. Projected patterns that are not yet completed are recognized, too. Monster even shows the PRZ (Potential Reversal Zone). Users can add their own user defined patterns to Monster. Besides the current pattern, Monster also shows all patterns in the symbols history. Monster will provide alerts for developing patterns. Introduced
El indicador "MR BEAST ALERTAS DE LIQUIDEZ" es una herramienta avanzada diseñada para proporcionar señales y alertas sobre la liquidez del mercado basándose en una serie de indicadores técnicos y análisis de tendencias. Ideal para traders que buscan oportunidades de trading en función de la dinámica de precios y los niveles de volatilidad, este indicador ofrece una visualización clara y detallada en la ventana del gráfico de MetaTrader. Características Principales: Canal ATR Adaptativo: Calcula
Crypto_Forexインジケーター「 FORCE Index FLAT Detector 」は、取引における効率的な補助ツールです!リペイント不要。 このMT4対応の優れたインジケーターで、あなたの取引手法をアップグレードしましょう。 - このインジケーターは、チャート上の価格がフラットな領域を表示します。「Flat sensitive」パラメーターを搭載しており、フラットな領域を検知します。 - 「FORCE Index FLAT Detector」は、プライスアクションエントリーの確認や、他のインジケーターと組み合わせて使用​​できます。 - トレンドフォローシステムでフラットゾーンを検知し、そこでの取引を回避するために使用できます。 - リバーサルスキャルピング(フラットボーダーからの反転を狙う)にも使用できます。 - 標準的なFORCE Indexオシレーターの代わりに「FORCE Index FLAT Detector」を使用する機会は数多くあります。 - Force Index自体は、価格と出来高データを単一の値に統合するトップクラスのインジケーターの一つです。
Description The Market Profile & Volume Profile Indicator is a powerful technical analysis tool designed to visualize market activity and price distribution over specific timeframes. Unlike standard technical indicators that focus solely on price over time, this indicator organizes price data to show where the market spent the most time (TPO) and where the most volume was traded (Volume Profile). It automatically calculates and displays key structural levels such as the Point of Control (POC) ,
PipFinite Energy Beam
Karlo Wilson Vendiola
3.94 (17)
Pipfinite creates unique, high quality and affordable trading tools. Our tools may or may not work for you, so we strongly suggest to try the Demo Version for MT4 first. Please test the indicator prior to purchasing to determine if it works for you. We want your good reviews, so hurry up and test it for free...we hope you will find it useful. Combo Energy Beam with Swing Control Strategy: Confirm swing pullback signals Watch Video: (Click Here) Energy Beam with Trend Laser Strategy: Confirm Tre
サポート線と抵抗線のプロットにうんざりしていませんか? サポートレジスタンス は、非常に興味深いひねりを加えてチャート内のサポートとレジスタンスラインを自動検出およびプロットするマルチタイムフレームインジケーターです。価格レベルは時間とともにテストされ、その重要性が高まるにつれて、ラインは太くなり、暗くなります。 [ インストールガイド | 更新ガイド | トラブルシューティング | よくある質問 | すべての製品 ] 一晩でテクニカル分析を強化 チャートを閲覧せずに重要な価格レベルを検出 一目ですべての価格レベルの相対的な強さを認識する すべての取引で最大30時間のプロットラインを節約 インジケーターは、すべての価格レベルの年齢を表示します インジケーターは再描画されていません 過去および現在の価格レベルは近接によって崩壊し、現在の市場行動に合わせて調整されます。動作は、必ずしもピークではない場所に線が引かれます。 価格レベルは、時間とともに拒否されるにつれて、より暗く、より広くなります ノイズを避けるために、重要でない価格レベルは定期的にクリアされます カスタマイズ可能な時間枠の
このプロダクトを購入した人は以下も購入しています
Gann Made Easy は、ミスター・ギャンの理論を使用した取引の最良の原則に基づいた、プロフェッショナルで使いやすい外国為替取引システムです。 W・D・ガン。このインジケーターは、ストップロスとテイクプロフィットレベルを含む正確な買いと売りのシグナルを提供します。 PUSH通知を利用して外出先でも取引可能です。 ご購入後、取引方法の説明と優れた追加インジケーターを無料で入手するには、私にご連絡ください! おそらく、ギャンの取引手法についてはすでに何度も聞いたことがあるでしょう。通常、ギャンの理論は初心者のトレーダーだけでなく、すでにある程度の取引経験がある人にとっても非常に複雑なものです。なぜなら、ギャンの取引手法は理論的にはそれほど簡単に適用できるものではないからです。私はその知識を磨き、最良の原則を私の外国為替インジケーターに組み込むために数年を費やしました。 このインジケーターは非常に簡単に適用できます。必要なのは、それをチャートに添付し、簡単な取引推奨事項に従うだけです。このインジケーターは常に市場分析の仕事を行い、取引の機会を探します。適切なエントリーポイントを検出す
An exclusive indicator that utilizes an innovative algorithm to swiftly and accurately determine the market trend. The indicator automatically calculates opening, closing, and profit levels, providing detailed trading statistics. With these features, you can choose the most appropriate trading instrument for the current market conditions. Additionally, you can easily integrate your own arrow indicators into Scalper Inside Pro to quickly evaluate their statistics and profitability. Scalper Inside
M1 SNIPER は使いやすいトレーディングインジケーターシステムです。M1時間足向けに設計された矢印インジケーターです。M1時間足でのスキャルピングのためのスタンドアロンシステムとして、また既存のトレーディングシステムの一部としても使用できます。このトレーディングシステムはM1時間足での取引に特化して設計されていますが、他の時間足でも使用できます。元々、この手法はXAUUSDとBTCUSDの取引用に設計しましたが、他の市場においても役立つと考えています。 インジケーターのシグナルは、トレンドの方向と逆方向に取引できます。インジケーターのシグナルを利用して両方向に取引するのに役立つ特別な取引テクニックをご紹介します。この手法は、特別な動的なサポートとレジスタンスの価格帯を利用することに基づいています。 ご購入後、M1 SNIPER矢印インジケーターをすぐにダウンロードできます。さらに、M1 SNIPERツールのすべてのユーザーに、以下のスクリーンショットに表示されているApollo Dynamic SRインジケーターを無料で提供しています。この2つのインジケーターを組み合わせることで
まず第一に、この取引インジケーターは再描画されず、再描画されず、遅延しないことを強調する価値があります。これにより、手動取引とロボット取引の両方に理想的なものになります。 ユーザーマニュアル:設定、入力、戦略。 アトミックアナリストは、価格の強さとモメンタムを利用して市場でより良いエッジを見つけるためのPA価格アクションインジケーターです。ノイズや誤ったシグナルを除去し、取引ポテンシャルを高めるための高度なフィルターを備えています。複雑なインジケーターの複数のレイヤーを使用して、アトミックアナリストはチャートをスキャンし、複雑な数学的計算をシンプルなシグナルと色に変換します。これにより、どのような初心者トレーダーでも理解して使用し、一貫した取引の決定を行うことができます。 「アトミックアナリスト」は、新規および経験豊富なトレーダー向けにカスタマイズされた包括的な取引ソリューションです。プレミアムインジケーターとトップノッチの機能を1つの取引戦略に組み合わせ、すべてのタイプのトレーダーにとって汎用性のある選択肢にします。 デイリートレーディングとスキャルピング戦略:高速で正確な
Trend Screener
STE S.S.COMPANY
4.79 (95)
トレンドインジケーター、1つのツールに組み込まれたすべての重要なトレンド機能を備えたトレンドトレーディングとフィルタリングのための画期的なユニークなソリューション! これは、すべてのシンボル/商品(外国為替、商品、暗号通貨、インデックス、株式)で使用できる100%再描画されていないマルチタイムフレームおよびマルチ通貨インジケーターです。 期間限定オファー: サポートおよびレジスタンス スクリーナー インジケーターは、たった 50 ドルで永久的にご利用いただけます。(元の価格 250 ドル) (オファー延長) トレンドスクリーナーは、チャート内のドットで矢印トレンドシグナルを提供するインジケーターに続く効率的なインジケーターです。 トレンド分析インジケーターで使用できる機能: 1.トレンドスキャナー。 2.最大利益分析を備えたトレンドライン。 3.トレンド通貨強度メーター。 4.アラート付きのトレンド反転ドット。 5.アラート付きの強いトレンドドット。 6.トレンド矢印 毎日の分析例、毎日のシグナルパフォーマンス...など、トレンドスクリーナーインジケーターを使用して、ここで見つけること
After purchase, contact me privately to receive 7 days of free testing with EA Forex Proton. This advanced MT4 trading robot automatically executes signals from any MT4 indicator, including Market Makers. The latest version also includes AI integration, allowing each trade signal to be analyzed using Artificial Intelligence. Market Makers is a powerful price action trading system designed to identify high-probability Buy and Sell opportunities based on market momentum, volatility, and price po
トレンドラインプロ   市場の真の方向転換点を理解するのに役立ちます。この指標は、真のトレンド反転と主要プレーヤーが再び参入するポイントを示します。 分かりますか     BOSライン   複雑な設定や不要なノイズなしに、より長い時間足でのトレンドの変化と重要なレベルを把握できます。シグナルは再描画されず、バーが閉じた後もチャート上に残ります。 VERSION MT 5     -     RFI LEVELS PRO インジケーター と組み合わせることで、その潜在能力を最大限に発揮します。 インジケーターが示す内容: 本当の変化   トレンド(BOSライン) 一度シグナルが現れたら、それは有効です!これは、リペイント機能を持つインジケーターとの重要な違いです。リペイント機能を持つインジケーターは、シグナルを発した後、それを変更し、資金の損失につながる可能性があります。これにより、より高い確率と精度で市場に参入できます。また、矢印が現れた後、目標値(利益確定)に達するか、反転シグナルが現れるまで、ローソク足の色を変更する機能もあります。 繰り返しエントリ       主要プレーヤーの
「 Dynamic Scalper System 」インジケーターは、トレンド波の中でスキャルピング取引を行う手法のために設計されています。 主要通貨ペアと金でテスト済みで、他の取引商品との互換性があります。 トレンドに沿った短期的なポジションオープンのシグナルを提供し、追加の価格変動サポートも提供します。 インジケーターの原理 大きな矢印はトレンドの方向を決定します。 トレンド波の中では、小さな矢印の形でスキャルピングシグナルを生成するアルゴリズムが機能します。 赤い矢印は強気方向、青い矢印は弱気方向です。 トレンドの方向には敏感な価格変動ラインが描かれ、小さな矢印のシグナルと連動します。 シグナルは次のように機能します。適切なタイミングでラインが現れるとエントリーシグナルが形成され、ラインが開いている間はポジションが保持され、完了すると取引が終了します。 推奨される動作時間枠はM1~H4です。 矢印は現在のローソク足に形成され、次のローソク足が開いている場合は、前のローソク足の矢印は再描画されません。 入力パラメータ Trend Wave Period - トレンド方向
ご紹介     Quantum Breakout PRO は 、ブレイクアウト ゾーンの取引方法を変革する画期的な MQL5 インジケーターです。 13年以上の取引経験を持つ経験豊富なトレーダーのチームによって開発された Quantum Breakout PROは 、革新的でダイナミックなブレイクアウトゾーン戦略により、あなたの取引の旅を新たな高みに押し上げるように設計されています。 クォンタム ブレイクアウト インジケーターは、5 つの利益ターゲット ゾーンを備えたブレイクアウト ゾーン上のシグナル矢印と、ブレイクアウト ボックスに基づいたストップロスの提案を提供します。 初心者トレーダーにもプロのトレーダーにも適しています。 量子EAチャネル:       ここをクリック MT5バージョン:   ここをクリック 重要!購入後、インストールマニュアルを受け取るためにプライベートメッセージを送ってください。 推奨事項: 時間枠: M15 通貨ペア: GBPJPY、EURJPY、USDJPY、NZDUSD、XAUUSD アカウントの種類: ECN、Raw、またはスプレッドが非
現在20%OFF! 初心者やエキスパートトレーダーに最適なソリューションです。 このインディケータは、エキゾチックペア・コモディティ・インデックス・先物など、あらゆるシンボルの通貨の強さを表示することに特化したインディケータです。金、銀、原油、DAX、US30、MXN、TRY、CNHなどの通貨の強さを表示するために、9行目にどのシンボルでも追加することができます。独自の機能を多数搭載し、新しい計算式を採用したため、ユニークで高品質、かつ手頃な価格のトレーディングツールとなっています。新しいトレンドやスキャルピングチャンスのトリガーポイントを正確に把握することができるため、あなたのトレードがどのように改善されるか想像してみてください。 ユーザーマニュアル:ここをクリック   https://www.mql5.com/en/blogs/post/708876 すべての時間枠に対応します。あなたはすぐにトレンドを見ることができるようになります! 新しいアルゴリズムに基づいて設計されているため、潜在的な取引の特定と確認がより簡単になります。これは、8つの主要通貨と1つのシンボルの強弱
The Reversal Master is an indicator for determining the current direction of price movement and reversal points. The indicator will be useful for those who want to see the current market situation better. The indicator can be used as an add-on for ready-made trading systems, or as an independent tool, or to develop your own trading systems. The Reversal Master indicator, to determine the reversal points,  analyzes a lot of conditions since the combined analysis gives a more accurate picture of t
Scalper Vault は、スキャルピングを成功させるために必要なすべてを提供するプロフェッショナルなスキャルピング システムです。このインジケーターは、外国為替およびバイナリー オプションのトレーダーが使用できる完全な取引システムです。推奨される時間枠は M5 です。 システムは、トレンドの方向に正確な矢印シグナルを提供します。また、トップとボトムのシグナルとギャン マーケット レベルも提供します。 インジケーターは、プッシュ通知を含むすべてのタイプのアラートを提供します。 インジケータの購入後にご連絡ください。私の個人的な取引の推奨事項と素晴らしいボーナス指標を無料で共有します! 幸せで有益な取引をお祈りします!
Route Lines Prices -は、価格の方向性を予測するために設計されたインジケーターです。シンプルなインターフェースには、価格変動と将来の方向性を計算するための複数のアルゴリズムが搭載されています。これらのアルゴリズムには、使用する時間枠に基づいたボラティリティ計算と価格平滑化が含まれています。 このインジケーターには、「 Calculating price values 」値を変更するためのパラメーターが1つだけあります。デフォルト値の1は、バランスの取れた自動計算を提供し、インジケーターを手動で設定することなく使用できます。 値を2から500まで手動で変更することで、インジケーターを独自のトレーディングシステムに合わせてカスタマイズできます。 このインジケーターは、M1からH4の時間枠での使用を推奨します。あらゆる取引銘柄で使用できます。 シグナル矢印はローソク足の終値で生成され、過去の履歴には再描画されません。 メインチャートには、重複した矢印が表示されます。 複数のアラートタイプが利用可能です。内蔵のライン軌跡カウンターは、終値に基づいて動作します。これ
CRT Multi-Timeframe Market Structure & Liquidity Sweep Indicator Non-Repainting | Multi-Asset | MT5 Version Available MT5 Version:   https://www.mql5.com/en/market/product/162075 Full User Guide — explains what each feature does and why:   https://www.mql5.com/en/blogs/post/767525 Quick Start User Guide  — explains how to configure and in what order:  https://www.mql5.com/en/blogs/post/767540 Indicator Overview CRT Ghost Candle HTF Fractal is a complete institutional-grade market structure too
現在40%OFF! 初心者やエキスパートトレーダーのためのベストソリューション! このダッシュボードソフトウェアは、28の通貨ペアで動作しています。それは私達の主要な指標(高度な通貨の強さ28と高度な通貨インパルス)の2に基づいています。それは全体の外国為替市場の大きい概観を与えます。それは、すべての(9)時間枠で28の外国為替ペアのための高度な通貨の強さの値、通貨の動きの速度と信号を示しています。チャート上で1つのインディケータを使用して市場全体を観察し、トレンドやスキャルピングの機会をピンポイントで見つけることができたら、あなたのトレードがどのように改善されるか想像してみてください。 このインディケータには、強い通貨と弱い通貨の識別、潜在的な取引の識別と確認がより簡単になるような機能が搭載されています。このインディケータは、通貨の強さや弱さが増加しているか減少しているか、また、すべての時間枠でどのように機能しているかをグラフィカルに表示します。 新機能として、現在の市場環境の変化に適応するダイナミックなマーケットフィボナッチレベルが追加され、すでに当社のAdvanced
通貨強さウィザードは、取引を成功させるためのオールインワン ソリューションを提供する非常に強力な指標です。このインジケーターは、複数の時間枠のすべての通貨のデータを使用して、このまたはその外国為替ペアのパワーを計算します。このデータは、使いやすい通貨インデックスと通貨パワーラインの形式で表され、特定の通貨のパワーを確認するために使用できます。 必要なのは、取引したいチャートにインジケーターを接続することだけです。インジケーターは、取引する通貨の実際の強さを示します。このインジケーターは、トレンドに合わせて取引するときに有利に利用できる売買高の圧力の極値も示します。このインジケーターには、フィボナッチに基づく可能なターゲットも表示されます。 このインジケーターは、PUSH 通知を含むあらゆるタイプのアラートを提供します。 購入後ご連絡下さい。私の取引のヒントをあなたと共有し、素晴らしいボーナスインジケーターを無料で提供します! 幸せで有益な取引をお祈りします。
Auto Optimized Parabolic RSI: 高度な3Dモメンタムエンジン ほとんどのリテール向けインジケーターは、市場のボラティリティが変化した瞬間に破綻する静的な入力値に依存しているため、失敗に終わります。Auto Optimized Parabolic RSIは、自らの数学的優位性を継続的に再計算することで「インジケーターの陳腐化」問題を解決し、機関投資家レベルの定量的適応力をMT5ターミナルに直接もたらします。 最大の強み: カスタムインメモリ3D最適化   標準的な自動最適化ツールは、インジケーターの呼び出しで端末に過負荷をかけるため、頻繁にMT5プラットフォームをフリーズさせます。本ツールは、このボトルネックを完全に回避しています。RAMベースのカスタムネイティブ計算機を内蔵した内部エンジンは、チャートを読み込んだりタイムフレームを変更したりするたびに、超高速の3Dグリッド探索を実行します。RSI期間(頻度)、SARステップ(加速度)、SAR最大値(制限速度)を同時にスイープし、プラットフォームを遅延させることなく、数万通りものパラメーターの組み合わせを絶対的
Advanced Supply Demand
Bernhard Schweigert
4.91 (299)
現在40%オフ 初心者にもエキスパートトレーダーにも最適なソリューション このインジケーターは独自の機能と新しい公式を多数内蔵しており、ユニークで高品質かつ手頃な取引ツールです。このアップデートでは、2つの時間枠ゾーンを表示できるようになります。より長いTFだけでなく、チャートTFとより長いTF(ネストゾーンを表示)の両方を表示できます。すべてのSupply Demandトレーダーの皆さんのお気に召すはずです。:) 重要情報の公開 Advanced Supply Demandの可能性を最大化するには、 https://www.mql5.com/ja/blogs/post/720245 にアクセスしてください。   エントリーまたはターゲットの正確なトリガーポイントを正確に特定できれば取引がどのように改善されるか想像してみてください。新しい基盤となるアルゴリズムに基づいて構築されているため、買い手と売り手の間の潜在的な不均衡をさらに簡単に特定できます。これは、最も強い需要と供給のゾーンと、過去のパフォーマンス(古いゾーンを表示)がグラフィカルに表現されるためです。これらの機能は、最適な
Super Signal Market Slayer 非リペイント|高精度|マルチマーケット対応インテリジェントトレンド指標 トレードにおいて本当に難しいのは、 注文することではなく、相場のノイズの中で「トレンドが始まった瞬間」を見極めることです。 Market Slayer はそのために開発されました。 本インジケーターは、日中取引向けに設計された非リペイント型のインテリジェント指標です。 多層確認とトレンドフィルターにより、重要な局面でのみ明確かつ信頼性の高い Buy / Sell シグナルを表示します。 主な特長 非リペイントシグナル 一度表示されたシグナルは固定され、消えたり移動したりしません。 高精度なトレンド判定 複数銘柄で検証され、特にゴールド M5 / M15 で安定した結果を示します。 マルチマーケット対応 ゴールド、FX、指数、主要暗号資産に対応。 日中取引向け最適化 M5・M15 に特化し、ノイズを抑え実行性を向上。 直感的で分かりやすい 初心者でも理解しやすく、すぐに使用可能。 技術ロジック概要 Market Slayer は単一条件の矢印ではありません。 以
Super Reversal Indicator with Alert 概要 Super Reversal Indicator with Alert は、マルチタイムフレーム分析を用いて高確率の相場反転ポイントを特定するためのトレーディングツールです。ストキャスティクスのモメンタム、需給ゾーン、そして価格のリジェクションシグナルを組み合わせて分析を行います。 本インジケーターは、明確な視覚シグナルとリアルタイムアラートにより、トレーダーが市場の転換点を見極めるのをサポートします。 主な機能 マルチタイムフレーム ストキャスティクス分析 上位時間足のストキャスティクスを使用(ユーザー設定可能) モメンタムの変化やクロスシグナルを検出 エントリー精度を高めるための買われ過ぎ・売られ過ぎレベルを表示 反転リジェクションシグナル 重要な価格帯での強いリジェクションローソク足を検出 以下のポイントでの反転を識別 日足高値での売り反転 日足安値での買い反転 視認性を高めるため、チャート上に矢印を表示 需給ゾーン(Supply and Demand) H4およびD1の上位時間足から重要なゾーンを自動
Stratos Pali
Michela Russo
4.43 (7)
Stratos Pali Indicator   is a revolutionary tool designed to enhance your trading strategy by accurately identifying market trends. This sophisticated indicator uses a unique algorithm to generate a complete histogram, which records when the trend is Long or Short. When a trend reversal occurs, an arrow appears, indicating the new direction of the trend. Important Information Revealed Leave a review and contact me via mql5 message to receive My Top 5 set files for Stratos Pali at no cost! Dow
GOLD Impulse with Alert
Bernhard Schweigert
4.67 (12)
このインディケータは、当社の2つの製品 Advanced Currency IMPULSE with ALERT  +   Currency Strength Exotics . のスーパーコンビネーションです。 このインジケーターは全ての時間枠で作動し、8つの主要通貨と1つのシンボルの強弱のインパルスをグラフで表示します。 このインジケータは、金、エキゾチックペア、商品、インデックス、先物など、あらゆるシンボルの通貨強度の加速度を表示することに特化されています。金、銀、原油、DAX、US30、MXN、TRY、CNHなどの通貨強度の加速度(インパルスまたは速度)を表示するために、任意のシンボルを9行目に追加できる、この種の最初のものです。 新しいアルゴリズムに基づいて構築され、潜在的な取引の特定と確認がさらに容易になりました。これは、通貨の強さや弱さが加速しているかどうかをグラフィカルに表示し、その加速の速度を測定するためです。加速すると物事は明らかに速く進みますが、これはFX市場でも同じです。つまり、反対方向に加速している通貨をペアリングすれば、潜在的に利益を生む取引を特定
Dynamic Forex28 Navigator - 次世代の Forex 取引ツール。 現在 49% オフ。 Dynamic Forex28 Navigator は、長年人気のインジケーターを進化させたもので、3 つの機能を 1 つにまとめています。 Advanced Currency Strength28 インジケーター (レビュー 695 件)  + Advanced Currency IMPULSE with ALERT (レビュー 520 件) + CS28 コンボ シグナル (ボーナス)。 インジケーターの詳細 https://www.mql5.com/en/blogs/post/758844 次世代の Strength インジケーターが提供するもの  オリジナルで気に入っていたすべての機能が、新機能と精度の向上によって強化されました。 主な機能: 独自の通貨強度計算式。 すべての時間枠でスムーズかつ正確な強度ライン。 トレンドの特定と正確なエントリーに最適です。 ダイナミックマーケットフィボナッチレベル (マーケットフィボナッチ)。 このインジケーターに固有
- Real price is 80$ - 40% Discount (It is 49$ now) Contact me for instruction, add group and any questions! - Non-repaint - I just sell my products in Elif Kaya profile, any other websites are stolen old versions, So no any new updates or support. - Lifetime update free Related product:   Bitcoin Expert Introduction The breakout and retest strategy is traded support and resistance levels. it involves price breaking through a previous level.  The break and retest strategy is designed to help tr
FX Power: 通貨の強弱を分析して、より賢い取引を実現 概要 FX Power は主要通貨と金の実際の強弱をあらゆる市場状況で理解するための必須ツールです。強い通貨を買い、弱い通貨を売ることで、 FX Power は取引の意思決定を簡素化し、高い確率の取引機会を見出します。トレンドを追従する場合でも、極端なデルタ値を使用して反転を予測する場合でも、このツールはあなたの取引スタイルに完全に適応します。ただ取引するだけではなく、 FX Power で賢く取引をしましょう。 1. なぜ FX Power がトレーダーにとって非常に有益なのか 通貨と金のリアルタイム強弱分析 • FX Power は主要通貨と金の相対的な強弱を計算し、マーケットダイナミクスに関する明確な洞察を提供します。 • どの資産がリードしているか、または後れを取っているかを監視して、取引するペアを賢く選びましょう。 マルチタイムフレームの包括的なビュー • 短期、中期、長期のタイムフレームで通貨と金の強弱を追跡し、マーケットトレンドに基づいて取引戦略を調整できます。 • スキャルピングからスイングトレード
MT5バージョンはこちらからご利用いただけます: https://www.mql5.com/en/market/product/50048 Telegramチャンネル&グループ: https://t.me/bluedigitsfx V.I.Pグループアクセス: 有料商品の購入証明を当方の受信箱へ送信してください 推奨ブローカー: https://bit.ly/BlueDigitsFxStarTrader BlueDigitsFx Easy 123 System — MT4用の強力な反転およびブレイクアウト検出システム 初心者から上級者まで使いやすい、マーケット構造の変化、ブレイクアウト、トレンド反転を視覚的に捉えるオールインワンのノンリペイントインジケーターです。 本インジケーターは「123」パターンに従って動作します: ステップ1: 新しい高値または安値をビッグアローで表示し、エキゾーストポイント(勢いの弱まり)を示します ステップ2: 構造のブレイクを知らせ、トレンド反転の可能性を示唆します ステップ3: リトルアローとサポート/レジスタンスドットでエントリーを確定します
Apollo Secret Trend は、任意のペアと時間枠でトレンドを見つけるために使用できるプロのトレンド インジケーターです。インジケーターは、取引するペアや時間枠に関係なく、市場のトレンドを検出するために使用できる主要な取引インジケーターになることができます。インジケーターで特別なパラメーターを使用することにより、シグナルを個人の取引スタイルに適応させることができます。 このインジケーターは、PUSH 通知を含むすべてのタイプのアラートを提供します。インジケータの信号は再描画しないでください!提供されたスクリーンショットでは、アポロ シークレット トレンド インジケーターと買われ過ぎ/売られ過ぎのオシレーター インジケーターを組み合わせて見ることができます。これは完全に無料で提供されます。 購入後、2 番目の買われすぎおよび売られすぎのオシレーター インジケーターを無料で入手するために私に連絡してください!また、システムの使用方法についても説明します。お得な特典もご用意しております!
Volatility Trend System - a trading system that gives signals for entries. The volatility system gives linear and point signals in the direction of the trend, as well as signals to exit it, without redrawing and delays. The trend indicator monitors the direction of the medium-term trend, shows the direction and its change. The signal indicator is based on changes in volatility and shows market entries. The indicator is equipped with several types of alerts. Can be applied to various trading ins
Auto Optimized MFI は、自動で最適なMFIの買い・売りレベルを調整するインジケーターです。過去のデータに基づいて実際のトレードシミュレーションを行い、あなたの市場や時間足に合わせて最も効果的なエントリーポイントを見つけ出します。従来の80/20といった固定的なMFI基準ではなく、実際の価格と出来高の動きに適応するのが特徴です。 動作の仕組み 指定した範囲の過去のローソク足を分析し、MFIシグナルに基づくエントリーとエグジットをシミュレーションします。勝率、ドローダウン、TP/SL(利益確定/損切り)などの成績を記録し、これらの結果から最適なMFIレベルを毎日、毎週、または毎月自動で更新します。 主な機能 設定可能なMFI期間(デフォルト:14) 最適化するローソク足の範囲を指定可能 買い/売りレベルの範囲をカスタマイズ可能 細かい調整が可能なステップサイズ設定 最小利益ターゲットの設定で弱い戦略を排除 MFIラインとシグナル矢印のスタイル設定が可能 このツールは、市場の変化に柔軟に対応したいトレーダーに最適で、固定ルールに頼らず常に市場に適応する戦略を実現します。
ブレーカートレーダーになり、価格が反転すると市場構造からの利益が変化します。 注文ブロックブレーカーインジケーターは、トレンドまたは価格の動きが枯渇に近づいており、逆転の準備ができていることを識別します。通常、反転または大規模なプルバックが発生しようとしているときに発生する市場構造の変化について警告します。 この指標は、ブレイクアウトと価格の勢いを識別する独自の計算を使用します。使い果たされる可能性のあるポイントの近くで新しい高値が形成されるたびに、インディケーターはその高値の作成を担当する最後の注文ブロックを描きます。次に、移動する価格とともに注文ブロックを追跡します。その後、価格が反対方向にシフトし、その注文ブロックを突破すると、新しい市場構造を作成し、トレンドまたは大きな後退の可能性のある反転の開始を警告します。 注文ブロックは、高値/安値が作成される前の最後の反対色のろうそくであり、価格がこれらの重要な領域を下抜けすると、トレンドの短期的ま​​たは長期的な反転の兆候です。 特徴 重要な枯渇点での市場構造の変化を警告します 価格が使い果たされるレベルに近づくと、自動的に
作者のその他のプロダクト
This comprehensive technical indicator calculates and plots up to 3 moving averages with 3 different periods. By employing three moving averages of distinct lookback periods, the trader can confirm whether the market has indeed experienced a change in trend or whether it is merely pausing momentarily before resuming its prior state. SX Golden MA Pack  for MT4 is available   here . The shorter the moving average period, the more closely it tracks the price curve. When a security initiates an upt
FREE
SX Supply Demand Zones accurately identifies and draws high-probability Supply and Demand zones using a sophisticated algorithm. Unlike traditional indicators that clutter your chart, this indicator is designed with a focus on performance and a clean user experience. New Unique Feature: Interactive Legend System What truly sets this indicator apart from everything else is the Interactive Control Legend. You have a professional dashboard directly on your chart that allows you to: Show/Hide: Ins
FREE
SX Trend Impulse Channels is a precisely designed trend-following system that represents trend development through distinct, volatility-adjusted steps. Instead of relying on traditional slope-based methods, it employs a structured step mechanism that only advances when price action conclusively confirms momentum via an ATR-based trigger. This indicator is well suited for traders who favor structured, stair-step trend progression over smooth, continuous curves. It delivers clear momentum-based
FREE
This comprehensive technical indicator calculates and plots up to 3 moving averages with 3 different periods. By employing three moving averages of distinct lookback periods, the trader can confirm whether the market has indeed experienced a change in trend or whether it is merely pausing momentarily before resuming its prior state. SX Golden MA Pack  for MT5 is available   here . The shorter the moving average period, the more closely it tracks the price curve. When a security initiates an upt
FREE
SX Theme Setter is intended for changing chart appearance in 2 modes: - Gradient background mode: In this mode, the indicator creates a gradient background for your chart. Colors, steps and gradient type can be selected by user. - Color theme: Color theme mode provides more than 50 built-in different color themes which can be selected from a list. Most of these themes are converted from official color themes of real trading platforms of the past and present. Try them out and see if they suit
FREE
SX Price Action Patterns is a comprehensive indicator which shows various price action patterns on the chart for those who are interested in price action trading. These patterns are as follows: A Pin Bar is a candlestick price bar, which has a long wick on one side and a small body. It is a powerful signal of price reversal in a currency trading strategy. An Inside Bar is characterized by a bar or candle that is entirely ‘inside’ the range of the preceding one and represents the consolidation o
FREE
SX Theme Setter is intended for changing chart appearance in 2 modes: - Gradient background mode: In this mode, the indicator creates a gradient background for your chart. Colors, steps and gradient type can be selected by user. - Color theme: Color theme mode provides more than 50 built-in different color themes which can be selected from a list. Most of these themes are converted from official color themes of real trading platforms of the past and present. Try them out and see if they suit
FREE
MACD is probably one of the most popular technical indicators out there. When the market is trending, it actually does a pretty good job, but when the market starts consolidating and moving sideways, the MACD performs not so well. SX Impulse MACD for MT5 is available here . Impulse MACD is a modified version of MACD that works very well for trading Forex, stocks, and cryptocurrencies. It has its own unique feature which perfectly filters out the values in a moving average range and enables it t
Tired of constantly switching between charts to monitor different assets? SX Mini Charts Pro is a powerful, space-saving dashboard indicator that allows you to display up to 8 independent mini-charts directly on your main trading window. Designed for multi-symbol analysis, this indicator keeps all your mini-charts perfectly synced with the timeframe of your main chart, giving you a comprehensive view of the market without cluttering your workspace. Key Features: Multi-Symbol Monitoring: Track
MACD is probably one of the most popular technical indicators out there. When the market is trending, it actually does a pretty good job, but when the market starts consolidating and moving sideways, the MACD performs not so well. SX Impulse MACD for MT4 is available   here . Impulse MACD is a modified version of MACD that works very well for trading Forex, stocks, and cryptocurrencies. It has its own unique feature which perfectly filters out the values in a moving average range and enables it
フィルタ:
emaile2008
49
emaile2008 2024.01.07 11:58 
 

ユーザーは評価に対して何もコメントを残しませんでした

Mojtaba Sarikhani
6886
開発者からの返信 Mojtaba Sarikhani 2024.01.07 19:05
Hi,
Thank you very much for your comment!
Adding more currencies is under process, will update the indicator asap!
danmar
2355
danmar 2023.11.22 10:59 
 

ユーザーは評価に対して何もコメントを残しませんでした

Mojtaba Sarikhani
6886
開発者からの返信 Mojtaba Sarikhani 2023.11.22 11:42
Hi,
Thank you very much for your great review. Kindly be informed that this indicator is under development and more options and capabilities (including your nice ideas) will be added to this tool in the near future.
レビューに返信