Fair Value gap Sweep
- インディケータ
- バージョン: 3.30
- アップデート済み: 6 2月 2025
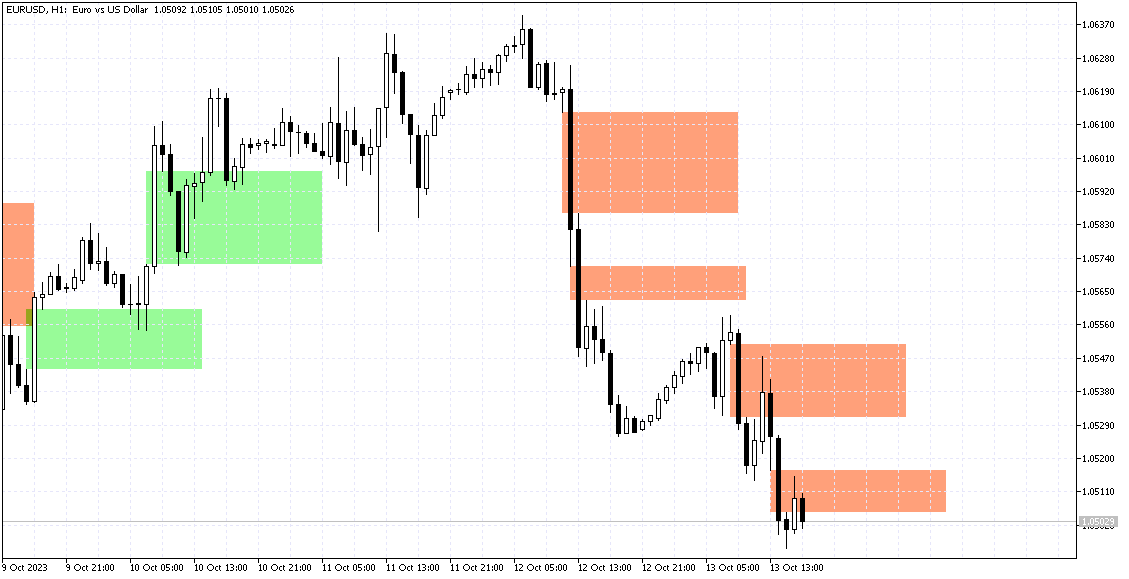
Fair Value Gap Sweep is a unique and powerful indicator that draws fair value gaps on your chart and alerts you when a gap has been swept by the price. A fair value gap is a price gap that occurs when the market opens at a different level than the previous close, creating an imbalance between buyers and sellers. A gap sweep is when the price moves back to fill the gap, indicating a change in market sentiment and a potential trading opportunity.
Fair Value Gap Sweep indicator has the following features and benefits:
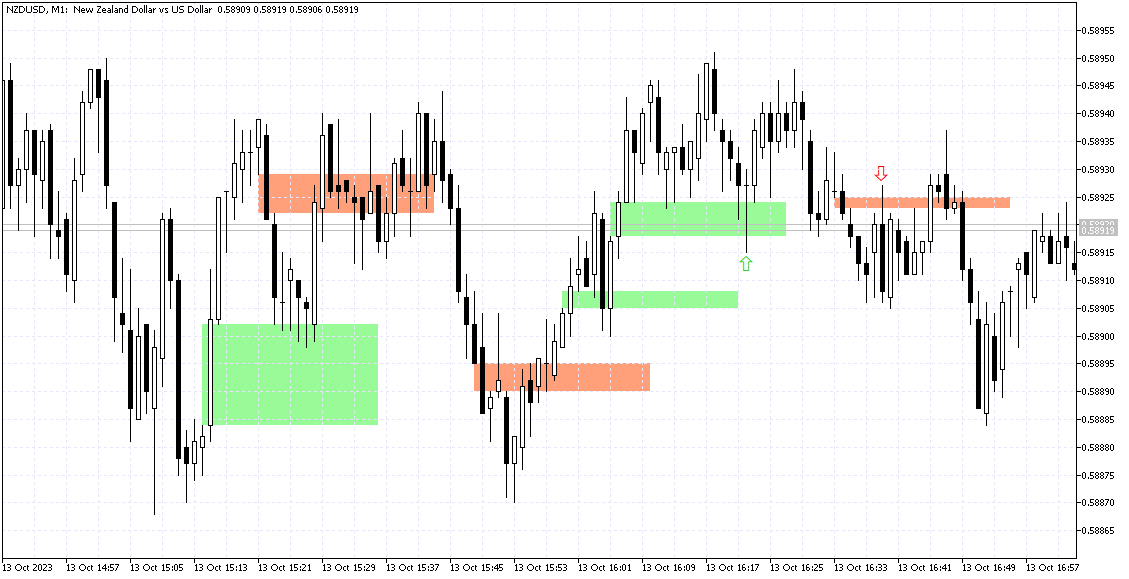
- It automatically detects and draws fair value gaps on your chart, using different colors and styles to distinguish between bullish and bearish gaps.
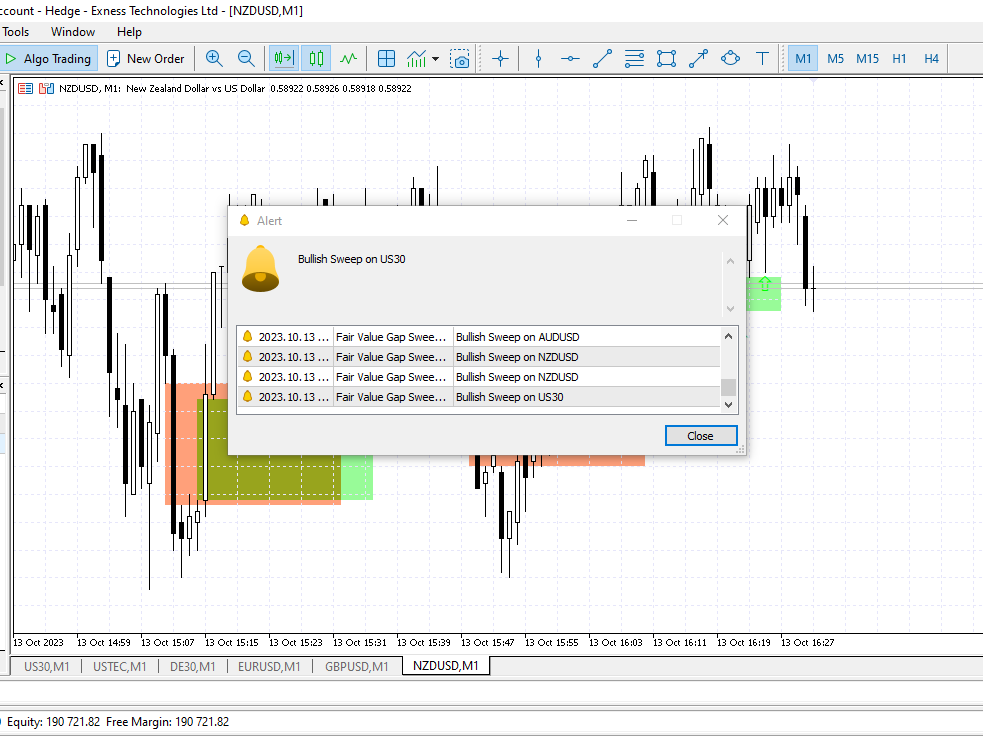
- It sends you an alert (sound, email, push notification) and draws an arrow on your chart when a gap has been swept by the price, so you don't miss any trading signals.
- It allows you to customize the gap size, gap type, alert settings, arrow settings, and other parameters according to your preferences and trading style.
- It works on any currency pair, timeframe, and market condition, giving you a versatile and reliable tool for your trading arsenal.
Fair Value Gap Sweep indicator is easy to use and understand. Just attach it to your chart and let it do the work for you. You can use it as a standalone indicator or combine it with other technical analysis tools to enhance your trading performance.
If you are looking for an indicator that can draw fair value gaps and alert you when they are swept by the price, then Fair Value Gap Sweep indicator is the perfect choice for you.


VERY GOOD.