Smart M Concept MT5
- インディケータ
-
Andrei Novichkov
 Development: MT 4 & 5, NinjaTrader 7 & 8.
Translations from Pine.
Telegram: https://t.me/fxstill (Literature on cryptocurrencies, development and code) - バージョン: 1.0
- アクティベーション: 5
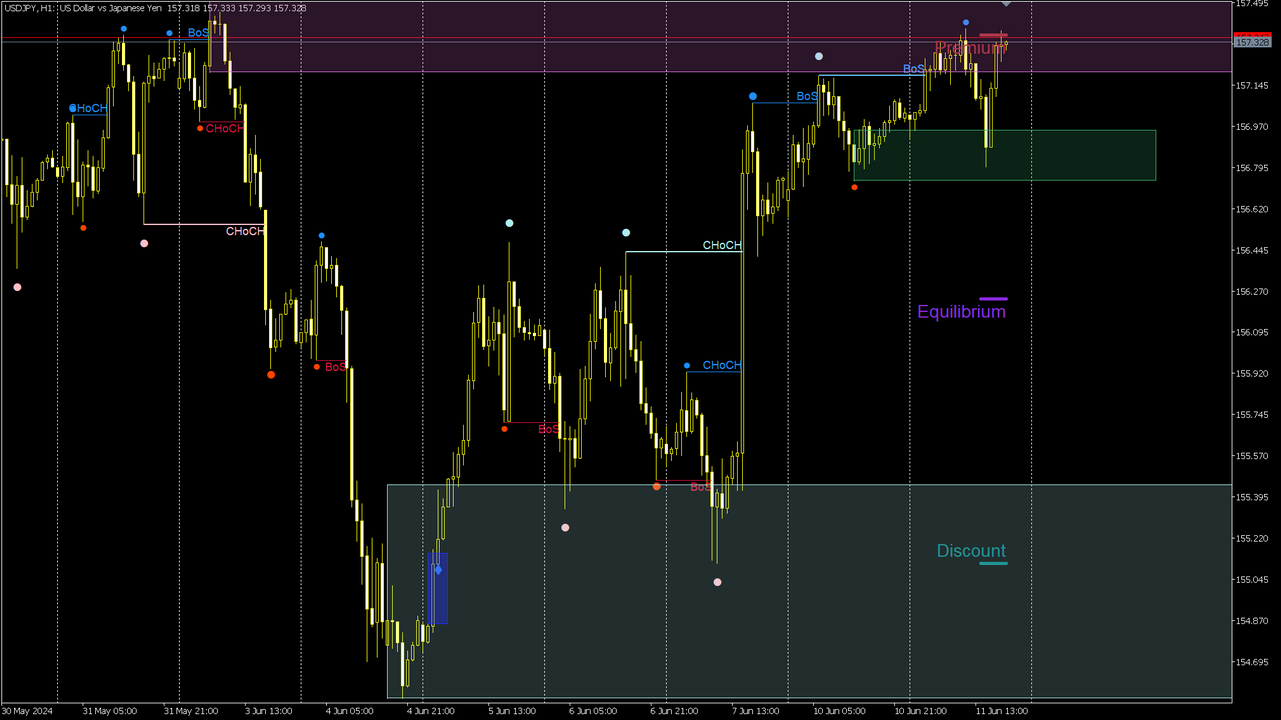
Our new indicator is an important part of the Smart Money Concepts (SMC) system
It uses a modern market vision and fast calculation methods. As a result, the trader has a complete picture of the trade at every moment in time, which makes the process of obtaining results easier and faster.
Our new indicator displays the following important patterns:
Calculations are made simultaneously for two different periods:
It uses a modern market vision and fast calculation methods. As a result, the trader has a complete picture of the trade at every moment in time, which makes the process of obtaining results easier and faster.
Our new indicator displays the following important patterns:
- Order Blocks.
- Imbalance – Fair Value Gap (FVG).
- Break Of Structures (BoS).
- Change of character (CHoCH).
- Equal highs & lows.
- Premium, Equilibrium and Discount zones.
- Pivot points.
Calculations are made simultaneously for two different periods:
- Swing (Longer period).
- Internal (Shorter period).
The calculation results for both modes are simultaneously displayed on the graph. Each mode uses its own colors and styles to display.
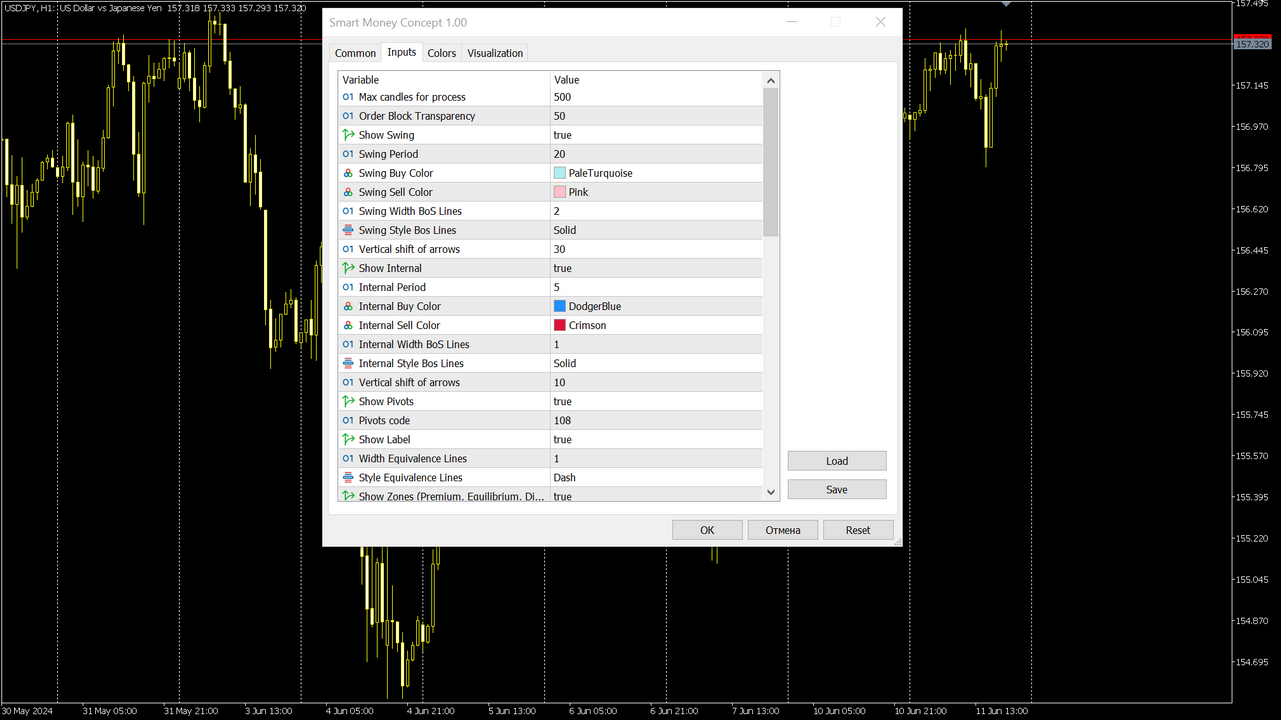
To speed up calculations and reduce the load, we use a customizable value for the “depth” of history calculations. The input parameter "Max candles for process" is responsible for this.
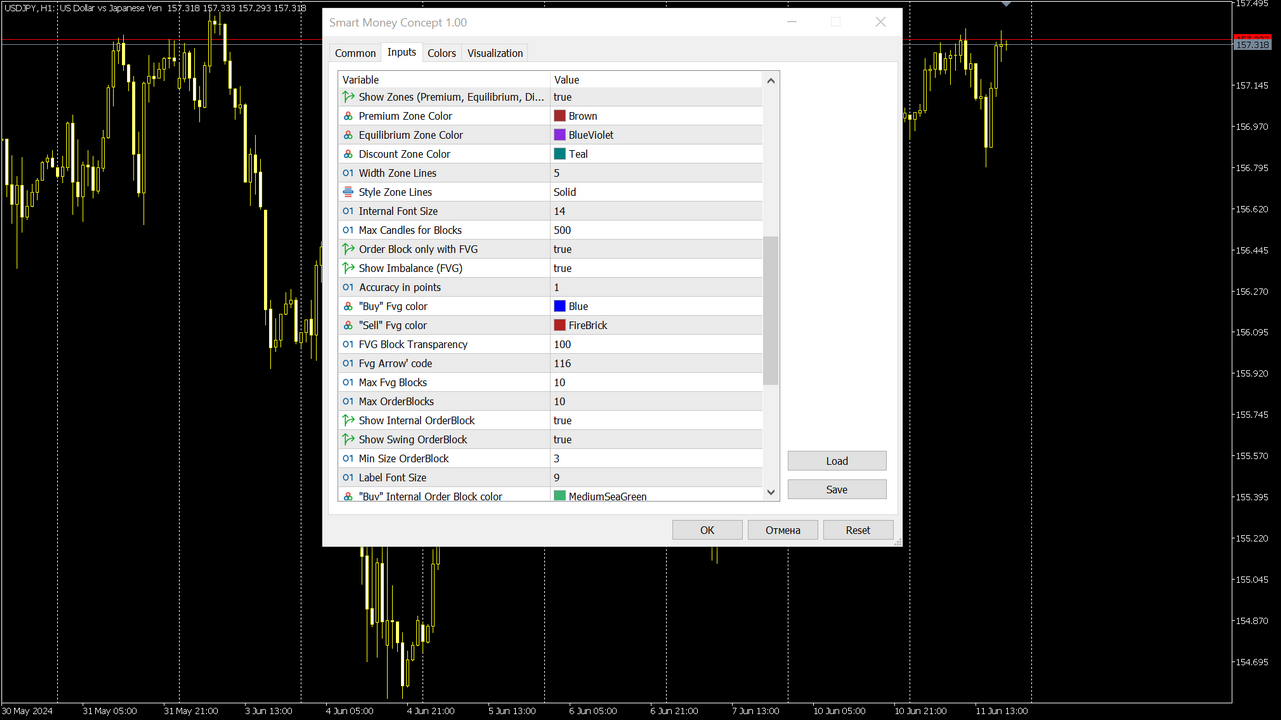
The number of blocks displayed is controlled by the "Max OrderBlocks" and "Max Fvg Blocks" parameters. The indicator will display no more than the specified number of blocks.
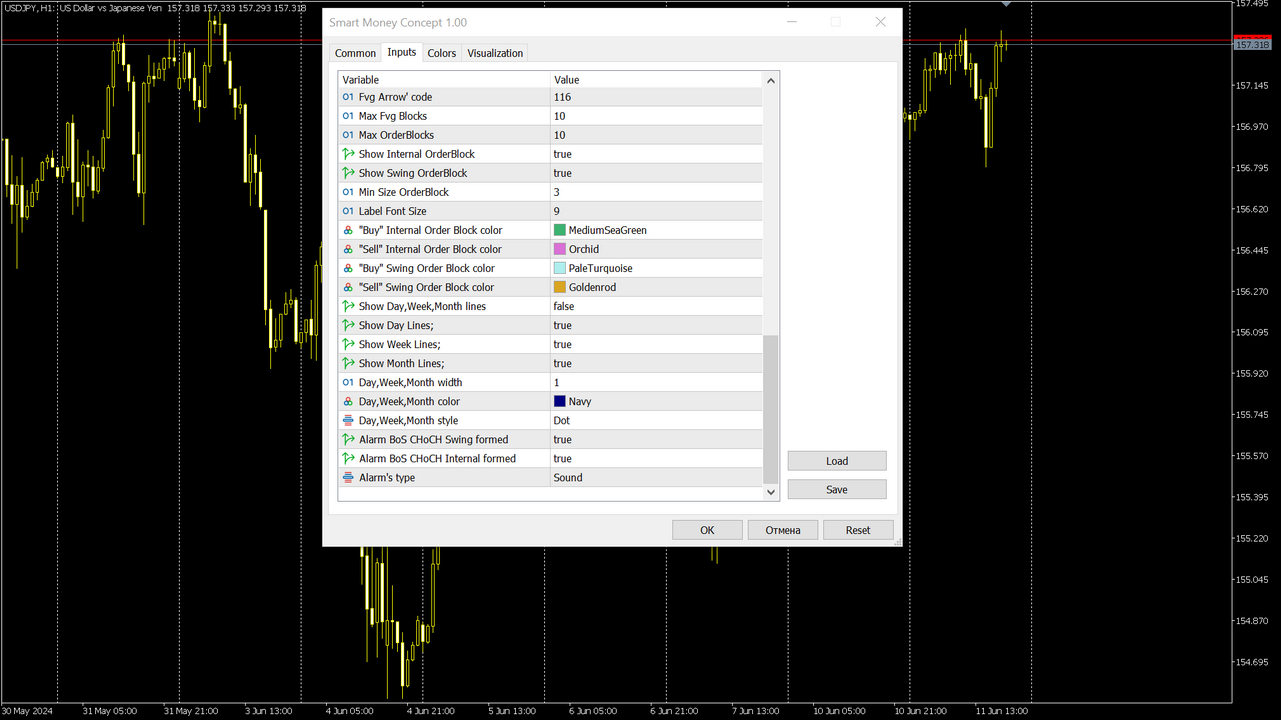
The display of some patterns can be disabled and enabled if more free space is needed.
Styles, colors, fonts of all patterns are customizable.
The version for MetaTrader 4 is here.