FIBOChannels

Fibonacci Channel

What is a Fibonacci Channel?

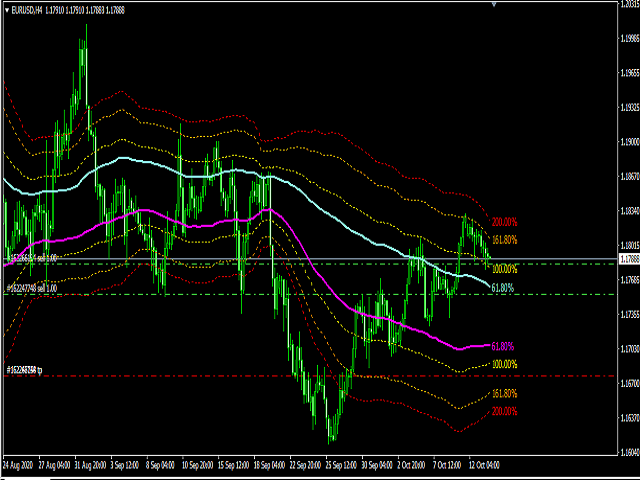
The Fibonacci channel is a technical analysis tool that is used to estimate support and resistance levels based on the Fibonacci numbers. It is a variation of the Fibonacci retracement tool, except with the channel the lines run diagonally rather than horizontally. It can be applied to both short-term and long-term trends, as well as to uptrend and downtrends. Lines are drawn at 23.6, 38.2, 50, 61.8, 78.6, 100, 161.8, 200, 261.8, 361.8 and 423.6 percent, at the discretion of the trader.

How to Calculate a Fibonacci Channel

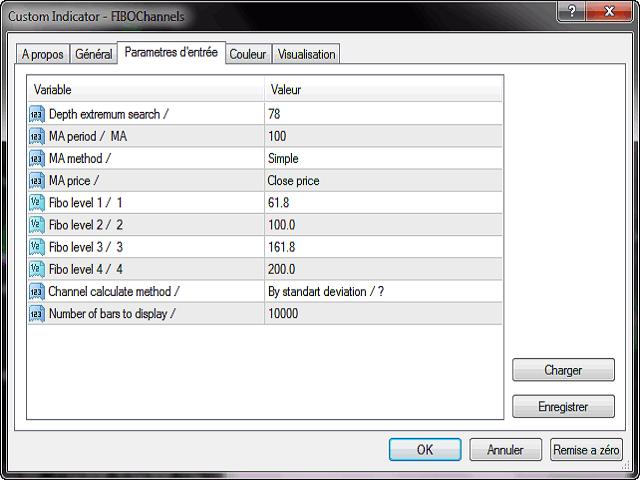
A Fibonacci channel doesn't require a formula. The channels are drawn at certain percentages of the price move selected by the trader.


What Does a Fibonacci Channel Tell You?

In order to draw a Fibonacci channel, the trader must first determine the trend direction.


FIBOChannels , which is calculated based on the maximum distance between the price and MA


おすすめのプロダクト
The Market Structures Pro indicator finds and displays 5 (five) patterns of the Smart Money Concepts (SMC) system on the chart, namely: Break Of Structures (BoS)       Change of character (CHoCH) Equal Highs & Lows Premium, Equilibrium and Discount zones with Fibo grid High-high, Low-low, High-low and Low-high extremes Patterns are displayed for two modes - Swing and Internal and are easily distinguished by color on the chart. Internal mode features higher contrast colors, finer lines, and smal
Советник  представляет собой многофункциональную торговую систему BBMA Oma Ally с интеграцией Telegram для удаленного управления и получения уведомлений. Основная специализация - анализ паттернов ценового действия и автоматическое оповещение о торговых возможностях. Основные функции 1. Система оповещений через Telegram Управление командами: Отслеживание и выполнение команд из Telegram Уведомления: Мгновенные оповещения о торговых сигналах Удаленное управление: Возможность управления советнико
ゴールドターゲットは最良のトレンド指標です。 このインジケーターの独自のアルゴリズムは、テクニカル分析と数学的分析の要素を考慮して資産価格の動きを分析し、最も収益性の高いエントリーポイントを決定し、矢印の形でシグナルと価格レベル(買いエントリー/売りエントリー)を発行します。 注文を開きます。 このインジケーターには、ストップロスの価格レベルとテイクプロフィットの 5 つの価格レベルもすぐに表示されます。 注意: このインジケーターは非常に使いやすいです。 ワンクリックでチャートにインジケーターをインストールし、そのシグナルと価格レベルに基づいて取引します。チャート上では、インジケーターが設置されている時間枠に関わらず、4つの時間枠(M30 H1 H4 D1)からトレンド状況が表示されます。 インジケーターの利点: 1. インジケーターは高精度の信号を生成します。 2. インジケーター信号は再描画されません。 価格が各ラインを超えた場合に音声通知(アラート&メッセージ)を搭載しています。 3. どのブローカーの MetaTrader 4 取引プラットフォームでも取引できます。
Crypto_Forex MT4用インジケーター「ブレイクアウトバーパターン」。リペイントなし、遅延なし。 - インジケーター「ブレイクアウトバーパターン」は、プライスアクショントレードに非常に強力なインジケーターです。 - インジケーターはチャート上のブレイクアウトバーパターンを検出します。 - 強気のブレイクアウトバーパターン - チャート上の青い矢印シグナル(画像参照)。 - 弱気のブレイクアウトバーパターン - チャート上の赤い矢印シグナル(画像参照)。 - PC、モバイル、メールアラート対応。 - インジケーター「ブレイクアウトバーパターン」は、サポートレベル/レジスタンスレベルと組み合わせるのに最適です。 Click here to see high quality Trading Robots and Indicators! これは、このMQL5ウェブサイトでのみ提供されるオリジナル製品です。
As the title says, this is an indicator that shows the current open market (session). It has 4 sessions with customizable schedule : 1. London session, 2. New York session, 3. Sydney session, 4. Tokyo session. Indicator inputs: - The color of each session. - The open time and close time of the sessions. - The line width. The objective of the indicator, is to follow each sessions, observe at what times are multiple sessions open, and thus take the chance of the high market movements.
FREE
Fibonacci calculator is used with Elliot Waves, it can generate remarkable results. A trader could use these levels or ratios to find high probability trades with very small stop loss. You may also use these ratios to find Elliott Waves extensions and to book profit near those levels. For Elliot Wave experts, Fibonacci calculator is a highly useful tool that can assist them in calculating Fibonacci extension and retracement levels for the market price. The indicator proves itself as a useful one
After working during many months, with the help of Neural Networks, we have perfected the ultimate tool you are going to need for identifying key price levels (Supports and Resistances) and Supply and Demand zones. Perfectly suitable to trigger your trades, set up your future actions, decide your Take Profit and Stop Loss levels, and confirm the market direction. Price will always move between those levels, bouncing or breaking; from one zone to another, all the remaining movements are just mark
Индикатор "BO  indicator at zero bar" для торговли бинарных опционов. Индикатор выдаёт свои сигналы на нулевом баре не перерисовывает и не меняет свои показатели при переключении временных периодов. Рекомендую использовать индикатор совместно с другим индикатором как фильтр  "BO indicator at zero bar" indicator for binary options trading. The indicator gives its signals on the zero bar, does not redraw and does not change its indicators when switching time periods. I recommend using the indicato
トレンド指標は、金融市場での取引に使用されるテクニカル分析の領域の 1 つです。 Angular Trend Lines ー - トレンドの方向を総合的に判断し、エントリー シグナルを生成します。ろうそくの平均方向を平滑化するだけでなく トレンドラインの傾斜角度も使用します。傾斜角の基礎として、ガン角を構築する原理が採用されました。 テクニカル分析インジケーターは、ローソク足の平滑化とチャートの形状を組み合わせたものです。 トレンド ラインと矢印には 2 つの種類があります。赤い線と矢印は強気方向、紫の線と矢印は弱気方向です。 インジケーターの機能 このインジケーターは使いやすく、パラメータの設定も簡単で、トレンド分析や注文開始のシグナルの受信に使用できます。 インジケーターは再描画されず、ローソク足の終値に矢印が表示されます。 信号が発生したときに複数の種類のアラートを提供します。 あらゆる金融商品(外国為替、暗号通貨、貴金属、株式、指数)に使用できます。 このインジケーターは、どの時間枠やチャートでも機能します。 このインジケーターはプロセッサに負荷をかけない軽量アルゴリズム
This   Rattling Signal Point   indicator is designed for signal trading. This indicator generates trend signals. It uses many algorithms and indicators to generate this signal. It tries to generate signals from the points with the highest trend potential. This indicator is a complete trading product. This indicator does not need any additional indicators. The indicator is never repainted. The point at which the signal is given does not change. When the signal comes the arrows are put back on
# TrendBoard - Painel Definitivo de Análise Técnica Multi-Timeframe **Transforme seu trading com a ferramenta de análise de tendências mais abrangente do mercado!** ## **VERSÃO GRATUITA DISPONÍVEL - Baixe e Teste Agora!** Experimente o poder da análise técnica de nível profissional na ponta dos seus dedos. Baixe a versão de teste e descubra por que os traders chamam isso de "mudança de jogo" para sua estratégia de trading. ## **Por Que o TrendBoard é Diferente** O TrendBoard combina
Quantina Multi Indicator Reader can analyse up to 12 most popular and commonly used together indicators in seconds on any timeframe, on any currency pair, stocks or indices. On the chart panel you can easily read each indicators default meanings and also there is an Indicators Summary on panel. Features 1 file only: Quantina Multi Indicator Reader is 1 file only. No need to install other indicators to work. It is using the built-in indicators from MetaTrader 4 terminal. Detailed Alert Message:
ForexAurum Fibonacci indicator is a useful tool for traders who are using Fibonacci combined with the ZigZag indicators. It uses the real-time calculation of the levels for all the timeframes and displays the results for you. In addition, you can setup RSI, ADX and Stochastic indicators to confirm entries. How to use it Just drag and drop the indicator on an 1 minute chart of any symbol. Then you can switch to a higher timeframe at anytime after the initialization. Recommendation Always drag a
Candle Scanner Dashboard is an incredibly powerful tool in the financial markets. It excels at detecting market reversals, trend changes, and retracements. The dashboard displays patterns as they are identified, and with a simple click on each pattern, you can view them on their dedicated charts to precisely locate their occurrences. With its capability to detect 11 popular bullish and 11 bearish patterns, you can trust the dashboard to handle pattern identification effortlessly. It provides an
Description: The indicator predicts, with a specific probability, if the actual candlestick range will expand or contract compared to the range of a previous candle. Furthermore, the indicator shows the possible high or low of the actual candle, based on trend direction. (Recommended for Daily, Weekly, or Monthly timeframes). KEY LINKS:   Indicator Manual  –  How to Install  –  Frequent Questions  -  All Products  How to use the indicator: Determines, with a certain probability, if there will b
This indicator simplifies your entry zones by displaying the areas where you can plan your entry that potentially could give you high risk/reward ratios. Other than picking the most optimal entry points, the Hot Zone indicator can act as your typical support/resistance indicator for pullbacks for all timeframes. You can use this indicator as the only trading indicator or use it with another indicator for reentry purposes.  Besides, when using Hot Zones, the risk/reward ratio should be well abov
YK-Fibo Pivot Indicator: Trade Smarter with Fibonacci Pivot Points The YK-Fibo Pivot Indicator is a powerful technical analysis tool that combines the precision of Fibonacci retracements with the insights of Pivot Points. Whether you're a novice or seasoned trader, this indicator empowers you to spot profitable opportunities in the market with ease. Why Choose YK-Fibo Pivot? Pinpoint Support & Resistance: By calculating Fibonacci levels based on the previous day's high, low, and close prices, y
This EA is an extension for the free trade indicator Trend Mate . https://www.mql5.com/en/market/product/50082 The main idea is to support your decision to  trade  according to the current trend. It is possible to configure alert and push notification to receive when entering to first candle for bull / bear trend. For this extension of the free indicator now it is possible to filter the current trend info with other timeframes. For example show trend for timeframe M5 considering also timeframe
FinArk Support and Resistance is an indicator that will detect support and resistance zone that are drawn on the chart by automatic. Supply Demand uses previous price action to identify potential imbalances between buyers and sellers. This trend detection indicator will compliment any strategy and can also be used as an independent tool.  We can enter in good price with this Indicator, in order to follow the   strong demand   on the current instrument. 
This indicator scans for you up to 30 trading instruments and up to 8 timeframes for occurrences of the high probability reversal patterns: Double Tops/Bottoms with fake breakouts . Please read also the blog post " Professional Trading With Double Tops/Bottoms And Divergences! " which explains the concepts behind the ULTIMATE Double Top/Bottom indicator and how you can use a professional top-down approach. This FREE Version of the Scanner scans only EURUSD and GBPUSD. The full version of the sca
FREE
Description : In the world of trading, candlestick patterns are a popular technical analysis tool used by many traders.   There are numerous candlestick patterns, ranging from reversal patterns to continuation patterns. However, remembering all these patterns can be challenging, especially for novice traders. This often leads to traders having to manually memorize and identify candlestick patterns, which can be time-consuming and prone to errors. Candle Pattern Pro is a powerful indicator design
KT Pin Bar
KEENBASE SOFTWARE SOLUTIONS
KT Pin Bar identifies the pin bar formation which is a type of price action pattern which depicts a sign of reversal or rejection of the trend. When combined with support and resistance, BRN and other significant levels, Pin Bar pattern proved to be a very strong sign of reversal. Basically, a pin bar is characterized by a small body relative to the bar length which is closed either in upper or lower 50% part of its length. They have very large wicks and small candle body. A pin bar candlestic
the indicator for trading binary options is excellent for traders using scalping or trading from support levels of resistance or for their breakdown, the indicator is recommended to be used in conjunction with additional filters to avoid entering a losing trade, signal can also be used with Bollinger Bands   Signals are formed on the current candle to enter the next
Candle Probability Scalper 使用ガイド このインジケーターはスキャルピングを簡単かつ100%直感的にします。 Candle Probability Scalper は、 リアルタイム で現在のローソク足における買い手と売り手の強さのパーセンテージを一目で表示します。 パーセンテージは各ティックごとに更新されるため、秒ごとに買い手と売り手が何をしているのかを知ることができ、遅延はありません。これにより、各勢力の強さを判断または確認し、価格の動向を予測するのに大いに役立ちます。 以下は使用方法のガイドです: 1. M1での買い手と売り手のパーセンテージを確認し、他の時間枠(M5、M15)で確認する: M1での買い手のパーセンテージが60%以上 で、M5およびM15でもM1と一致して60%以上である場合、 買い の良いシグナルがあります。 M1での売り手のパーセンテージが60%以上 で、M5およびM15でもM1と一致して60%以上である場合、 売り の良いシグナルがあります。 これにより、勢いが一時的ではなく、方向性が堅固であることが確認されます。 非常にシンプ
Super Signal Market Slayer 非リペイント|高精度|マルチマーケット対応インテリジェントトレンド指標 トレードにおいて本当に難しいのは、 注文することではなく、相場のノイズの中で「トレンドが始まった瞬間」を見極めることです。 Market Slayer はそのために開発されました。 本インジケーターは、日中取引向けに設計された非リペイント型のインテリジェント指標です。 多層確認とトレンドフィルターにより、重要な局面でのみ明確かつ信頼性の高い Buy / Sell シグナルを表示します。 主な特長 非リペイントシグナル 一度表示されたシグナルは固定され、消えたり移動したりしません。 高精度なトレンド判定 複数銘柄で検証され、特にゴールド M5 / M15 で安定した結果を示します。 マルチマーケット対応 ゴールド、FX、指数、主要暗号資産に対応。 日中取引向け最適化 M5・M15 に特化し、ノイズを抑え実行性を向上。 直感的で分かりやすい 初心者でも理解しやすく、すぐに使用可能。 技術ロジック概要 Market Slayer は単一条件の矢印ではありません。 以
Crypto_Forex インジケーター INSIDE バー パターン (MT4 用)。 - インジケーター「INSIDE バー」は、プライス アクション トレーディングに非常に強力なインジケーターです。 - インジケーターはチャート上の INSIDE バー パターンを検出します: - 強気 INSIDE バー - チャート上の青い矢印シグナル (画像を参照)。 - 弱気 INSIDE バー - チャート上の赤い矢印シグナル (画像を参照)。 - 再描画なし、遅延なし、高い R/R 比率 (報酬/リスク)。 - PC、モバイル、および電子メール アラート付き。 - インジケーター「INSIDE バー パターン」は、サポート/レジスタンス レベルと組み合わせるのに最適です。 高品質のトレーディングロボットとインジケーターをご覧になるにはここをクリックしてください! これは、この MQL5 Web サイトでのみ提供されるオリジナル製品です。
Awesome Oscillator by Bill Williams with the ability to fine-tune and replace the averaging algorithms of the indicator, which significantly expands the possibilities of using this oscillator in algorithmic trading and brings it closer in its properties to such an indicator as the MACD. To reduce price noise, the final indicator is processed with an additional Smooth averaging. The indicator has the ability to give alerts, send mail messages and push signals when the direction of movement of th
Elite SR - Advanced Level Indicator for automatic detection of support and resistance levels with different degree of credibility should become a part of your trading arsenal. This indicator is accessible via iCustom function and provides level values as well as their degree of credibility. Elite SR is fully adjustable and can work on any time-frame with any trading instrument! Important information For all detailed information about this indicator you can visit 747Developments website. Featur
TOP DOWN PREMIUM INDICATOR (mt4 version) Introduction The TOP DOWN PREMIUM INDICATOR is the King of Top-Down Analysis Tools for MT4 traders. It gives you the ability to analyze the market across all major timeframes — from as small as hourly data up to yearly projections — with unparalleled accuracy and clarity. This indicator allows traders to forecast, label, and visualize market structure from short-term intraday moves to long-term yearly cycles . With its built-in multi-timeframe forecast
MoveWave - Moving waves are very handy indicators for determining pivot levels. Most Forex traders make decisions based on technical analysis. This type of analysis determines patterns and trends in the market. With the help of complex mathematical equations that are combined and made out in the form of this indicator, the trader will be able to more accurately determine the price reversal levels. Wave theory mathematically represents various behavioral models of the market. It is used as the ba
このプロダクトを購入した人は以下も購入しています
Gann Made Easy は、ミスター・ギャンの理論を使用した取引の最良の原則に基づいた、プロフェッショナルで使いやすい外国為替取引システムです。 W・D・ガン。このインジケーターは、ストップロスとテイクプロフィットレベルを含む正確な買いと売りのシグナルを提供します。 PUSH通知を利用して外出先でも取引可能です。 ご購入後、取引方法の説明と優れた追加インジケーターを無料で入手するには、私にご連絡ください! おそらく、ギャンの取引手法についてはすでに何度も聞いたことがあるでしょう。通常、ギャンの理論は初心者のトレーダーだけでなく、すでにある程度の取引経験がある人にとっても非常に複雑なものです。なぜなら、ギャンの取引手法は理論的にはそれほど簡単に適用できるものではないからです。私はその知識を磨き、最良の原則を私の外国為替インジケーターに組み込むために数年を費やしました。 このインジケーターは非常に簡単に適用できます。必要なのは、それをチャートに添付し、簡単な取引推奨事項に従うだけです。このインジケーターは常に市場分析の仕事を行い、取引の機会を探します。適切なエントリーポイントを検出す
M1 SNIPER は使いやすいトレーディングインジケーターシステムです。M1時間足向けに設計された矢印インジケーターです。M1時間足でのスキャルピングのためのスタンドアロンシステムとして、また既存のトレーディングシステムの一部としても使用できます。このトレーディングシステムはM1時間足での取引に特化して設計されていますが、他の時間足でも使用できます。元々、この手法はXAUUSDとBTCUSDの取引用に設計しましたが、他の市場においても役立つと考えています。 インジケーターのシグナルは、トレンドの方向と逆方向に取引できます。インジケーターのシグナルを利用して両方向に取引するのに役立つ特別な取引テクニックをご紹介します。この手法は、特別な動的なサポートとレジスタンスの価格帯を利用することに基づいています。 ご購入後、M1 SNIPER矢印インジケーターをすぐにダウンロードできます。さらに、M1 SNIPERツールのすべてのユーザーに、以下のスクリーンショットに表示されているApollo Dynamic SRインジケーターを無料で提供しています。この2つのインジケーターを組み合わせることで
Game Changerは、あらゆる金融商品で使用できる革新的なトレンドインジケーターです。MetaTraderを強力なトレンドアナライザーへと変貌させます。あらゆる時間枠で動作し、トレンドの特定、反転の可能性のシグナル、トレーリングストップ機能、そして迅速な市場反応のためのリアルタイムアラートを提供します。経験豊富なプロでも、優位性を求める初心者でも、このツールは自信と規律、そして根本的なトレンドダイナミクスを明確に理解した上で取引を行うための力となります。このインジケーターはリドロー機能も備えています。 購入後すぐにご連絡いただければ、個人ボーナスを進呈いたします。Strong SupportとTrend Scannerインジケーターの無料コピーを入手できます。[email protected]までプライベートメッセージを送ってください。 私のEAや特別なセットはTelegramでは販売しておりません。MQL5でのみ販売しており、セットファイルは私のブログでのみ公開しています。詐欺師にはご注意ください。他の方からセットを購入しないでください。 設定 トレンド変化時のアラート
An exclusive indicator that utilizes an innovative algorithm to swiftly and accurately determine the market trend. The indicator automatically calculates opening, closing, and profit levels, providing detailed trading statistics. With these features, you can choose the most appropriate trading instrument for the current market conditions. Additionally, you can easily integrate your own arrow indicators into Scalper Inside Pro to quickly evaluate their statistics and profitability. Scalper Inside
Dynamic Forex28 Navigator - 次世代の Forex 取引ツール。 現在 49% オフ。 Dynamic Forex28 Navigator は、長年人気のインジケーターを進化させたもので、3 つの機能を 1 つにまとめています。 Advanced Currency Strength28 インジケーター (レビュー 695 件)  + Advanced Currency IMPULSE with ALERT (レビュー 520 件) + CS28 コンボ シグナル (ボーナス)。 インジケーターの詳細 https://www.mql5.com/en/blogs/post/758844 次世代の Strength インジケーターが提供するもの  オリジナルで気に入っていたすべての機能が、新機能と精度の向上によって強化されました。 主な機能: 独自の通貨強度計算式。 すべての時間枠でスムーズかつ正確な強度ライン。 トレンドの特定と正確なエントリーに最適です。 ダイナミックマーケットフィボナッチレベル (マーケットフィボナッチ)。 このインジケーターに固有
まず第一に、この取引インジケーターは再描画されず、再描画されず、遅延しないことを強調する価値があります。これにより、手動取引とロボット取引の両方に理想的なものになります。 ユーザーマニュアル:設定、入力、戦略。 アトミックアナリストは、価格の強さとモメンタムを利用して市場でより良いエッジを見つけるためのPA価格アクションインジケーターです。ノイズや誤ったシグナルを除去し、取引ポテンシャルを高めるための高度なフィルターを備えています。複雑なインジケーターの複数のレイヤーを使用して、アトミックアナリストはチャートをスキャンし、複雑な数学的計算をシンプルなシグナルと色に変換します。これにより、どのような初心者トレーダーでも理解して使用し、一貫した取引の決定を行うことができます。 「アトミックアナリスト」は、新規および経験豊富なトレーダー向けにカスタマイズされた包括的な取引ソリューションです。プレミアムインジケーターとトップノッチの機能を1つの取引戦略に組み合わせ、すべてのタイプのトレーダーにとって汎用性のある選択肢にします。 デイリートレーディングとスキャルピング戦略:高速で正確な
GOLD Impulse with Alert
Bernhard Schweigert
4.64 (11)
このインディケータは、当社の2つの製品 Advanced Currency IMPULSE with ALERT  +   Currency Strength Exotics . のスーパーコンビネーションです。 このインジケーターは全ての時間枠で作動し、8つの主要通貨と1つのシンボルの強弱のインパルスをグラフで表示します。 このインジケータは、金、エキゾチックペア、商品、インデックス、先物など、あらゆるシンボルの通貨強度の加速度を表示することに特化されています。金、銀、原油、DAX、US30、MXN、TRY、CNHなどの通貨強度の加速度(インパルスまたは速度)を表示するために、任意のシンボルを9行目に追加できる、この種の最初のものです。 新しいアルゴリズムに基づいて構築され、潜在的な取引の特定と確認がさらに容易になりました。これは、通貨の強さや弱さが加速しているかどうかをグラフィカルに表示し、その加速の速度を測定するためです。加速すると物事は明らかに速く進みますが、これはFX市場でも同じです。つまり、反対方向に加速している通貨をペアリングすれば、潜在的に利益を生む取引を特定
Scalper Vault は、スキャルピングを成功させるために必要なすべてを提供するプロフェッショナルなスキャルピング システムです。このインジケーターは、外国為替およびバイナリー オプションのトレーダーが使用できる完全な取引システムです。推奨される時間枠は M5 です。 システムは、トレンドの方向に正確な矢印シグナルを提供します。また、トップとボトムのシグナルとギャン マーケット レベルも提供します。 インジケーターは、プッシュ通知を含むすべてのタイプのアラートを提供します。 インジケータの購入後にご連絡ください。私の個人的な取引の推奨事項と素晴らしいボーナス指標を無料で共有します! 幸せで有益な取引をお祈りします!
現在40%OFF! このダッシュボードは、複数のシンボルと最大9つのタイムフレームで動作するソフトウェアの非常に強力な部分です。 このソフトは、弊社のメインインジケーター(ベストレビュー:Advanced Supply Demand)をベースにしています。    Advanced Supply Demand ダッシュボードは、素晴らしい概要を提供します。それは示しています。  ゾーン強度評価を含むフィルタリングされた需給値。 ゾーン内/ゾーンへのPips距離。 ネストされたゾーンがハイライトされます。 選択されたシンボルの4種類のアラートを全ての(9)時間枠で提供します。 それはあなたの個人的なニーズに合わせて高度に設定可能です。 あなたの利益! すべてのトレーダーにとって最も重要な質問です。 市場に参入するのに最適なレベルはどこか? 成功のチャンスとリスク/リターンを得るために、強力な供給/需要ゾーン内またはその近くで取引を開始します。 損切りの最適な位置はどこですか? 最も安全なのは、強力な供給/需要ゾーンの下/上にストップを置くことです。 最適な利益
Trend Screener
STE S.S.COMPANY
4.79 (95)
トレンドインジケーター、1つのツールに組み込まれたすべての重要なトレンド機能を備えたトレンドトレーディングとフィルタリングのための画期的なユニークなソリューション! これは、すべてのシンボル/商品(外国為替、商品、暗号通貨、インデックス、株式)で使用できる100%再描画されていないマルチタイムフレームおよびマルチ通貨インジケーターです。 期間限定オファー: サポートおよびレジスタンス スクリーナー インジケーターは、たった 50 ドルで永久的にご利用いただけます。(元の価格 250 ドル) (オファー延長) トレンドスクリーナーは、チャート内のドットで矢印トレンドシグナルを提供するインジケーターに続く効率的なインジケーターです。 トレンド分析インジケーターで使用できる機能: 1.トレンドスキャナー。 2.最大利益分析を備えたトレンドライン。 3.トレンド通貨強度メーター。 4.アラート付きのトレンド反転ドット。 5.アラート付きの強いトレンドドット。 6.トレンド矢印 毎日の分析例、毎日のシグナルパフォーマンス...など、トレンドスクリーナーインジケーターを使用して、ここで見つけること
現在40%OFF! 初心者やエキスパートトレーダーのためのベストソリューション! このダッシュボードソフトウェアは、28の通貨ペアで動作しています。それは私達の主要な指標(高度な通貨の強さ28と高度な通貨インパルス)の2に基づいています。それは全体の外国為替市場の大きい概観を与えます。それは、すべての(9)時間枠で28の外国為替ペアのための高度な通貨の強さの値、通貨の動きの速度と信号を示しています。チャート上で1つのインディケータを使用して市場全体を観察し、トレンドやスキャルピングの機会をピンポイントで見つけることができたら、あなたのトレードがどのように改善されるか想像してみてください。 このインディケータには、強い通貨と弱い通貨の識別、潜在的な取引の識別と確認がより簡単になるような機能が搭載されています。このインディケータは、通貨の強さや弱さが増加しているか減少しているか、また、すべての時間枠でどのように機能しているかをグラフィカルに表示します。 新機能として、現在の市場環境の変化に適応するダイナミックなマーケットフィボナッチレベルが追加され、すでに当社のAdvanced
このインジケーターを購入すると、プロ仕様のトレードマネージャーを無料で差し上げます。 まず第一に、このトレーディングシステムがノンリペイント、ノンリドロー、ノンラグのインジケーターであることを強調する価値がある。これにより、手動取引とロボット取引の両方に理想的なものになっています。 オンラインコース、マニュアル、プリセットのダウンロード。 「スマートトレンドトレーディングシステム MT5」は、新規および経験豊富なトレーダー向けにカスタマイズされた包括的なトレーディングソリューションです。10以上のプレミアムインジケーターを組み合わせ、7つ以上の堅実なトレーディング戦略を備えており、多様な市場状況に対応する多目的な選択肢となっています。 トレンドフォロー戦略:トレンドを効果的に乗り越えるための正確なエントリーとストップロス管理を提供します。 リバーサル戦略:潜在的なトレンドの反転を特定し、トレーダーがレンジ相場を活用できるようにします。 スキャルピング戦略:高速で正確なデイトレードおよび短期取引のために設計されています。 安定性:すべてのインジケーターはノンリペイント、ノンリドロー、ノ
FX Power: 通貨の強弱を分析して、より賢い取引を実現 概要 FX Power は主要通貨と金の実際の強弱をあらゆる市場状況で理解するための必須ツールです。強い通貨を買い、弱い通貨を売ることで、 FX Power は取引の意思決定を簡素化し、高い確率の取引機会を見出します。トレンドを追従する場合でも、極端なデルタ値を使用して反転を予測する場合でも、このツールはあなたの取引スタイルに完全に適応します。ただ取引するだけではなく、 FX Power で賢く取引をしましょう。 1. なぜ FX Power がトレーダーにとって非常に有益なのか 通貨と金のリアルタイム強弱分析 • FX Power は主要通貨と金の相対的な強弱を計算し、マーケットダイナミクスに関する明確な洞察を提供します。 • どの資産がリードしているか、または後れを取っているかを監視して、取引するペアを賢く選びましょう。 マルチタイムフレームの包括的なビュー • 短期、中期、長期のタイムフレームで通貨と金の強弱を追跡し、マーケットトレンドに基づいて取引戦略を調整できます。 • スキャルピングからスイングトレード
Volatility Trend System - a trading system that gives signals for entries. The volatility system gives linear and point signals in the direction of the trend, as well as signals to exit it, without redrawing and delays. The trend indicator monitors the direction of the medium-term trend, shows the direction and its change. The signal indicator is based on changes in volatility and shows market entries. The indicator is equipped with several types of alerts. Can be applied to various trading ins
El indicador "MR BEAST ALERTAS DE LIQUIDEZ" es una herramienta avanzada diseñada para proporcionar señales y alertas sobre la liquidez del mercado basándose en una serie de indicadores técnicos y análisis de tendencias. Ideal para traders que buscan oportunidades de trading en función de la dinámica de precios y los niveles de volatilidad, este indicador ofrece una visualización clara y detallada en la ventana del gráfico de MetaTrader. Características Principales: Canal ATR Adaptativo: Calcula
このインジケーターは、反転ポイントと価格戻りゾーンを正確に表示します。     主要プレーヤー 。新たなトレンドが形成される場所を把握し、最大限の精度で意思決定を行い、すべての取引をコントロールします。 TREND LINES PRO インジケーターと組み合わせることで、その潜在能力を最大限に発揮します。 VERSION MT5 インジケーターが示す内容: 新しいトレンドの始まりに活性化する反転構造と反転レベル。 リスクと報酬の比率を最小限に抑えた利益 確定 と 損失停止の レベルの表示     RR 1:2   。 インテリジェントな削減ロジックによるストップロス。 指定されたインジケーターから 2 つのトレンド タイプの反転パターンを表示します。 指標: トレンドを追う   TREND LINES PRO   (世界的なトレンドの変化) TREND PRO   (クイックトレンド変更) シンプルで効果的   スキャナー   リアルタイムトレンド(新機能)。 マルチタイムフレームのインストゥルメント フィルタリング。 画面   利益     LOGIC AI信号の後。 当日プラス方
これはほぼ間違いなく、MetaTraderプラットフォームで見つけることができる最も完全な調和価格形成自動認識インジケーターです。 19種類のパターンを検出し、フィボナッチプロジェクションをあなたと同じように真剣に受け止め、潜在的逆転ゾーン(PRZ)を表示し、適切なストップロスとテイクプロフィットレベルを見つけます。 [ インストールガイド | 更新ガイド | トラブルシューティング | よくある質問 | すべての製品 ] 19の異なる調和価格形成を検出します プライマリ、派生および補完フィボナッチ投影(PRZ)をプロットします 過去の価格行動を評価し、過去のすべてのパターンを表示します この指標は、独自の品質とパフォーマンスを分析します 適切なストップロスとテイクプロフィットのレベルを表示します ブレイクアウトを使用して適切な取引を通知します すべてのパターン比をグラフにプロットします 電子メール/音声/視覚アラートを実装します スコット・M・カーニーの本に着想を得て、この指標は最も純粋で急を要するトレーダーのニーズを満たすように設計されています。ただし、トレードを容易にする
Weis Wave with Alert
Trade The Volume Waves Single Member P.C.
4.82 (22)
Rental/Lifetime Package Options and Privileges' Rent Monthly Six Months   Yearly/Lifetime Weis Wave with Speed with Alert+Speed Index x x x Manual  x x x Quick Set up Video x x x Blog x x x Lifetime Updates x x x Setup and Training Material x x Rectangle Break Alert Tool      x Discord Access Channel "The SI traders" x   How to trade info visit:    http://www.tradethevolumewaves.com   ** If you purchase please contact me to setup your  : training Room and  complete manual access.  This is
Apollo Secret Trend は、任意のペアと時間枠でトレンドを見つけるために使用できるプロのトレンド インジケーターです。インジケーターは、取引するペアや時間枠に関係なく、市場のトレンドを検出するために使用できる主要な取引インジケーターになることができます。インジケーターで特別なパラメーターを使用することにより、シグナルを個人の取引スタイルに適応させることができます。 このインジケーターは、PUSH 通知を含むすべてのタイプのアラートを提供します。インジケータの信号は再描画しないでください!提供されたスクリーンショットでは、アポロ シークレット トレンド インジケーターと買われ過ぎ/売られ過ぎのオシレーター インジケーターを組み合わせて見ることができます。これは完全に無料で提供されます。 購入後、2 番目の買われすぎおよび売られすぎのオシレーター インジケーターを無料で入手するために私に連絡してください!また、システムの使用方法についても説明します。お得な特典もご用意しております!
チャートを構成し、周期的な価格変動を識別するテクニカル指標。 どのチャートでも動作します。 いくつかの種類の通知。 グラフ自体に追加の矢印があります。 履歴を再描画せずに、キャンドルのクローズに取り組みます。 M5以上のTFを推奨します。 パラメータの使用と設定が簡単です。 異なるパラメータを持つ 2 つのインジケーターを使用する場合、他のインジケーターなしで使用できます。 入力パラメータは2つあります 周期性と信号持続時間 これら 2 つのパラメータは、チャート構造の処理を扱います。 Cyclicity - 反転サイクルが変化する頻度を調整し、サイクルを滑らかにします。 Signal duration - 最小数では価格変動の衝動を検出し、最大数では長期的なトレンドの動きを検出します。
通貨強さウィザードは、取引を成功させるためのオールインワン ソリューションを提供する非常に強力な指標です。このインジケーターは、複数の時間枠のすべての通貨のデータを使用して、このまたはその外国為替ペアのパワーを計算します。このデータは、使いやすい通貨インデックスと通貨パワーラインの形式で表され、特定の通貨のパワーを確認するために使用できます。 必要なのは、取引したいチャートにインジケーターを接続することだけです。インジケーターは、取引する通貨の実際の強さを示します。このインジケーターは、トレンドに合わせて取引するときに有利に利用できる売買高の圧力の極値も示します。このインジケーターには、フィボナッチに基づく可能なターゲットも表示されます。 このインジケーターは、PUSH 通知を含むあらゆるタイプのアラートを提供します。 購入後ご連絡下さい。私の取引のヒントをあなたと共有し、素晴らしいボーナスインジケーターを無料で提供します! 幸せで有益な取引をお祈りします。
Advanced Supply Demand
Bernhard Schweigert
4.91 (299)
現在40%オフ 初心者にもエキスパートトレーダーにも最適なソリューション このインジケーターは独自の機能と新しい公式を多数内蔵しており、ユニークで高品質かつ手頃な取引ツールです。このアップデートでは、2つの時間枠ゾーンを表示できるようになります。より長いTFだけでなく、チャートTFとより長いTF(ネストゾーンを表示)の両方を表示できます。すべてのSupply Demandトレーダーの皆さんのお気に召すはずです。:) 重要情報の公開 Advanced Supply Demandの可能性を最大化するには、 https://www.mql5.com/ja/blogs/post/720245 にアクセスしてください。   エントリーまたはターゲットの正確なトリガーポイントを正確に特定できれば取引がどのように改善されるか想像してみてください。新しい基盤となるアルゴリズムに基づいて構築されているため、買い手と売り手の間の潜在的な不均衡をさらに簡単に特定できます。これは、最も強い需要と供給のゾーンと、過去のパフォーマンス(古いゾーンを表示)がグラフィカルに表現されるためです。これらの機能は、最適な
Slayer Binary
Abdulkarim Karazon
5 (1)
スレイヤーバイナリーは、1キャンドルストライク矢印インジケーターのバイナリーオプションです。この指標は、聖杯を求める人向けではなく、一般的な取引に対して非現実的なアプローチです。この指標は一定のヒット率を示し、資金管理と日々の目標と組み合わせて使えば、さらに信頼性が高まります。インジケーターには以下に記載される多くの機能が備わっています: 特徴 再塗装なし:インジケーターは矢印をライブで再塗装しません。一度矢印が出ると、価格が逆方向に動いても矢印はその位置に留まります。 統計パネル:総合勝率%や最大損失勝ちシグナルなどの指標パフォーマンス統計を表示するパネル ダイバージェンスに基づく実証済み論理:この指標はダイバージェンス戦略を用いて売買矢印を決定します。 6つ以上の追加フィルター:インジケーターには勝率を上げ、無限のコンボを試せるための多数の追加フィルターがあります。 どうやってトレードするの? 単純に上向き矢印が出たときにコール/買いを開き、その期間の次のローソク足で取引を閉じればいいだけです...売却/プットシグナルも逆です。 日々の目標、例えば3勝者を挙げてから取引を停止す
トレンドラインプロ   市場の真の方向転換点を理解するのに役立ちます。この指標は、真のトレンド反転と主要プレーヤーが再び参入するポイントを示します。 分かりますか     BOSライン   複雑な設定や不要なノイズなしに、より長い時間足でのトレンドの変化と重要なレベルを把握できます。シグナルは再描画されず、バーが閉じた後もチャート上に残ります。 VERSION MT 5     -     RFI LEVELS PRO インジケーター と組み合わせることで、その潜在能力を最大限に発揮します。 インジケーターが示す内容: 本当の変化   トレンド(BOSライン) 一度シグナルが現れたら、それは有効です!これは、リペイント機能を持つインジケーターとの重要な違いです。リペイント機能を持つインジケーターは、シグナルを発した後、それを変更し、資金の損失につながる可能性があります。これにより、より高い確率と精度で市場に参入できます。また、矢印が現れた後、目標値(利益確定)に達するか、反転シグナルが現れるまで、ローソク足の色を変更する機能もあります。 繰り返しエントリ       主要プレーヤーの
PRO Renko Systemは、特別にRENKOチャートを取引するために設計された高精度の取引システムです。 これは、様々な取引商品に適用することができる普遍的なシステムです。 システムは効果的に正確な逆転信号へのアクセスを与えるいわゆる市場の騒音を中和する。 表示器は非常に使いやすく、信号の生成に責任がある1つの変数だけがあります。 あなたは簡単にお好みの任意の取引ツールとレンコバーのサイズにツールを適応させることができます。 私はいつもあなたが私のソフトウェアで収益性の高い取引を支援するために余分なサポートを提供する準備ができています! 私はあなたに幸せで収益性の高い取引をしたいです! ご購入後にご連絡ください! 私はあなたに私のレンコチャートジェネレータを送信します。 私はまた、私の個人的な推奨事項やシステムの他のモジュールを無料で共有します!
Top Bottom Tracker は、洗練されたアルゴリズムに基づき、市場のトレンドを分析し、トレンドの高値と安値を検出することができるインジケーターです / MT5バージョン 。 価格は500$に達するまで徐々に上昇します。次の価格 --> $99 特徴 リペイントなし このインジケーターは 新しいデータが到着してもその値を変更しません 取引ペア すべてのFXペア 時間枠 すべての時間枠 パラメーター ==== インジケータの設定 設定パラメータ // 40 (値が高いほど、シグナルは少なくなりますが、より正確です) 上レベル値 // 80 (上水平線の値) 下限値 // 20 (下限水平線の値) インジケータ計算バー // 3000 (何本分のインジケータを計算するか。0を指定すると、全てのバーに対してインジケータを計算します) ==== アラーム設定 ポップアップアラート // true (端末にアラームを表示) メールアラート // true (アラームをメールで通知) アラート時間間隔 // 10 (アラーム間隔 (分)) 警告
現在20%OFF! 初心者やエキスパートトレーダーに最適なソリューションです。 このインディケータは、エキゾチックペア・コモディティ・インデックス・先物など、あらゆるシンボルの通貨の強さを表示することに特化したインディケータです。金、銀、原油、DAX、US30、MXN、TRY、CNHなどの通貨の強さを表示するために、9行目にどのシンボルでも追加することができます。独自の機能を多数搭載し、新しい計算式を採用したため、ユニークで高品質、かつ手頃な価格のトレーディングツールとなっています。新しいトレンドやスキャルピングチャンスのトリガーポイントを正確に把握することができるため、あなたのトレードがどのように改善されるか想像してみてください。 ユーザーマニュアル:ここをクリック   https://www.mql5.com/en/blogs/post/708876 すべての時間枠に対応します。あなたはすぐにトレンドを見ることができるようになります! 新しいアルゴリズムに基づいて設計されているため、潜在的な取引の特定と確認がより簡単になります。これは、8つの主要通貨と1つのシンボルの強弱
No Repaint Bext は完全な取引システムです。エントリーとエグジットのタイミング、そして取引の方向を示します。 緑の矢印 が表示されるたびに、 買い注文 を開きます。 赤い矢印 が表示されたら、すべての買い注文を閉じます。 同様に、 赤い矢印 が表示されたら、 売り注文 を開き、 緑の矢印 が表示されたらすべての売り注文を閉じます。 取引には M5(1分足) を使用し、 どの通貨ペアでも取引可能 です。 このインジケーターは 再描画されず 、ほとんど遅延しません。ただし、 ローソク足が確定するまで待つ という自然な条件はあります。 RSI フィルター と**2 つのクラシックな反転パターン(エンゴルフィング、ピンバー)**を使用し、反転の瞬間をほぼリアルタイムで捉えます。 インジケーターの効果的な使い方 どの通貨ペアでも使用可能 (テスト済み: GBPUSD, EURUSD ) 時間足:M5(1分足) 初期資金:500ドル以上 取引ロット:0.01 緑の矢印 が表示されたら、買い注文を開く。 赤い矢印 が表示されたら、すべての買い注文を閉じる。 赤い矢印 が表示されたら、売
Are you looking for a simple and reliable indicator that can help you spot market swing points easily? Do you want clear buy and sell signals that work on any timeframe and any trading instrument? Buy Sell Signal Pro is designed to do exactly that. It helps traders identify important market turning points and understand the current market structure in a clear and easy way. This indicator detects Higher Highs (HH), Higher Lows (HL), Lower Highs (LH), and Lower Lows (LL) so you can quickly see wh
TrendLine PRO MT4
Evgenii Aksenov
4.83 (167)
The Trend Line PRO indicator is an independent trading strategy. It shows the trend change, the entry point to the transaction, as well as automatically calculates three levels of Take Profit and Stop Loss protection. Trend Line PRO is perfect for all Meta Trader symbols: currencies, metals, cryptocurrencies, stocks and indices. The indicator is used in trading on real accounts, which confirms the reliability of the strategy. Robots using   Trend Line PRO   and real Signals can be found here:   
作者のその他のプロダクト
MaxProfitDZ
Hafis Mohamed Yacine
5 (1)
Expert adviser MaxProfitDz v1.3   Recommendations EA Settings : Use  setting below  Time Frame :1M. Brokers : ALL  brokers, low spread/commission Minimum Deposit Recommended  : $500 USD Lot Size for 500$   :     0.01 Use a broker with good execution and with a  low spread  . A very fast VPS is required Parameters MMType :2 LotMultiplikator = 1.0 LotConst_or_not = TRUE Take profit : 5---20 pips  for accounts with five-digit Take profit is 50---200 pips Step : 40 pips        for accounts with f
MaxProfitDZ Expert adviser MaxProfitDz v1.4     Recommendations Symbol: ALL PAIRS ..i Recommended    EURUSD. Time Frame:1M. Brokers: ALL brokers .  low spread/commission, 1:500 leverage Minimum Deposit Recommended :   $500 USD  Lot Size for 500$   : 0.01  Use a broker with good execution and with a spread of 0.1-2 points. A very fast VPS is required Parameters EA TrendON=true (Read the  note ) MMType = 2 LotMultiplikator = 1 LotConst_or_not = TRUE Take profit :5-10 pips  for accounts with five
CloseDelet_Orders CloseAtProfit is an EA that I use only to close orders after defined profit, or loss,  close all orders  ,  also delete pending orders.  I am using it in live trading.  The speed of closing depends on time when it trades, on broker you are using and symbols you are trading. INPUTS: win_USD_All   =    close all orders (sell+buy)  when the profit is greater than defined profit to close; win_USD_BUY =    close only orders buy   when the profit is greater than defined profit to cl
GridProfit
Hafis Mohamed Yacine
Grid Profit  Grid Profit EA Working with all pairs. TimeFrame - 5-15-30-1H Minimum Deposit Recommended : $1000 USD lot 0.01  Grid Profit EA  V 1.00  would probably come about in the event the volatility to your commodity begins to diminish. In the case some sort of examine benefits are generally in the beginning to travel sideways, that ATR profit would probably figure out how to drop off of. This can trigger that trailing terminate to travel in excess since examine benefits began to be way
A trending market is one in which price is generally moving in one direction. ... When trading a trend-based strategy, traders usually pick the major currencies as well as any other currency utilizing the dollar because these pairs tend to trend and be more liquid than other pairs.  Best Trend Indicator That Tells You the Direction of the Trend   Trend MagicX_v1.1 displays the trend direction, duration, intensity and the resulting trend rating for all time frames in real time. You'll see at a
MA Cross Signal Alerts_v1.0 The Moving Average Cross displays a fast and a slow moving average (MA). A signal arrow is shown when the two MAs cross. An up arrow is displayed if the fast MA crosses above the slow MA and a down arrow is given if the fast MA crosses below the slow MA. The user may change the inputs (close), methods (EMA) and period lengths.  When two Moving Averages cross the indicator will alert once per cross between crosses and mark the cross point with down or up arrow. Ale
Modify SELL orders v1.0    Managing Orders   During trading, you may need to modify   orders, i.e.   to change stop levels or  take profit. This can be done with one click with  the script Modify SELL orders v1.0 The script modifies all orders (market )  with specified Take Profit and Stop Loss.(pip or price) If the take profit or(and) stop loss is incorrect, then the value is not changed. Parameters script : Take Profit (PIP) Stop Loss (PIP) Take Profit (price) Stop Loss (price)
Modify BUY orders_v1.0 Managing Orders   During trading, you may need to modify   orders, i.e.   to change stop levels or  take profit. This can be done with one click with  THE SCRIPT Modify BUY orders v1.0 The script modifies all orders (market )  with specified Take Profit and Stop Loss.(pip or price) If the take profit or(and) stop loss is incorrect, then the value is not changed. Parameters SCRIPT; Take Profit (PIP) Stop Loss (PIP) Take Profit (price) Stop Loss (price)
Bollinger Bands are a very common indicator in the world of online trading, this indicator gives very useful information for many forex trading strategies, but also for all other styles of strategies such as scalping and even trading medium and long term. It is calculated from a moving average calculated over n periods (20 by default). From this moving average, a standard deviation calculation is defined. By adding this standard deviation in real time to the basic moving average, we obtain the u
CandleEA1
Hafis Mohamed Yacine
Expert adviser candle_EA1_DZ1 The pending order strategy has gained high popularity among Forex traders. This situation was caused by the high efficiency of such a work tactic, which allows to reduce the psychological pressure on the market participant and to open profitable positions in the situation of the sharp price changing.   EA Settings: Use default settings  Symbol :  Recommended   EURUSD. Time Frame:   15-30 -    Recommended  1h Deposit Recommended : $1000 USD for lout 0.10 Use a brok
Triploea
Hafis Mohamed Yacine
TRIPLO EA Working with all pairs. TimeFrame - 5-15-30-1H Minimum Deposit Recommended : $1000 USD lot 0.01  TRIPLO EA  V 1.00  would probably come about in the event the volatility to your commodity begins to diminish. In the case some sort of examine benefits are generally in the beginning to travel sideways, that ATR profit would probably figure out how to drop off of. This can trigger that trailing terminate to travel in excess since examine benefits began to be way less hazardous. would pro
Green Zone
Hafis Mohamed Yacine
Zone Recovery Hedging Strategy What to do when the market goes against you? No matter how good you are at taking the entry points, no matter how good you are at predicting the market, it is a matter of time before the market goes against your trade. What do you do when the market goes against you? Do you just take the loss and try to recover the loss later from other trades? Or, do you just sit there and watch in dismay as this one bad trade eats up your hard earned profit and the money you inv
Many traders, especially the beginners, get tired of manual trading and start using robots. Of course, advertising plays a significant role in choosing the algorithm. Often, system and EA vendors hide information about their product until the customer buys it. Profit Hunter EA is no exception, so in our review we will try to find out whether this robot is efficient or you should better search for its counterparts. Profit Hunter EA  A variation of the "martingale" technique used in the EA is a
Market Volatility Why Use Volatility Indicators For Options? Binary options traders can profit from volatility indicators more than traders of conventional assets. There are two main reasons for this statement: Some Trades Win On Volatility Alone Traders of conventional assets are unable to win a trade on volatility alone. Stock traders, for example, can use volatility indicators as one factor in the decision-making process, but volatility indicators say little about whether an asset’s price wi
Market XVolatility  /   is an indicator that analyzes and visualizes momentum and price strength. The MXV is a confirmation indicator that analyzes buying and selling pressure by looking at price movements and whether volume is falling or rising. Therefore, the MXV is used by trend-following traders who want to know if a trend is strong enough to enter and by counter-trend traders who look to fade trends. RED  color in up  A red color means that there is indecision in the market and that price
Opposite market “Always go with the trend. Education is imparting of information to the mind and the shaping of the mind and of the personality” – Richard Weaver When many of us started trading Forex several years ago there was very little information about Forex trading systems available on the Internet. But thanks to the internet, we can now download this strategies that are inculcated within this different systems  Opposite market V.1.0, will surely give you what you desire for you investme
MatrixEA
Hafis Mohamed Yacine
///  Trade smart Good profit And continuous with low risk /// Matrix EA Working with all pairs.   TimeFrame - 1m Deposit Recommended :  If you have an account under $ 100-200, it is best to work with a         Micro account lot=0.1   MICRO  If you have an account under $ 500, it is best to work with a               Micro account lot=0.2  MICRO If you have an account  standard  with 1000  $ , it is best to work with a          lot=0.01    ///  Trade smart Good profit And continuous with
AutoPivot
Hafis Mohamed Yacine
This indicator will draw monthly, weekly, and daily pivot. Pivot line will be calculated automatically again when the period ends. Auto Pivot Metatrader 4 Indicator The Auto Pivot indicator for Metatrader 4 automatically updates the pivot point (PP), support (S1,S2,S3) and resistance levels (r1,r2,r3) every day. Price above the pivot point means positive while price below the pivot point means negative. S3 indicates extremely oversold while price above resistance r3 means extremely overbought.
While most traders use various technical indicators, the price action is basically determined by the buying and selling activity. This is how support and resistance levels, which are commonly used terms in technical analysis is formed. Traders know that when price reaches a support level, price can bounce off this support. This is also known as a level where this is high demand. A high demand area forms when there are more buyers than sellers. In trading, investors tend to buy at the support
The "Preface" Input-      Broker time is required by the code that features PivotsTz and vLines.  When data feed      is live the broker time is available.  When data feed is not live it is not available.      The purpose of this "Preface" section is to find and input the Clock location that has      the same time as the broker server.  Then, even without live data feed we will still      have the equivalent of the broker server time to work with, generated by the Clock, and      the PivotsTz
CurrencySt Alerts  Metatrader 4 Forex Indicator The CurrencySt Alerts  MT4 forex indicator displays the trend strength for the 8 major currencies: NZD, EUR, GBP, USD, JPY, AUD, CAD and CHF. It ranks the 8 currencies from very strong to very weak in a table directly visible on the MT4 activity chart. How to trade with the Currency Strength indicator? As a general rule, always trade the strongest currency versus the weakest currency. For example, as shown in the NZD/USD chart below, the NZD
Levels ATR
Hafis Mohamed Yacine
The ATR Levels Indicator For MT4 is an indicator that is built specifically for traders who use the Meta Trader 4 for their trading analysis, charting of different currency pairs and trading assets, doing their technical analysis and making trading decisions all through the trading day as they work. One of the first major advantages of using the ATR Levels Indicator For MT4 is that it automatically helps the trader to spot very important levels in the markets based on the Average True Range Ind
DYNAMIC CHANNEL Forex is a Metatrader 4 (MT4 (MT4)) indicator and the essence of this technical indicator is to transform the accumulated historical data. Forex DYNAMIC CHANNEL Indicator provides for an opportunity to detect various peculiarities and trends in price dynamics which are invisible to the naked eye. Based on this information, traders can assume further price movements and adjust their strategy accordingly. Dynamic channel, which is calculated based on the maximum distance between
What Is Currency StrengtT Indicator? A currency strengthT indicator is a graphical tool that shows the strength of a currency. Common indicators usually show the strength of a currency in relation to another currency, however, with some calculations it is possible to find the absolute strength of each individual currency. Therefore, a currency strength matrix indicator (or meter) is a tool that tries to express the absolute strength of a currency, so that you can compare this strength with the
Action Alert    indicator  generates and writes data on the chart when performing any modification to the dead process. Expertise Properties: An audible alert is issued in the name of the operation and the labor that has been made You only need one chart Writes the processed operations in clear handwriting The font color can be controlled on the chart Setting  Action Alert    indicator  What is meant by it is to alert me any change in my deals of , it will reverse if any new deal comes out, al
MA Cross Signal Alerts MA Cross Signal Alerts_v2.0 The Moving Average Cross displays a fast and a slow moving average (MA). A signal arrow is shown when the two MAs cross. An up arrow is displayed if the fast MA crosses above the slow MA and a down arrow is given if the fast MA crosses below the slow MA. The user may change the inputs (close), methods (EMA) and period lengths.  When two Moving Averages cross the indicator will alert once per cross between crosses and mark the cross point with
Multip RSA
Hafis Mohamed Yacine
The EA  use a strategy of the Relative Strength Index (RSI)  RSI Expert Advisor automatically analyzes RSI-values. Each time the RSI comes from the overbought zone crossing the given upper level the robot will open sell-orders automatically. The lot-size will be increased exponentially with the editable multiplier. If the RSI enters the oversold zone all open sell-orders will be closed. This strategy is used in long- and short direction. Basic EA settings are already configured for EURUSD (1h)
About the Stochastic Oscillator The Stochastic Oscillator Indicator was developed in the late 1950s by Dr. George Lane . The term stochastic refers to the point of a current price in relation to its price range over a period of time. The stochastic oscillator show 2 lines (Main and Signal line) and s support and resistance level. He is included in Metatrader. The default settings are: K% 5, D% 3 Slowing 3 Trade logic of this forex robot The Stochastic Oscillator EA is a forex robot based on the
Hedgeuptodown
Hafis Mohamed Yacine
What Is Hedging as It Relates to Forex Trading? Hedging with forex is a strategy used to protect one's position in a currency pair from an adverse move. It is typically a form of short-term protection when a trader is concerned about news or an event triggering volatility in currency markets. There are two related strategies when talking about Hedge forex pairs in this way. One is to place a hedge by taking the opposite position in the same currency pair, and the second approach is to buy forex
Profit is just like a capricious lady, that comes and goes, however today, the PROFIT can be BOUGHT! Having installed Forex Pips Hunter just once, you assure yourself of a long-awaited source of income. WHY? Because of some reasons listed below. Forex Pips Hunter...is...   The product that conquered the hearts of some of the world’s best beta-testers.   The product that redefined the definition of Real Success.   Fully automated system that combines some of the best qualities of the modern day s
フィルタ:
レビューなし
レビューに返信