SignalArrow
- インディケータ
- バージョン: 2.4
- アクティベーション: 5
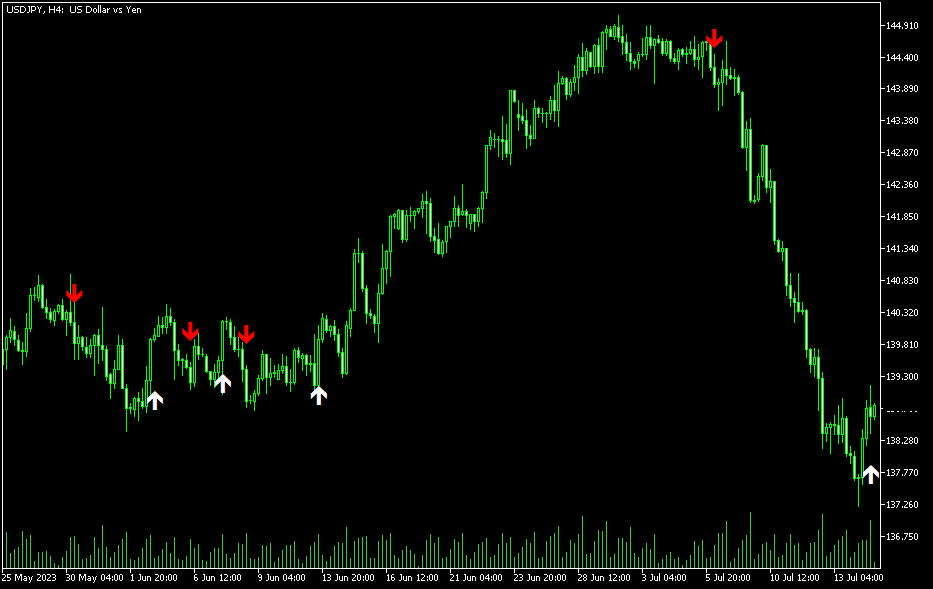
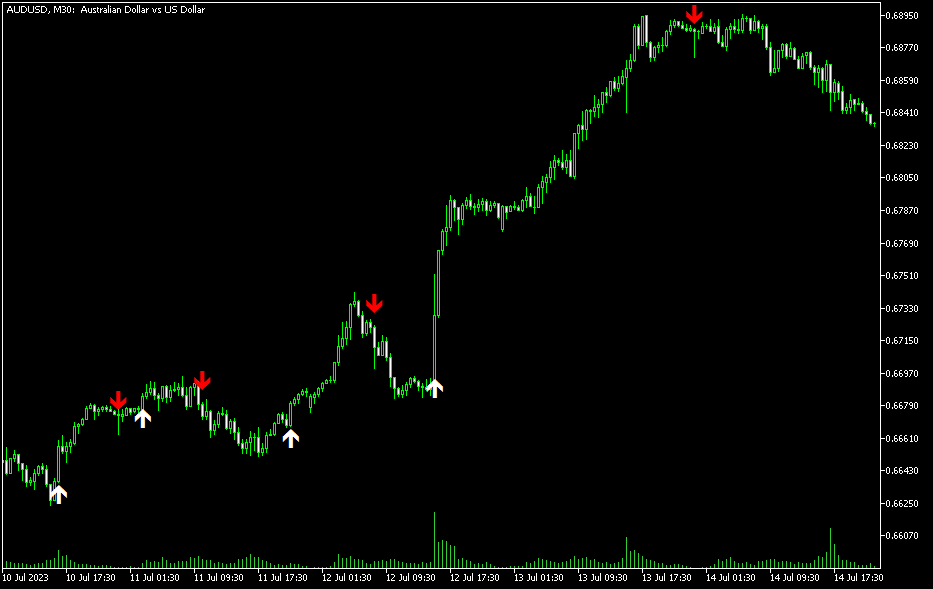
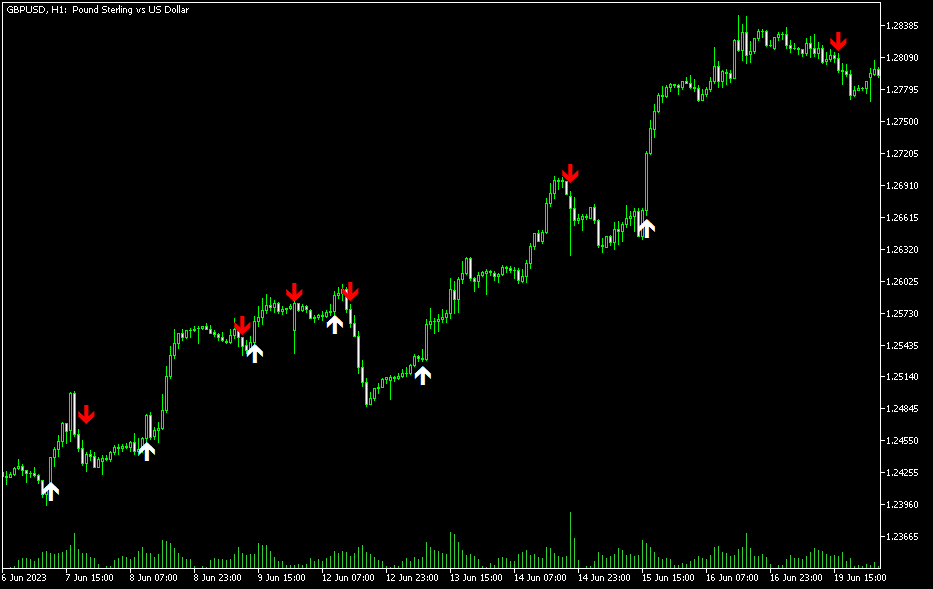
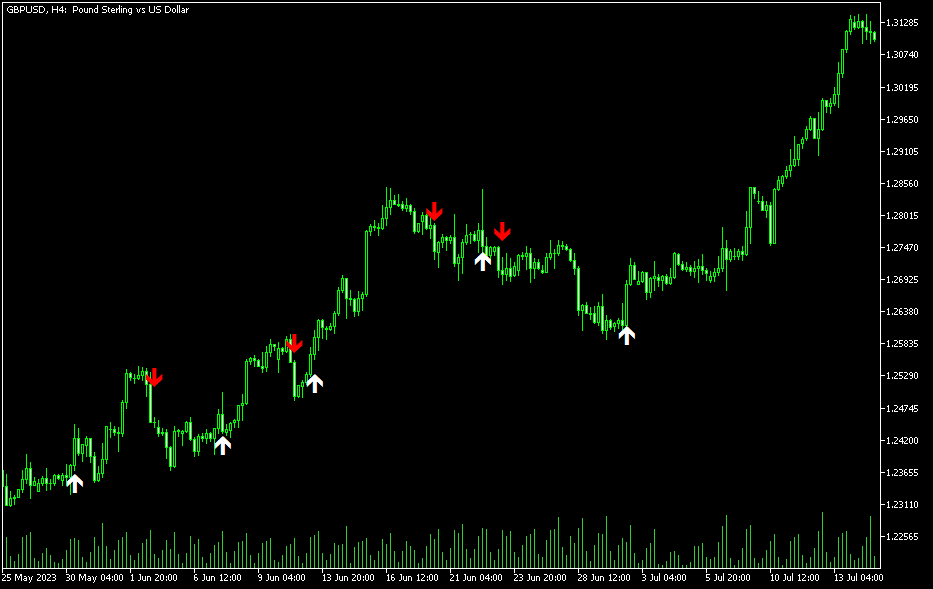
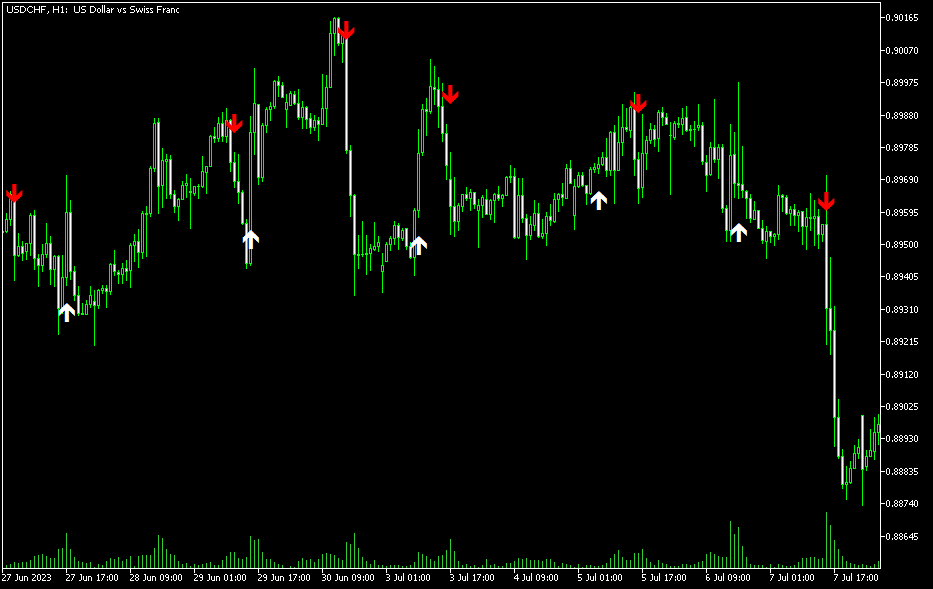
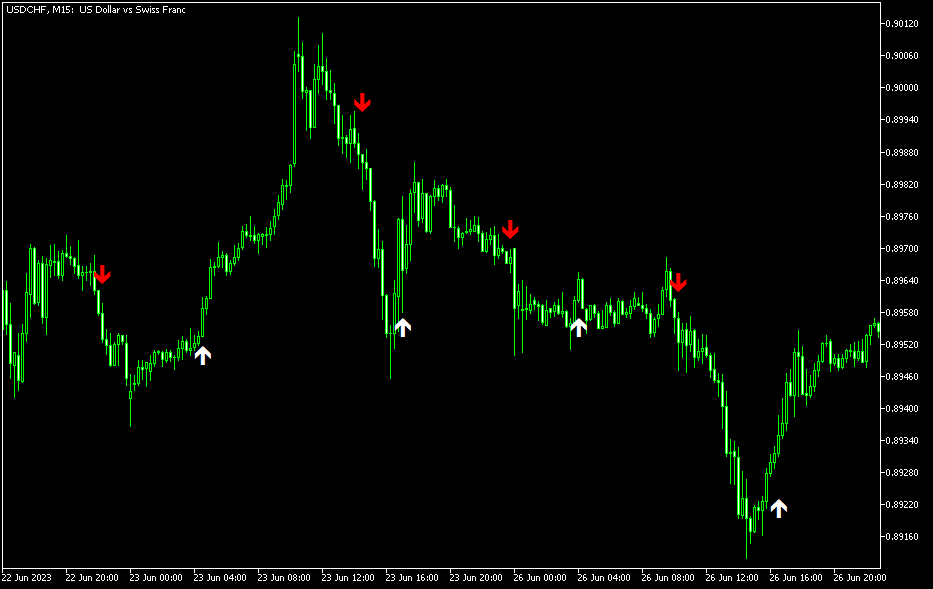
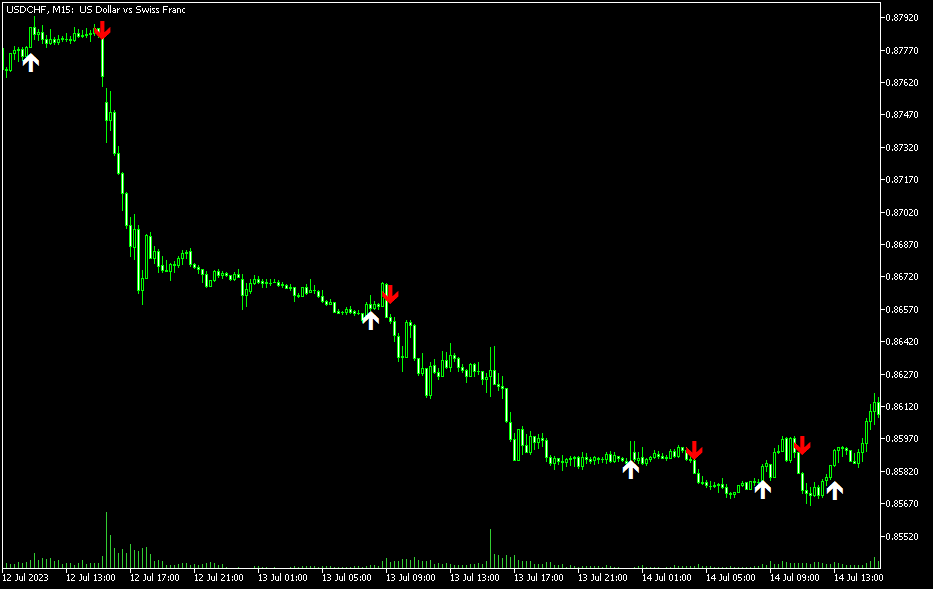
The main objective of this indicator is to determine entry and exit points, that is why ExactArrow draws nothing but arrows showing entry and exit points.
In spite of apparent simplicity of the indicator, it has complicated analytic algorithms which determine entry and exit points.
The indicator generates exact and timely entry and exit signals which appear on the current candle. The indicator generates an average of 1-2 candles before its analogues do.
The indicator is very easy to use. Open Buy trade when you see an up arrow. Open Sell trade when you see a down arrow.
Indicator input parameters:
- SoundAlert - enable/disable signals
- period - indicator period
- EmailAlert - send an email when a new signal appears
- MobileAlert - send a notification to the mobile terminal when a new signal appears
The indicator does not repaint its values. Arrows always stay where they have appeared.