AnalyticTrade

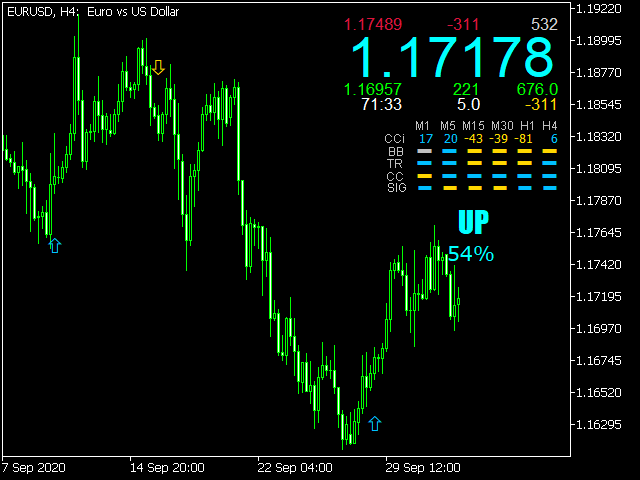
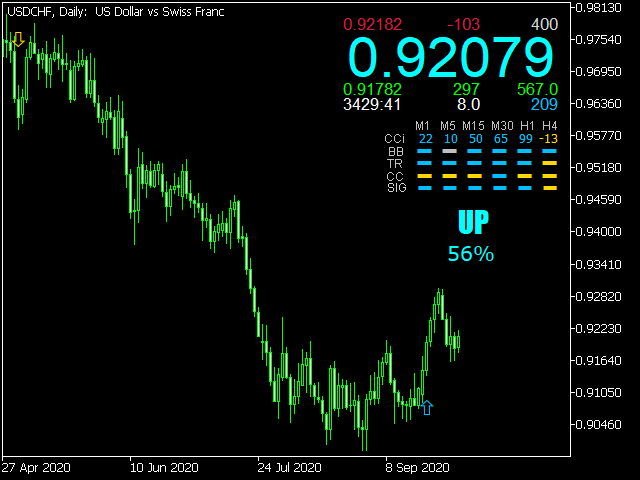
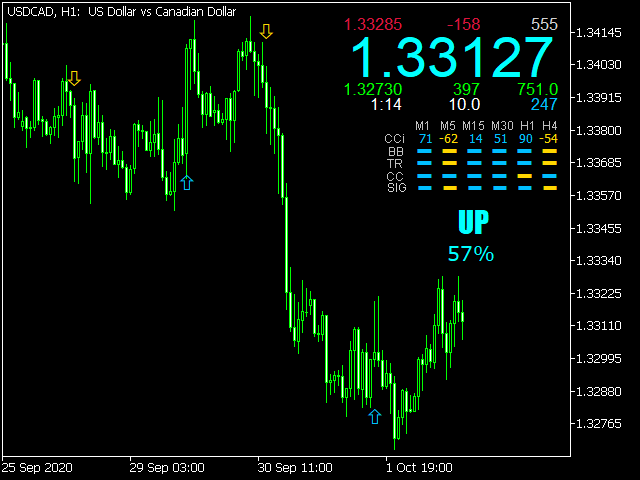
Индикатор Analytic Trade - это полноценная торговая система. Он состоит из 4 частей:

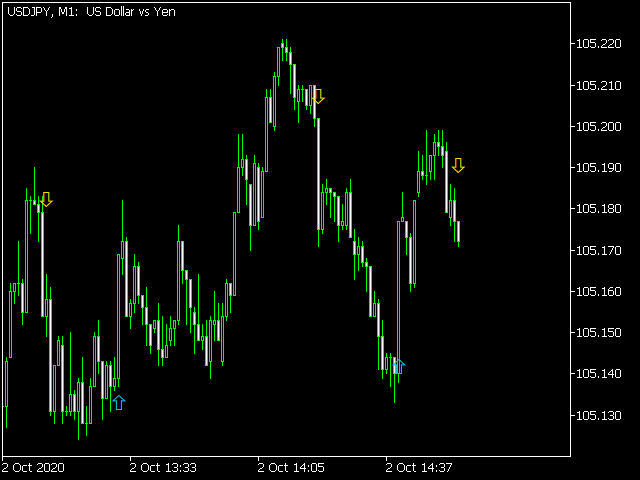
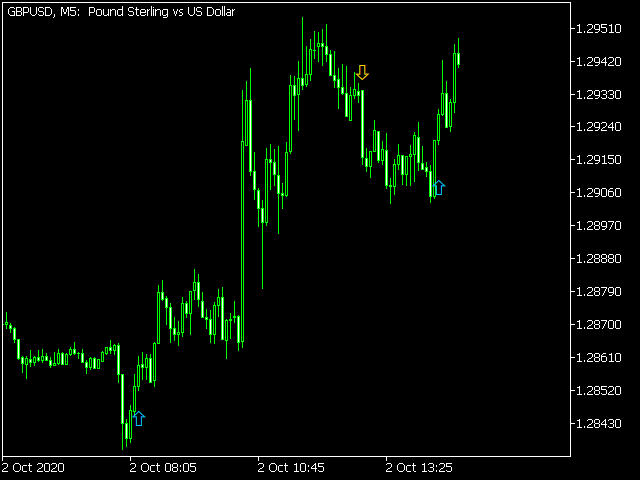
Первая - это стрелочки, показывающие наиболее оптимальные точки открытия и закрытия ордеров. Стрелка вверх - сигнал на покупку, вниз - на продажу.

Вторая - это информационная панель в правом верхнем углу. Крупным шрифтом обозначена текущая цена, над ней показаны: максимум дня, расстояние от текущей цены до него и разность максимума и минимума (в пунктах). Под ней расположены: минимум дня, расстояние до минимума, средний дневной размах цены, время до следующей свечи, спред и расстояние до цены открытия дня.

Третья часть - это показания индикаторов CCI и Bollinger Bands, а также направление тренда (TR), текущей свечи (CC) и показания индикатора (SIG) на шести периодах данной валютной пары (M1, M5, M15, M30, H1, H4). Голубой цвет соответствует восходящему тренду, желтый - нисходящему.

Четвёртая показывает направление тенденции и её силу.

Индикатор свои значения не перерисовывает.

Есть аналог для мт4


Параметры

  • Period - период индикатора
  • EnableAlerts - использовать ли звуковой сигнал при появлении сигнала
  • Show_Panel - показывать ли информацию
  • MobileAlert - отправлять ли сообщение на мобильный терминал при появлении сигнала
  • EmailAlert - отправлять ли сообщение на электронную почту при появлении сигнала


おすすめのプロダクト
Divergent Stochastic Filter II Catch Reversals Early, Filter Noise, Trade with Confidence The Edge: Why This Stochastic is Different  Every trader knows the Stochastic oscillator. But knowing when to trust its signals, that's the real challenge. The Divergent Stochastic Filter II transforms this classic indicator into a precision reversal detection system by adding critical elements: divergence intelligence, signal filtering and exhaustion detection.  While standard Stochastic oscillators fire s
フラットとトレンドを決定するための指標。 価格が2つのヒストグラムと2つの線(赤と青)のいずれかを下回っている場合、これは売りゾーンです。 このバージョンのインジケーターを購入するときは、1つの実際のアカウントと1つのデモアカウント用のMT4バージョン-ギフトとして(受け取るには、プライベートメッセージを書いてください)! 価格が2つのヒストグラムと2つの線(赤と青)のいずれかを上回っている場合、これは購入ゾーンです。 MT4バージョン: https//www.mql5.com/en/market/product/3793 価格が2つの線の間、またはいずれかのヒストグラムのゾーンにある場合、市場に明確な傾向はありません。簡単に言えば、市場は横ばいです。 インジケーターの動作は、スクリーンショットでより明確に示されています。
STRICTLY FOR BOOM INDEX ONLY!!!!! Here I bring the Maximum Trend Arrows OT1.0 MT5 indicator. This indicator is made up of a combination of different trend indicators for entries and exits, for entries an orange arrow will paint on the chart below the current market and a red flag for closing of trades and it produces buy arrows only. When the orange arrow appears, it will appear along with it's sound to notify you. The 1H timeframe is recommended, don't use it anywhere else than on the 1H timefr
RBreaker Gold Indicatorsは、金先物の短期日内取引戦略であり、トレンドフォローと日内反転の2つの取引手法を組み合わせたものです。トレンド相場での利益を捉えるだけでなく、相場が反転した際には迅速に利確し、その流れに沿ってポジションを反転させることができます。 この戦略は、アメリカの雑誌『Futures Truth』において、15年連続で最も収益性の高い取引戦略トップ10に選ばれた実績を持ち、非常に長いライフサイクルを誇り、現在も国内外で広く使用・研究されています。 本インディケーターは、2026年の金先物の値動きに対応し、14日間のATR指標に基づいて、ブレイクアウト係数A、観察係数B、リバーサル係数Rをより合理的な値で定義しています。非常に優れたインディケーターであり、安定的な年間収益を実現しています。ぜひおすすめします〜
The Trend Detect indicator combines the features of both trend indicators and oscillators. This indicator is a convenient tool for detecting short-term market cycles and identifying overbought and oversold levels. A long position can be opened when the indicator starts leaving the oversold area and breaks the zero level from below. A short position can be opened when the indicator starts leaving the overbought area and breaks the zero level from above. An opposite signal of the indicator can b
Take the stress out of trading with the Buy Sell Chill Indicator —your ultimate companion for effortless trend identification. This easy-to-use tool gives you a clear visual arrow to show the direction the market is about to take, making trading decisions as simple and "chill" as possible. Why Choose the Buy Sell Chill Indicator? Relaxed and Intuitive : Designed to make trading less stressful and more enjoyable by giving you straightforward signals with no clutter. Customizable Features : ATR Pe
Trend Meter – Your Tool for Identifying Strong and Reliable Trends Trend Meter is an advanced and highly customizable indicator designed to help traders identify the direction and strength of the current trend with greater accuracy, significantly reducing noise and the reliance on single signals. It's the ideal solution for those seeking reliable signals and wanting to trade with more confidence. Key Features: Three Independent Trend Meters : Choose from various trend logic options, such as MACD
# DRAWDOWN INDICATOR V4.0 - The Essential Tool to Master Your Trading ## Transform Your Trading with a Complete Real-Time Performance Overview In the demanding world of Forex and CFD trading, **knowing your real-time performance** isn't a luxury—it's an **absolute necessity**. The **Drawdown Indicator V4.0** is much more than a simple indicator: it's your **professional dashboard** that gives you a clear, precise, and instant view of your trading account status. --- ## Why This Indicator
The  SuperTrend Advance Trading  is a widely-used technical indicator based on  SuperTrend Strategy + Price Action + EMA . How it works: -  Buy/Sell Signals  can be generated when the trend reverses, the conditions of Price action, TrendLine and EMA are met. - After the  Signal  appears, be patient and wait until the candle closes, at that time place the order as soon as possible. You may have time to review your entry, consider whether it is a good entry or not. - Carefully review the entry, up
Trade history
Andriy Konovalov
5 (2)
The indicator plots charts of profit taken at the Close of candles for closed (or partially closed) long and short positions individually. The indicator allows to filter deals by the current symbol, specified expert ID (magic number) and the presence (absence) of a substring in a deal comment, to set the start time and the periodicity of profit reset (daily, weekly or monthly) to calculate the profit chart. The indicator also displays the floating (not fixed) profit of the opened positions at th
Gold Emperor Scalper
Mohamed Jamal Mohamed Mohamed Abu Wadi
Gold Emperor Scalper   is a MetaTrader 5 indicator designed to give traders precise   buy/sell signals   for XAUUSD and other symbols, powered by   ATR Trailing Stop logic   . Built for both scalpers and swing traders, it combines   real-time market direction   to help you identify   high-probability gold entries   with confidence. Key Features & Advantages ATR-Based Trailing Stop System   – Adaptive stop levels that adjust with volatility to protect profits and reduce risk. Clear Buy/Sell Marke
Price Magnet — Price Density and Attraction Levels Indicator Price Magnet is a professional analytical tool designed to identify key support and resistance levels based on statistical Price Density. The indicator analyzes a specified historical period and detects price levels where the market spent the most time. These zones act as “magnets,” attracting price action or forming a structural base for potential reversals. Unlike traditional Volume Profile tools, Price Magnet focuses on price-time d
トレンドトレーディング は、タイミングのプルバックとブレイクアウトにより、市場で起こっているトレンドから可能な限り利益を得るように設計された指標です。確立されたトレンドの中で価格が何をしているかを分析することにより、取引の機会を見つけます。 [ インストールガイド | 更新ガイド | トラブルシューティング | よくある質問 | すべての製品 ] 自信を持って効率的に金融市場を取引する むち打ちにならずに確立されたトレンドから利益を得る 収益性の高いプルバック、ブレイクアウト、早期の逆転を認識する この指標は、独自の品質とパフォーマンスを分析します 複数時間枠のダッシュボードを実装します インジケーターは再描画されていません 電子メール/音声/視覚アラートを実装します 確立されたトレンドは多くの取引機会を提供しますが、ほとんどのトレンド指標はそれらを完全に無視しています。インジケーターの解釈はかなり簡単です: (1) トレンドの変化 (2) トレンドの方向への後退 (3) トレンドの方向へのブレイクアウト 赤いダッシュ は下降トレンド中の修正です 青いダッシュ は上昇トレンド中
Price Manipulation Risk Indicator Advanced Tool for Market Risk Evaluation & Manipulation Detection Price Manipulation Risk Indicator is a professional tool designed to measure the current risk level in the market. It evaluates price behavior, market activity, and candle dynamics to detect unstable or potentially manipulated environments. This indicator helps traders avoid traps , filter false signals , and improve timing in both entries and exits. Product Purpose Provide an immediate a
回帰取引を意味する専門的かつ定量的なアプローチを実装する独自の指標。これは、価格が予測可能かつ測定可能な方法で迂回して平均に戻るという事実を利用しており、非定量的な取引戦略を大幅に上回る明確な出入りルールを可能にします。 [ Installation Guide | Update Guide | Troubleshooting | FAQ | All Products ] 明確な取引シグナル 驚くほど簡単に取引できます カスタマイズ可能な色とサイズ パフォーマンス統計を実装します ほとんどの取引戦略を上回ります 適切なSLおよびTPレベルを表示します 電子メール/音声/視覚アラートを実装します 使い方 インディケータは、より高い時間枠からの完全にカスタマイズ可能な移動平均の周りの標準偏差を測定し、トレンドフォローアプローチを使用して正確に取引を見つけます。取引は、現在のチャートの価格アクションに飛び込むことによって見つけられ、価格が選択したより高い時間枠から計算された平均価格帯に戻ったときに閉じられます。それがコード化される方法のために、指標は高ボラティリティと強いトレンドの市場か
Volume Profile for MetaTrader 5 Price movement alone does not explain where the market is actually traded . What matters is where volume is built and how these areas shift over time. This Volume Profile displays the volume distribution directly on the chart , making it clear which price levels were accepted by the market and where rejection occurred. This allows structurally relevant zones to be identified and integrated into individual decision-making processes. The tool is designed for high pe
Crypto_Forex MT5用インジケーター「ダイナミック売られ過ぎ/買われ過ぎゾーン付きCCI」(リペイント機能なし) - コモディティ・チャネル・インデックス(CCI)は、トレンド方向へのモメンタムトレードに最適です。 - ダイナミック買われ過ぎゾーンからの売りエントリー、およびダイナミック売られ過ぎゾーンからの買いエントリーを、主要トレンド方向へ行うのに最適です。 - このインジケーターは、プライスアクションエントリーと組み合わせるのも効果的です。 - ダイナミック買われ過ぎゾーン - 黄色線より上。 - ダイナミック売られ過ぎゾーン - 青線より下。 - CCIオシレーターは、現在価格と過去平均価格の差を測定します。 - PCおよびモバイルアラート機能付き。 高品質のトレーディングロボットとインジケーターをご覧になるにはここをクリックしてください! これは、このMQL5ウェブサイトでのみ提供されるオリジナル製品です。
This indicator can be considered as a trading system. It offers a different view to see the currency pair: full timeless indicator, can be used for manual trading or for automatized trading with some expert advisor. When the price reaches a threshold a new block is created according to the set mode. The indicator beside the Renko bars, shows also 3 moving averages. Features renko mode median renko custom median renko 3 moving averages wicks datetime indicator for each block custom notification
The Antique Trend Indicator is a revolutionary trend trading and filtering solution with all the important features of a trend tool built into one tool! The Antique Trend indicator is good for any trader, suitable for any trader both for Forex and binary options. There is no need to configure anything, everything has been perfected by time and experience, it works great during flats and trends. The Antique Trend indicator is a tool for technical analysis of financial markets, reflecting curren
Range Directional Force Indicator – Designed for You to Optimize! The Range Directional Force Indicator is a cutting-edge tool designed to empower traders by visualizing market dynamics and directional strength. Built to offer insights into market trends and reversals, this indicator is an invaluable asset for traders seeking precision in their strategies. However, it is important to note that this indicator is not optimized, leaving room for you to tailor it to your unique trading preferences.
プレミアムレベルは、正しい予測の精度が80%を超える独自の指標です。 この指標は、最高のトレーディングスペシャリストによって2か月以上テストされています。 あなたが他のどこにも見つけられない作者の指標! スクリーンショットから、このツールの正確さを自分で確認できます。 1は、1キャンドルの有効期限を持つバイナリーオプションの取引に最適です。 2はすべての通貨ペア、株式、商品、暗号通貨で機能します 手順: 赤い矢印が表示されたらすぐにダウントレードを開き、青い矢印が表示されたら閉じます。青い矢印の後に開くこともできます。 試してテストしてください!推奨設定はデフォルトです! 日足チャートで最高の精度を示します! インディケータは、2600 Pipsの収益性に対して、約10Pipsという非常に小さなマージンを使用します。
Price reach indicator. It also serves as the perfect term for supports and resistance. I use it in two experts. The basic tool for professional trading. The indicator analyzes the last 500 bar and uses this to determine the levels ( but it doesn't predict the future ) . Personally, I use it on TF H1.  It is very simple. Four lines on chart and that's all. Only two input parameters.  Thousands of indicators. Why this? Is good ? No! Is very good. Please test the indicator prior to purchasing. You
Introducing to your attention the unique trading system/indicator "Scaled Vidya Trends", designed for dynamic scalp trading on trend volatility pairs hour + timeframes. Main features of Scaled Vidya Trends: -Multi-level market analysis: it works on H1, H2, H3 timeframes; -Uses the most popular currency pairs: EURUSD, GBPUSD, USDCAD. Brokers usually set one of the lowest spreads for these pairs; -Applies a scalping method based on local targets for signals; -Signals appears at the new open of
このインジケーターは、市場価格が到達する可能性のある注目すべきローソク足を表示します。 それらを観察することで、市場が次にどの方向に動くかを予測できます。 アイデアは完全にオリジナルで、**スマートマネー(Smart Money)**の概念に近いものです。 使い方: アクティブなローソク足は色で強調表示されます。これらはマーケットメイカーにとって磁石のように機能し、まだ流動性を含んでいます。 現在の価格に対する位置に応じて、ローソク足は 赤 または 青 で表示され、視覚的にわかりやすくなります。 市場価格がアクティブなローソク足のレベルを通過すると、そのローソク足は徐々に色を失い、アクティブではなくなります。 市場が完全に通過したアクティブなローソク足はパッシブになり、通常のローソク足のように見えます。 パッシブなローソク足は価格を引き付けなくなります。 適用範囲: このインジケーターは主要通貨ペアやマイナー通貨ペア、金、その他の資産、あらゆる時間足で使用でき、市場分析や価格の動きを捉えるのに役立ちます。 スキャルパー、デイトレーダー、D1などの長期時間足で取引するトレーダーに便利です
Binary Options Assistant (BOA) Multi Currency Dashboard for Binary Options (MT5) . You can use any of the BOA Signals Indicators with the dashboard. Just change the BOA Signals Indicator Name in the dashboard settings to the indicator you want to get signals from. For example: CHILL. BLAZE:  BOA_BLAZE_Indicator_v1   Strategy :   BLW Online Trading Binary Options Strategy (3 Moving Average) LAVA:  BOA_LAVA_Indicator_v1   Strategy:   Lady Trader Binary Options Strategy (Bollinger Bands & Stochas
Alpha Trend MT5 is a trend indicator for the MetaTrader 5 platform; it has been developed by a group of professional traders. The Alpha Trend MT5 indicator finds the most probable tendency reversal points, which allows making trades at the very beginning of a trend. This indicator features notifications, which are generated whenever a new signal appears (alert, email, push-notification). This allows you to open a position in a timely manner. Alpha Trend does not redraw, which makes it possible t
This indicator is used to compare the relative strength of the trade on the chart against the other several selected symbols. By comparing the price movement of each traded variety based on the same base day, several trend lines of different directions can be seen, reflecting the strong and weak relationship between the several different traded varieties, so that we can have a clearer understanding of the market trend. For example, you can apply this indicator on a EurUSD chart and compare it w
BlueBoat – Prime Cycle is a technical indicator for MetaTrader 5 that visualizes market cycles based on the Fimathe cycle model (Marcelo Ferreira) . It identifies and displays historic and live cycle structures such as CA, C1, C2, C3, etc., helping traders understand the rhythm and timing of price movement across multiple sessions. This tool is ideal for manual analysis or as a supporting signal in discretionary strategies. Key Features Historical Cycle Analysis – Backtest and visualize as many
TRI Visualizer Enhanced - 熱力学的市場分析の革命 概要 TRI(Thermal Range Indicator)Visualizer Enhanced は、従来のテクニカル分析を超越した、物理学の熱力学理論を応用した革新的なマーケット分析インジケーターです。市場の価格変動を「熱力学的エネルギー」として捉え、これまで見落とされていた市場の微細な変化を高精度で検出します。 革新的な仕組み 1. デュアル計算エンジン クラシックTRIモード 基本公式: |終値-始値| + (高値-安値) ローソク足の実体とヒゲを統合した純粋なボラティリティ測定 シンプルで直感的、あらゆる市場環境で安定動作 熱力学的TRIモード(独自開発) 価格加速度 :2次微分による価格変化の勢いを測定 出来高変化率 :相対的な出来高の変化を動的に評価 ポジションエネルギー :正規化された価格変動エネルギーを計算 熱力学的係数 :物理学の熱力学法則を市場分析に応用 2. 高度な平滑化システム SMA(単純移動平均) :基本的なノイズ除去 EMA(指数移動平均) :最新データ重視の平滑化
このプロダクトを購入した人は以下も購入しています
Entry In The Zone and SMC Multi Timeframe is a real-time 2-in-1 market analysis tool that combines market structure analysis and a No Repaint BUY / SELL signal system into a single indicator, built on Smart Money Concepts (SMC) — a widely adopted framework used by professional traders to understand market structure. This indicator helps you see the market more clearly, make decisions based on structure rather than guesswork, and focus on high-probability zones where price is more likely to react
Azimuth Pro
Ottaviano De Cicco
5 (6)
Azimuth Pro V2:MT5向けシンセティック・フラクタル構造分析と確認済みエントリー 概要 Azimuth Pro は Merkava Labs によるマルチレベルスイング構造インジケーターです。4つのネストされたスイングレイヤー、スイングアンカーVWAP、ABCパターン検出、3タイムフレーム構造フィルタリング、そして確定バーでの確認済みエントリー — 1つのチャートで、ミクロスイングからマクロサイクルまでを網羅するワークフロー。 これはブラインドシグナル製品ではありません。ロケーション、コンテキスト、タイミングを重視するトレーダーのための構造ファーストワークフローです。 V2発売記念オファー — Azimuth Pro V2をUSD 399で(次の100本)。最終価格:USD 499。 1. V2での変更点 シンセティック・マルチタイムフレームエンジン 上位タイムフレーム分析をMeridian Proと同じ独自のシンセティックアーキテクチャで一から再構築。よりクリーンなHTFコンテキスト、安定したライブ動作、従来のMTF同期問題なし。シンセティックエンジンは 固定比率タ
このインジケーターを購入された方には、以下の特典を 無料 で提供しています: 各トレードを自動で管理し、ストップロスとテイクプロフィットを設定し、戦略ルールに基づいてポジションを決済する補助ツール 「Bomber Utility」 様々な銘柄に合わせたインジケーターの設定ファイル(セットファイル) 「最小リスク」、「バランスリスク」、「待機戦略」 の3つのモードで使用できる Bomber Utility 用の設定ファイル このトレーディング戦略をすぐに導入・設定・開始できる ステップバイステップのビデオマニュアル ご注意: 上記の特典を受け取るには、MQL5のプライベートメッセージシステムを通じて販売者にご連絡ください。 オリジナルのカスタムインジケーター 「Divergence Bomber(ダイバージェンス・ボンバー)」 をご紹介します。これは、MACDのダイバージェンス(乖離)戦略に基づいた 「オールインワン」型のトレーディングシステム です。 このテクニカルインジケーターの主な目的は、価格とMACDインジケーターの間に発生するダイバージェンスを検出 し、将来の価格の動きを示す
OmniSync Projection
Antonio-alin Teculescu
5 (1)
Chronos Fractal Engine is an innovative price projection indicator for MetaTrader 5, designed to transform your technical analysis by intelligently identifying and projecting historical price patterns. Built upon an advanced correlation algorithm and the fractal principles of the market, this powerful tool visualizes potential future price movements, giving you a unique edge in your trading decisions. What is Chronos Fractal Engine? At its core, the Chronos Fractal Engine employs a sophisticat
このインジケーターを購入すると、プロ仕様のトレードマネージャーを無料で差し上げます。 まず第一に、このトレーディングシステムがノンリペイント、ノンリドロー、ノンラグのインジケーターであることを強調する価値がある。これにより、手動取引とロボット取引の両方に理想的なものになっています。 オンラインコース、マニュアル、プリセットのダウンロード。 「スマートトレンドトレーディングシステム MT5」は、新規および経験豊富なトレーダー向けにカスタマイズされた包括的なトレーディングソリューションです。10以上のプレミアムインジケーターを組み合わせ、7つ以上の堅実なトレーディング戦略を備えており、多様な市場状況に対応する多目的な選択肢となっています。 トレンドフォロー戦略:トレンドを効果的に乗り越えるための正確なエントリーとストップロス管理を提供します。 リバーサル戦略:潜在的なトレンドの反転を特定し、トレーダーがレンジ相場を活用できるようにします。 スキャルピング戦略:高速で正確なデイトレードおよび短期取引のために設計されています。 安定性:すべてのインジケーターはノンリペイント、ノンリドロー、ノ
Meridian Pro
Ottaviano De Cicco
5 (1)
Meridian Pro:MT5用プロフェッショナル・マルチタイムフレーム・トレンドマトリックス 概要 Meridian Pro は Merkava Labs が開発したマルチタイムフレーム・トレンドマトリックスで、方向性の状態、強度、モメンタムの状況、マトリックスの合意をひとつのコンパクトなパネルに集約します。ひとつのアダプティブエンジンがM1からW1まで一貫して適用されます。シンボルごとの調整は不要。インジケーターの積み重ねも不要。すべてのアセットとすべてのタイムフレームをカバーするひとつの構造化された読み取りです。 発売キャンペーン — Meridian Proを USD 99 (導入価格)で入手。通常価格:USD 149 。 1. Meridian Proが他と異なる理由 ひとつのエンジン、バラバラなインジケーターのダッシュボードではない 多くのMTFダッシュボードは、タイムフレームごとに生のインジケーター値を繰り返すだけです。Meridian Proはマトリックス全体でひとつのアダプティブ・トレンドエンジンを使用するため、パネルの各行が同じ構造化フレームワークから導出されます
Quantum TrendPulse を ご紹介します。これは、   SuperTrend   、   RSI   、および Stochastic のパワーを 1 つの包括的なインジケーターに組み合わせて、取引の可能性を最大限に引き出す究極の取引ツールです。精度と効率を求めるトレーダー向けに設計されたこのインジケーターは、市場のトレンド、勢いの変化、最適なエントリー ポイントとエグジット ポイントを自信を持って特定するのに役立ちます。 主な特徴: SuperTrend 統合: 現在の市場動向に簡単に追従し、収益性の波に乗ることができます。 RSI精度: 買われすぎと売られすぎのレベルを検出し、市場の反転のタイミングに最適で、SuperTrendのフィルターとして使用されます。 確率的精度: 確率的振動を活用して、変動の激しい市場で隠れたチャンスを見つけます。SuperTrend のフィルターとして使用されます。 マルチタイムフレーム分析:   M5 から H1 または H4 まで、さまざまなタイムフレームで市場を常に把握します。 カスタマイズ可能なアラート: カスタム取引条件が満たされ
FX Trend NG:次世代マルチマーケット・トレンドインテリジェンス 概要 FX Trend NG は、複数の時間足に対応したプロフェッショナル向けトレンド分析およびマーケット監視ツールです。 市場全体の構造を数秒で把握することができます。 複数のチャートを切り替える必要はありません。どの銘柄がトレンド中なのか、どこでモメンタムが弱まっているのか、そしてどの時間足で強い整合性があるのかを瞬時に確認できます。 ローンチ特別オファー – FX Trend NG を $30(6ヶ月) または $80 永久ライセンス でご利用いただけます。 すでに Stein Investments のユーザーですか? -> メッセージを送信 して、プライベートグループへアクセスしてください。 セットアップや詳細情報が必要ですか? -> Stein Investments 公式ページ をご覧ください。 1. FX Trend NG が他と異なる理由 3ステート・トレンドロジック ― Buy と Sell だけではない • 多くのインジケーターは Buy または Sell の2状態のみを表示します。
BTMM State Engine Pro is a MetaTrader 5 indicator for traders who use the Beat The Market Maker approach: Asian session context, kill zone timing, level progression, peak formation detection, and a multi-pair scanner from a single chart. It combines cycle state logic with a built-in scanner dashboard so you do not need the same tool on many charts at once. What it does Draws the Asian session range; session times can follow broker server offset or be set in inputs. Tracks level progression (L
ARICoin is a powerful trading companion designed to generate high-probability entry signals with dynamic TP/SL/DP levels based on volatility. Built-in performance tracking shows win/loss stats, PP1/PP2 hits, and success rates all updated live. Key Features: Buy/Sell signals with adaptive volatility bands Real-time TP/SL/DP levels based on ATR Built-in MA Filter with optional ATR/StdDev volatility Performance stats panel (Success, Profit/Loss, PP1/PP2) Alerts via popup, sound, push, or email Cust
Trend Ai indicatorは、トレンドの識別と実用的なエントリポイントと反転アラートを組み合わせることで、トレーダーの市場分析を強化する優れたツールです。 この指標は、ユーザーが自信と正確さで外国為替市場の複雑さをナビゲートすることを可能にします トレンドAiインジケーターは、主要なシグナル以外にも、プルバックやリトレースメント中に発生するセカンダリエントリポイントを識別し、トレーダーが確立されたトレンド内の価格修正を活用できるようにします。 重要な利点: *MT4およびMT5の仕事 *明確な買いまたは売りシグナル *再描画しません ·すべての資産で動作します 私はeaやセットをtelegram it詐欺で販売しないように注意してください。 すべての設定はここでブログで無料です。  重要! 指示とボーナスを得るために購入後すぐに私に連絡してください! 私の他のプロダクトと同様、実質操作の監視はここに見つけることができます: https://www.mql5.com/en/users/mechanic/seller&nbsp ; 設定および入力: すべての
あなたのシンボルでどの戦略が実際に機能するか確認しましょう - リアルマネーをリスクにさらす前に。 Power Barは、あらゆるシンボルとあらゆるタイムフレームで 極端な価格バー を検出し、3つの異なるトレード戦略を即座にバックテストします。勝率、プロフィットファクター、損益を並べて比較できます。すべてが1つのインタラクティブなパネルに集約されています。 推測なし。カーブフィッティングなし。データだけです。 Power Barが特別な理由 ほとんどのインジケーターはシグナルを出すだけで、それが機能するかどうかは推測に任されます。Power Barはさらに先を行きます - すべてのシグナルを 3つの戦略 に対してテストし、統計を表示します。FlipFlop、Momentum、Reversalをワンクリックで切り替え、数値が即座に変化するのを確認できます。 FlipFlop - 常にポジションを保有。シグナルでエントリーし、反対シグナルでイグジット。当社のリサーチでは、US30、US500、DAXなどのトレンドのあるインデックスで最も効果的です。 Momentum - シグナルの方向に
まず第一に、この取引ツールはノンリペイント、ノンリドロー、ノンラグの指標であり、プロの取引に理想的ですことを強調する価値があります。 オンラインコース、ユーザーマニュアル、デモ。 スマートプライスアクションコンセプトインジケーターは、新米から経験豊富なトレーダーまで、非常 に強力なツールです。Inner Circle Trader AnalysisやSmart Money Concepts Trading Strategiesなど、20以上の有用な指標を1つに組み合わせています。このインジケーターはスマートマネーコンセプトに焦点を当て、大手機関の取引方法を提供し、彼らの動きを予測するのに役立ちます。 特に、流動性分析に優れており、機関がどのように取引しているかを理解しやすくしています。市場のトレンドを予測し、価格の動きを慎重に分析するのに優れています。機関の戦略とトレードを合わせることで、市場の動向についてより正確な予測ができます。このインジケーターは多目的であり、市場構造を分析し、重要な注文ブロックを特定し、さまざまなパターンを認識するのに優れています。 このインジケーター
FX Power: 通貨の強弱を分析して、より賢い取引を実現 概要 FX Power は主要通貨と金の実際の強弱をあらゆる市場状況で理解するための必須ツールです。強い通貨を買い、弱い通貨を売ることで、 FX Power は取引の意思決定を簡素化し、高い確率の取引機会を見出します。トレンドを追従する場合でも、極端なデルタ値を使用して反転を予測する場合でも、このツールはあなたの取引スタイルに完全に適応します。ただ取引するだけではなく、 FX Power で賢く取引をしましょう。 1. なぜ FX Power がトレーダーにとって非常に有益なのか 通貨と金のリアルタイム強弱分析 • FX Power は主要通貨と金の相対的な強弱を計算し、マーケットダイナミクスに関する明確な洞察を提供します。 • どの資産がリードしているか、または後れを取っているかを監視して、取引するペアを賢く選びましょう。 マルチタイムフレームの包括的なビュー • 短期、中期、長期のタイムフレームで通貨と金の強弱を追跡し、マーケットトレンドに基づいて取引戦略を調整できます。 • スキャルピングからスイングトレード
まず第一に、この取引インジケーターは再描画されず、再描画されず、遅延しないことを強調する価値があります。これにより、手動取引とロボット取引の両方に理想的なものになります。 ユーザーマニュアル:設定、入力、戦略。 アトミックアナリストは、価格の強さとモメンタムを利用して市場でより良いエッジを見つけるためのPA価格アクションインジケーターです。ノイズや誤ったシグナルを除去し、取引ポテンシャルを高めるための高度なフィルターを備えています。複雑なインジケーターの複数のレイヤーを使用して、アトミックアナリストはチャートをスキャンし、複雑な数学的計算をシンプルなシグナルと色に変換します。これにより、どのような初心者トレーダーでも理解して使用し、一貫した取引の決定を行うことができます。 「アトミックアナリスト」は、新規および経験豊富なトレーダー向けにカスタマイズされた包括的な取引ソリューションです。プレミアムインジケーターとトップノッチの機能を1つの取引戦略に組み合わせ、すべてのタイプのトレーダーにとって汎用性のある選択肢にします。 デイリートレーディングとスキャルピング戦略:高速で正確なデイ
Bill Williams Advanced is designed for automatic chart analysis using Bill Williams' "Profitunity" system. The indicator analyzes four timeframes at once. Manual (Be sure to read before purchasing) Advantages 1. Analyzes the chart using Bill Williams' "Profitunity" system. Signals are displayed in a table in the corner of the screen and on the price chart. 2. Finds all known AO and AC signals, as well as zone signals. Equipped with a trend filter based on the Alligator. 3. Finds "Divergence Bar
Introducing Indicator for PainX and GainX Indices Traders on Weltrade Get ready to experience the power of trading with our indicator, specifically designed for Weltrade   broker's PainX and GainX Indices.  Advanced Strategies for Unbeatable Insights Our indicator employs sophisticated strategies to analyze market trends, pinpointing optimal entry and exit points.  Optimized for Maximum Performance To ensure optimal results, our indicator is carefully calibrated for 5-minute timeframe charts on
RelicusRoad Pro: 定量的市場オペレーティングシステム 【期間限定】無制限アクセス 70% OFF - 2,000人超のトレーダーと共に なぜ多くのトレーダーは「完璧な」インジケーターを使っても失敗するのでしょうか? それは、文脈を無視して 単一の概念 だけでトレードしているからです。文脈のないシグナルは単なるギャンブルです。勝ち続けるには、 根拠の重なり(コンフルエンス) が必要です。 RelicusRoad Proは単なる矢印インジケーターではありません。完全な 定量的市場エコシステム です。独自のボラティリティモデリングを用いて、価格が推移する「適正価値の道(Fair Value Road)」をマッピングし、ノイズと真の構造的ブレイクを判別します。 推測はやめましょう。機関投資家レベルの「ロード・ロジック」でトレードを。 コアエンジン:「Road」アルゴリズム システムの中心となる Road Algo は、市場環境にリアルタイムで適応するダイナミックなボラティリティチャネルです。 安全ライン(平衡点) と、価格が数学的に反転しやすい 拡張レベル を投影します。 Si
Berma Bands
Muhammad Elbermawi
5 (8)
Berma Bands (BBs) インジケーターは、市場のトレンドを特定して活用したいトレーダーにとって貴重なツールです。価格と BBs の関係を分析することで、トレーダーは市場がトレンド段階にあるか、レンジ段階にあるかを判断できます。 詳細については、[ Berma Home Blog ] をご覧ください。 バーマ バンドは、上部バーマ バンド、中部バーマ バンド、下部バーマ バンドの 3 つの異なる線で構成されています。これらの線は価格の周りにプロットされ、全体的な傾向に対する価格の動きを視覚的に表します。これらのバンド間の距離から、ボラティリティや潜在的な傾向の反転についての洞察を得ることができます。 バーマ バンドの線がそれぞれ離れると、市場が横ばいまたはレンジ相場の期間に入っていることを示すことがよくあります。これは、明確な方向性の偏りがないことを示しています。トレーダーは、これらの期間中にトレンドを特定するのが難しいと感じる可能性があり、より明確なトレンドが出現するまで待つ場合があります。 バーマ バンドの線が 1 本の線に収束すると、強いトレンド環境の兆候となること
ARIPoint is a powerful trading companion designed to generate high-probability entry signals with dynamic TP/SL/DP levels based on volatility. Built-in performance tracking shows win/loss stats, PP1/PP2 hits, and success rates all updated live. Key Features: Buy/Sell signals with adaptive volatility bands Real-time TP/SL/DP levels based on ATR Built-in MA Filter with optional ATR/StdDev volatility Performance stats panel (Success, Profit/Loss, PP1/PP2) Alerts via popup, sound, push, or email Cu
現在33%オフ 初心者にもエキスパートトレーダーにも最適なソリューション このインジケーターは独自の機能と新しい公式を多数内蔵しており、ユニークで高品質かつ手頃な取引ツールです。このアップデートでは、2つの時間枠ゾーンを表示できるようになります。より長いTFだけでなく、チャートTFとより長いTF(ネストゾーンを表示)の両方を表示できます。すべてのSupply Demandトレーダーの皆さんのお気に召すはずです。:) 重要情報の公開 Advanced Supply Demandの可能性を最大化するには、 https://www.mql5.com/ja/blogs/post/720245 にアクセスしてください。   エントリーまたはターゲットの正確なトリガーポイントを正確に特定できれば取引がどのように改善されるか想像してみてください。新しい基盤となるアルゴリズムに基づいて構築されているため、買い手と売り手の間の潜在的な不均衡をさらに簡単に特定できます。これは、最も強い需要と供給のゾーンと、過去のパフォーマンス(古いゾーンを表示)がグラフィカルに表現されるためです。これらの機能は、最適な
Easy SMC Trading
Israr Hussain Shah
4 (1)
自動RR&BOSスキャナー搭載ストラクチャートレンド バージョン: 1.0 概要 自動RRスキャナー搭載ストラクチャートレンドは、プライスアクションとマーケットストラクチャーを重視するトレーダー向けに設計された包括的なトレーディングシステムです。平滑化されたトレンドフィルターとスイングポイント検出、そしてストラクチャーブレイク(BOS)シグナルを組み合わせ、高確率のトレードセットアップを生成します。 このツールの最大の特徴は、自動リスク管理です。有効なストラクチャーブレイクを検出すると、インジケーターはリスク/リワードゾーン(1:1、1:2、1:3)を瞬時に計算・描画し、価格が目標値に到達すると自動的にトレードの視覚化を管理します。これにより、手動で描画ツールを使用する必要がなくなり、トレーダーは執行のみに集中できます。 主な機能 ダイナミック・ストラクチャーブレイク(BOS)検出 スイングハイ(HH/LH)とスイングロー(HL/LL)を自動的に識別します。 価格が主要なストラクチャーレベルをブレイクすると、チャート上にBOSラインを直接描画し、トレンドの方向を確認します。
サポート線と抵抗線のプロットにうんざりしていませんか? サポートレジスタンス は、非常に興味深いひねりを加えてチャート内のサポートとレジスタンスラインを自動検出およびプロットするマルチタイムフレームインジケーターです。価格レベルは時間とともにテストされ、その重要性が高まるにつれて、ラインは太くなり、暗くなります。 [ インストールガイド | 更新ガイド | トラブルシューティング | よくある質問 | すべての製品 ] 一晩でテクニカル分析を強化 チャートを閲覧せずに重要な価格レベルを検出 一目ですべての価格レベルの相対的な強さを認識する すべての取引で最大30時間のプロットラインを節約 インジケーターは、すべての価格レベルの年齢を表示します インジケーターは再描画されていません 過去および現在の価格レベルは近接によって崩壊し、現在の市場行動に合わせて調整されます。動作は、必ずしもピークではない場所に線が引かれます。 価格レベルは、時間とともに拒否されるにつれて、より暗く、より広くなります ノイズを避けるために、重要でない価格レベルは定期的にクリアされます カスタマイズ可能な時間枠の
このインジケーターは、反転ポイントと価格戻りゾーンを正確に表示します。     主要プレーヤー 。新たなトレンドが形成される場所を把握し、最大限の精度で意思決定を行い、すべての取引をコントロールします。 TREND LINES PRO インジケーターと組み合わせることで、その潜在能力を最大限に発揮します。 VERSION MT4 インジケーターが示す内容: 新しいトレンドの始まりに活性化する反転構造と反転レベル。 リスクと報酬の比率を最小限に抑えた利益 確定 と 損失停止の レベルの表示     RR 1:2   。 インテリジェントな削減ロジックによるストップロス。 指定されたインジケーターから 2 つのトレンド タイプの反転パターンを表示します。 指標: トレンドを追う   TREND LINES PRO   (世界的なトレンドの変化) TREND PRO   (クイックトレンド変更) シンプルで効果的   スキャナー   リアルタイムトレンド(新機能)。 マルチタイムフレームのインストゥルメント フィルタリング。 画面   利益     LOGIC AI信号の後。 当日プラス方
Currency Strength Dashboard Pro MetaTrader 5 用の リアルタイム通貨強度分析プロフェッショナルダッシュボード 。 このインジケーターは、 8つの主要通貨 (EUR、USD、GBP、JPY、CHF、AUD、CAD、NZD)の強さを計算し、 28の通貨ペア を同時に複数の時間足で分析・表示します。 ダッシュボードにより、トレーダーは 市場全体の状況を一目で把握 でき、余計な計算や複数のチャートを切り替える必要がありません。 計算方法 このインジケーターは、 高度な数学的通貨強度分析手法 に基づいています。 これは、類似インジケーターで一般的に使用されている RSIベースの手法 と比較して、より正確で客観的です。 この方法は 28の通貨ペアすべての相互関係を同時に分析 し、市場における実際の力関係をよりクリーンで偏りのない形で表示します。 リアルタイムダッシュボード メインテーブルには 8つの通貨 の完全なデータが表示されます。 Rank(順位) — 通貨の総合強度による順位。 1(最も強い)〜8(最も弱い) 。 Strength(強度) — 現在
Gartley Hunter Multi - An indicator for searching for harmonic patterns simultaneously on dozens of trading instruments and on all possible timeframes. Manual (Be sure to read before purchasing) | Version for MT4 Advantages 1. Patterns: Gartley, Butterfly, Shark, Crab. Bat, Alternate Bat, Deep Crab, Cypher 2. Simultaneous search for patterns on dozens of trading instruments and on all possible timeframes 3. Search for patterns of all possible sizes. From the smallest to the largest 4. All fou
Matrix Arrow Indicator MT5
Juvenille Emperor Limited
5 (19)
マトリックスアローインジケーターMT5は、すべてのシンボル/商品(外国為替、商品、暗号通貨、インデックス、株式)で使用できる100%再描画されていないマルチタイムフレームインジケーターに続くユニークな10in1トレンドです。マトリックスアローインジケーターMT5は、初期段階で現在のトレンドを判断し、最大10の標準インジケーターから情報とデータを収集します。 平均方向移動指数(ADX) 商品チャネルインデックス(CCI) クラシック平研アシキャンドル 移動平均 移動平均収束発散(MACD) 相対活力指数(RVI) 相対力指数(RSI) 放物線SAR ストキャスティクス ウィリアムズのパーセント範囲 すべてのインジケーターが有効な買いまたは売りシグナルを与えると、対応する矢印がチャートに印刷され、次のろうそく/バーの開始時に強い上昇トレンド/下降トレンドを示します。ユーザーは、使用するインジケーターを選択し、各インジケーターのパラメーターを個別に調整できます。マトリックスアローインジケーターMT5は選択されたインディケーターからのみ情報を収集し、それらのデータのみに基づいてアローを印刷
ボリューム ブレイク オシレーターは、オシレーターの形で価格変動とボリューム トレンドを一致させるインジケーターです。 私はボリューム分析を戦略に統合したいと思っていましたが、OBV、マネー フロー インデックス、A/D、ボリューム加重 Macd など、ほとんどのボリューム インジケーターにいつもがっかりしていました。 そのため、このインジケーターを自分で作成し、その有用性に満足したので、市場に公開することにしました。 主な機能: ボリュームの増加 (ブレイク) によってサポートされる方向に価格が動くフェーズを強調します。 ボリュームの増加が止まり、市場が縮小するフェーズを強調します。 特に時間枠 (<=15 分) のデイトレードでは、価格もボリュームも動かないため、市場が将来の動きに備えられるフェーズを強調します。 ボリュームの増加によってサポートされていない場合、他のエキスパートアドバイザーからの偽のシグナルをフィルタリングします。 トレンドとレンジフェーズを非常に簡単に視覚化できます 入力パラメータ: 計算設定: 計算タイプ: FAST、NORMAL、SLOW。同じ
優れたテクニカルインジケーター「Grabber」をご紹介します。これは、すぐに使える「オールインワン」トレーディング戦略として機能します。 ひとつのコードに、市場のテクニカル分析ツール、取引シグナル(矢印)、アラート機能、プッシュ通知が強力に統合されています。 このインジケーターを購入された方には、以下の特典を無料で提供します: Grabberユーティリティ:オープンポジションを自動で管理するツール ステップバイステップのビデオマニュアル:インジケーターのインストール、設定、取引方法を解説 カスタムセットファイル:インジケーターをすばやく自動設定し、最大限の成果を出すための設定ファイル 他の戦略はもう忘れてください!Grabberだけが、あなたを新たなトレードの高みへと導いてくれるのです。 Grabber戦略の主な特徴: 推奨タイムフレーム:M5〜H4 対応通貨ペア・資産:どれでも使用可能ですが、私が実際に検証した以下を推奨します(GBPUSD、GBPCAD、GBPCHF、AUDCAD、AUDUSD、AUDSGD、AUDCHF、NZDUSD、NZDCAD、EURCAD、EURUSD、E
AriX
Temirlan Kdyrkhan
1 (4)
AriX Indicator for MT5 A powerful trend-following and signal-evaluation tool AriX is a custom MT5 indicator that combines Moving Averages and ATR-based risk/reward logic to generate clear buy/sell signals. It visualizes dynamic SL/TP levels, evaluates past trade outcomes, and displays win/loss statistics in a clean on-chart panel. Key features include: Buy/Sell signals based on MA crossovers ATR-based SL/TP1/TP2/TP3 levels with visual lines and labels Signal outcome tracking with real-time stat
作者のその他のプロダクト
ExactArrows
Pavel Krysanov
3.71 (7)
The main aim of this indicator lies in determining entry and exit points, that is why the ExactArrow indicator does not draw nothing but arrows which show entry and exit points. In spite of apparent simplicity of the indicator, it has complicated analytic algorithms which determine entry and exit points. The indicator generates exact and timely entry and exit signals which appear on the current candle. The indicator generates an average of 1-2 candles before its analogues do. The indicator is ve
The NitroTrade indicator is a good assistant for traders who work based on trend strategies. The indicator works based on multiple moving average indicators as well as a proprietary strategy. The NitroTrade indicator is easy to use. To open Buy is it necessary to wait for an upward arrow, to open Sell - downward arrow. The indicator also gives information on the values of multiple indicators at the top right corner, and gives a hint in the form of a text (BUY, SELL) if a signal appears. The indi
For any trader, the result of market analysis is the correct identification of the market entry and exit points. The more correctly they are selected, the more profitable the trading. The SmartArrows indicator does not display any excessive information that may distract or confuse the trader, but only the mot important things. The indicator is very simple to use. When a down arrow appears, open a SELL trade, with an up arrow open BUY. Despite its seeming simplicity, the SmartArrows indicator con
Correct market entries and exits are essential for any Forex trader. MasterArrow indicator addresses this issue. It has no redundant elements and draws only buy/sell arrows. The up arrow is a BUY signal, while the down arrow is a SELL one. The indicator is simple to configure. Change the Strength parameter to configure the signals frequency. The product is based on standard indicators (MA, RSI, ATR, etc.). But it also features the custom algorithm allowing to combine them into a single tool and
RightTrend
Pavel Krysanov
5 (3)
The RightTrend indicator shows the direction of trend and reversal points (market entry and exit points). It is very easy to use: open BUY deal when the up arrow appears and open SELL deal when the down arrow appears. The indicator generates accurate and timely signals for entering and exiting the market, which appear on the current candle while it is forming. In spite of apparent simplicity of the indicator, it has complex analytic algorithms which determine trend reversal points. Inputs stren
This indicator is designed to help traders in determining the market entry and exit points. It is very easy to use: open s BUY deal when the up arrow appears and open s SELL deal when the down arrow appears. The indicator is based on the basic indicators (MA, MACD, RSI) as well as original algorithms. The indicator does not redraw, arrows appear when a new candle opens. Input Parameters: strength - indicator period EnableAlerts - enable/disable alerts EmailAlert - send notifications to email wh
TraderHelp
Pavel Krysanov
5 (3)
The main goal of the indicator is to determine the most optimal points of entry and exit from a trade. The indicator consists of three parts. The first one is arrows displaying the most efficient market entry/exit points. The up arrow is a buy signal, the down arrow is a sell one. The indicator contains an analytical analysis algorithm that includes a set of standard indicator readings, as well as a custom algorithm. The second part is data in the upper right corner (works on М1-D1 timeframes) o
The Analytic Trade indicator is a complete trading system. It consists of 4 parts: The first part is the arrows showing the most optimal points for opening and closing orders. The up arrow is a buy signal, the down arrow is a sell one. The second part is the information panel in the upper right corner. The current price is shown in a larger font, above it are: the daily High, distance from the current price to the daily High, and the difference between the High and Low (in points). Below it are:
Smart Help
Pavel Krysanov
5 (2)
The 'Smart Help' indicator is an excellent assistant for beginners and experienced traders. It consists of 3 parts: The first part provides entry and exit signals in the form of arrows. The up arrow is a signal of an uptrend, the down arrow indicates a downward trend. The second part shows the direction and strength of the current trend. The third part provides information on the currency pair state. The current price is indicated at the top. Below it are: the daily Low and High, the point dista
The UpDownSignals indicator is designed to identify entry and exit points for a deal. Using it is very simple: when an up arrow appears, open a BUY deal, when a down arrow appears, open a SELL deal. The indicator gives accurate and timely signals for entry and exit, appearing on the current candle between the time the candle opens and closes. The indicator works on the basis of MACD, candlestick patterns and proprietary algorithms. Indicator inputs: period - indicator period enableAlerts - Ena
Индикатор Analytic System - это полноценная торговая система. Он состоит из 2 частей: Первая - это стрелочки, показывающие наиболее оптимальные точки открытия и закрытия сделок. Стрелка вверх - сигнал на покупку,стрелка вниз - на продажу. Индикатор использует сложные аналитические алгоритмы, при помощи которых система определяет моменты входов и выходов. Вторая - это информационная панель в правом верхнем углу. Крупным шрифтом обозначена цена, справа от неё показано текущее направление тренда (в
Данный индикатор рисует на графике стрелки, которые являются сигнала на вход и выход из сделки, а также в качестве фильтра индикатор окрашивает каждую свечу в синий и красный цвет. Дополнительно ко всему в левом верхнем окне показывается сила тренда и его направление по основным парам. У индикатора новая логика, которая существенно отличает его от множества аналогов. Он дает ранние сигналы на вход и на выход, свои значения не перерисовывает — то есть, если индикатор дал сигнал на вход в сделку,
Индикатор Trading Strategy призван помочь трейдерам в поиске оптимальных входов в сделку и выходов из неё. В его основе лежат показания технических индикаторов (MA, RSI, ATR и др.), а также авторский алгоритм, связывающий их сигналы в единое целое. Индикатор даёт сигналы на покупку и продажу в виде стрелочек: стрелочка вверх — сигнал на покупку, вниз — на продажу.   В правом верхнем углу показаны сигналы индикатора на 6 таймфреймах (M1, M5, M15, M30, H1, H4) данной валютной пары.  Индикатор сво
This indicator is designed to identify trend reversal points. Its main difference from others is that it does not use moving indicators such as MA and built on its basis, namely, it does not show a trend reversal after the fact of a reversal, but tries to predict a trend reversal even BEFORE the reversal begins. The indicator is based on many different author's developments that allow you to minimize the number of false signals. The Trend Predictor indicator will be a very good helper in your
The Smart Strategy Indicator is a trading system that allows you to analyze the market in terms of several aspects of technical analysis. The first of them is a price channel, which is built automatically and allows the trader to see the main direction of price movement. It also makes it possible to analyze the market using a channel strategy (breakout and rebound from channel lines). Block 2 is the SAR system, which gives general information about the micro-movements in the market and this is
The indicator has a new logic, which significantly distinguishes it from many analogues. It gives early entry and exit signals, does not redraw its values - that is, if the indicator gave a signal to enter a trade, then this signal will not disappear and will not move - it will remain where it appeared, and it also gives signals to opening a candle, which gives the trader a significant advantage in trading. The indicator is very easy to use. When a red line appears under the candles, you need
The main objective of this indicator is to determine entry and exit points, that is why ExactArrow draws nothing but arrows showing entry and exit points. In spite of apparent simplicity of the indicator, it has complicated analytic algorithms which determine entry and exit points. The indicator generates exact and timely entry and exit signals which appear on the current candle. The indicator generates an average of 1-2 candles before its analogues do. The indicator is very easy to use. Open Bu
For any trader, the result of market analysis is the correct identification of the market entry and exit points. The more correctly they are selected, the more profitable the trading. The SmartArrows indicator does not display any excessive information that may distract or confuse the trader, but only the mot important things. The indicator is very simple to use. When a down arrow appears, open a SELL trade, with an up arrow open BUY. Despite its seeming simplicity, the SmartArrows indicator con
This indicator is designed to help traders find the market entry and exit points. The indicator generates signals in the form of arrows, which is a simple and intuitive for use in trading. In spite of apparent simplicity of the indicator, it has complicated analytic algorithms which determine entry and exit points. Its operation is based on moving averages, RSI, candlestick patterns, as well as certain original developments. Open a Buy position when an upward arrow appears, and a Sell position w
For any trader, the result of market analysis is the correct determination of entry and exit points from the market. The ClearArrows indicator does not display any unnecessary information that may distract or mislead the trader, but only the most important thing. The indicator is very easy to use, when a down arrow appears, you need to open a SELL deal, when an up arrow appears you need to open a BUY deal. The ClearArrows indicator, despite its outward simplicity, has a large analytical algori
Основная цель индикатора заключается в определении наиболее оптимальных точек входа в сделку и выхода из нее. Индикатор состоит из трех частей. Первая – это стрелки, показывающие оптимальные точки входа в сделку и выхода из нее. Стрелка вверх – сигнал на покупку, стрелка вниз – на продажу. В индикаторе заложен алгоритм аналитического анализа, который включает в себя множество показаний стандартных индикаторов, а также авторский алгоритм. Вторая часть – это информация в правом верхнем углу (работ
Индикатор Trading Strategy призван помочь трейдерам в поиске оптимальных входов в сделку и выходов из неё. В его основе лежат показания технических индикаторов (MA, RSI, ATR и др.), а также авторский алгоритм, связывающий их сигналы в единое целое. Индикатор даёт сигналы на покупку и продажу в виде стрелочек: стрелочка вверх — сигнал на покупку, вниз — на продажу. В правом верхнем углу показаны сигналы индикатора на 6 таймфреймах (M1, M5, M15, M30, H1, H4) данной валютной пары. Индикатор свои з
The main objective of this indicator is to determine entry and exit points, that is why ExactArrow draws nothing but arrows showing entry and exit points. In spite of apparent simplicity of the indicator, it has complicated analytic algorithms which determine entry and exit points. The indicator generates exact and timely entry and exit signals which appear on the current candle. The indicator generates an average of 1-2 candles before its analogues do. The indicator is very easy to use. Open Bu
Индикатор Smart Help является отличным помощником как для начинающего трейдера, так и для опытного. Он состоит из 3 частей: Первая - это сигналы на вход в сделки и выход из них в виде стрелочек. Стрелка вверх сигнализирует о восходящем тренде, стрелка вниз - о нисходящем. Вторая показывает направление текущего тренда и его силу. Третья - это информация о состоянии валютной пары. Наверху указана текущая цена. Под ней: максимум и минимум дня, расстояние между ними (в пунктах), средний дневной разм
フィルタ:
レビューなし
レビューに返信