 MetaTrader 5
 Uzmanlar
 Göstergeler
 Kütüphaneler
 Yardımcı programlar
 Widget'lar
 Kurallar
YouTube'dan Mağaza ile ilgili öğretici videoları izleyin
Bir alım-satım robotu veya gösterge nasıl satın alınır?
Uzman Danışmanınızı
sanal sunucuda çalıştırın
sanal sunucuda çalıştırın
Satın almadan önce göstergeyi/alım-satım robotunu test edin
Mağazada kazanç sağlamak ister misiniz?
Satış için bir ürün nasıl sunulur?
MetaTrader 5 için yeni Teknik Göstergeler - 185
 Teknik göstergelerden gelen sinyaller, borsa ve Forex piyasalarında işlemler açılması ve kapatılmasında çok önemli bir rol oynar. Göstergeler, fiyat değişikliklerini tahmin etmeyi amaçlayan, finansal sembol fiyatının matematiksel dönüşümüdür.
Piyasa davranışını daha iyi tahmin etmek ve bundan kar elde etmek için teknik göstergeleri test edin.

KT Pip Counter, gerçek zamanlı olarak bazı temel verileri gösteren basit ve bilgilendirici bir göstergedir. Bu kritik bilgiler, yoğun işlem seanslarında trader’a önemli avantaj sağlayabilir.
Özellikler
Güncel kâr/zararı para birimi, pip ve yüzde olarak gösterir. Anlık spread’i görüntüler. Mevcut mumun kapanmasına kalan süreyi gösterir. Kâr/zarar durumuna göre farklı renk şemaları. Metin konumu ve düzeni tamamen özelleştirilebilir. CPU kullanımını minimumda tutar.
Girişler Account P&L: true

KT Pivot Points, en son verilere dayanarak günlük, haftalık ve aylık pivot seviyelerini otomatik olarak grafiğe çizer. Pivot noktaları, özellikle Forex piyasasında teknik analizde yaygın olarak kullanılan bir göstergedir.
Özellikler
Fiyat bir pivot seviyesine ulaştığında uyarı gönderir. Her pivot seviyesi türü için tam özelleştirme sunar. Günlük, haftalık ve aylık pivot seviyelerini net bir şekilde gösterir. Daha hızlı hesaplama için minimum CPU kaynağı kullanır. Grafikteki diğer göstergele
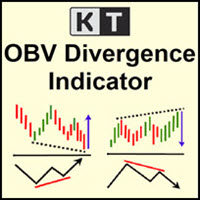
KT OBV Divergence, fiyat ile OBV (On Balance Volume) osilatörü arasında oluşan düzenli ve gizli uyumsuzlukları (divergence) gösterir.
Özellikler
Daha yüksek doğruluk ve daha sade grafik görünümü için simetrik olmayan uyumsuzluklar filtrelenir. Trend dönüşü ve trend devamı stratejilerini destekler. Expert Advisor’a tamamen entegre edilebilir şekilde uyumludur. Hem giriş hem çıkış sinyalleri için kullanılabilir. Tüm MetaTrader uyarı sistemleriyle uyumludur.
Divergence (uyumsuzluk) tam olarak ned
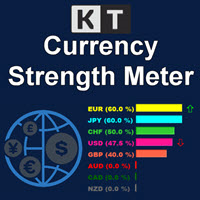
KT Currency Strength Meter, büyük döviz çiftleri üzerinde toplanan matematiksel bir formül uygulayarak her bir para biriminin güçlü ya da zayıf olduğunu ölçer. Bu güç, belirli bir zaman aralığında oluşan boğa ve ayı mumlarına göre hesaplanır. Toplanan verilerle algoritma, en güçlüden en zayıfa doğru sıralama yapar ve gerçek zamanlı olarak bu sıralamayı günceller.
Avantajlar
Güçlü para birimine karşı zayıf olanı almanızı öneren sinyalleri filtreleyerek stratejinizi anında geliştirin. İstenmeyen
KT TRSI, RSI (Göreceli Güç Endeksi), EMA (Üssel Hareketli Ortalama) ve SMA (Basit Hareketli Ortalama) kombinasyonuyla oluşturulmuş bir osilatördür. Klasik RSI’ye kıyasla, TRSI SMA’nın yumuşatma etkisi sayesinde yanlış sinyallere karşı daha az hassastır. Ayrıca MetaTrader'ın tüm uyarı türleriyle uyumludur.
Basit Giriş Kuralları
Alım: Mavi çizgi (RSI), kırmızı çizginin (TRSI) üzerine çıktığında. Satım: Mavi çizgi (RSI), kırmızı çizginin (TRSI) altına düştüğünde.
Gelişmiş Giriş Kuralları Alım: Ma
Her Bollinger Bandı temasını doğrudan grafikten izleyin KT Bollinger Bands Alert üst, orta ve alt Bollinger Bantlarını gösterir ve mevcut mumun seçilen bantlardan birine temas edip etmediğini izler. Yönteminiz için önemli olan bant olaylarını etkinleştirin ve siz piyasanın geri kalanına odaklanırken göstergenin bu anları dikkatinize sunmasını sağlayın. Üç bandın güncel değerlerini görünür tutun İsteğe bağlı fiyat etiketleri grafikte üst, orta ve alt bantların güncel değerlerini takip eder. Her b
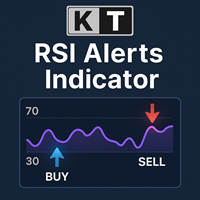
KT RSI Alerts, RSI (Göreceli Güç Endeksi) osilatörünün kişiselleştirilmiş bir versiyonudur ve aşağıdaki dört özel duruma dayalı olarak sinyaller ve uyarılar sağlar: RSI aşırı alım bölgesine girdiğinde. RSI aşırı alım bölgesinden çıktığında. RSI aşırı satım bölgesine girdiğinde. RSI aşırı satım bölgesinden çıktığında.
Özellikler RSI’nin aşırı alım/aşırı satım bölgelerindeki hareketlerine göre işlem yapan yatırımcılar için mükemmel bir seçimdir. Oldukça hafif kodlanmış olup sistem kaynaklarını mi

KT Forex Volume, bir döviz çiftinin alım ve satım hacmini renkli histogram şeklinde gösterir. Hacim, bir varlık üzerindeki alım ve satım işlemlerinden oluşur. Forex piyasasında: Eğer alım hacmi, satım hacminden büyükse döviz çiftinin fiyatı yükselir. Eğer satım hacmi, alım hacminden büyükse döviz çiftinin fiyatı düşer.
Özellikler İşlemleri, tick hacim verilerini kullanarak doğrulayarak kötü işlemlerden kaçının. Piyasadaki büyük oyuncuların yönünde işlem yapmanıza yardımcı olur. Tüm Metatrader u
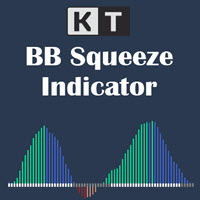
Momentum genişlemeden önce volatilite sıkışmasını görün KT BB Squeeze, volatilite durumunu ve momentum yönünü tek ve anlaşılır bir osilatörde birleştirir. Bollinger Bands ile Keltner Channels yapısını karşılaştırarak piyasanın sıkışma mı yoksa genişleme mi yaşadığını gösterir. Histogram ise momentumun sıfır çizgisi çevresinde nasıl geliştiğini ortaya koyar. Gri noktalar: Bollinger Bands, Keltner Channels içinde bulunur ve sıkışma dönemini gösterir. Beyaz noktalar: Bollinger Bands, Keltner Channe
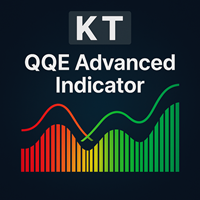
KT QQE Advanced, klasik QQE osilatörünün geliştirilmiş bir sürümüdür ve renkli histogram ile hızlı‑yavaş Trailing Line (TL) kullanarak daha kesin bir görünüm sunar.
Klasik QQE’den farklı olarak, KT QQE Advanced aşırı alım/aşırı satım seviyelerini barındıran bir histogramdan oluşur.
Uygulamalar
MTF tarayıcı ile tüm zaman dilimlerinde hızlı al/sat sinyalleri bulun. Trend yönünü daha doğru tespit edin. Piyasadaki aşırı alım/aşırı satım durumlarını saptar. Fiyat momentumunu gösterir.
Girdiler RS
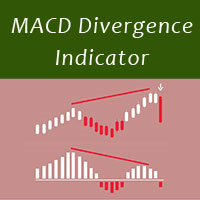
MACD divergence indicator finds divergences between price chart and MACD indicator and informs you with alerts (popup, mobile notification or email) . Its main use is to find trend reversals in the chart. Always use the divergence indicators with other technical assets like support resistance zones, candlestick patterns and price action to have a higher possibility to find trend reversals. Three confirmation type for MACD divergences: MACD line cross zero level Price returns to previous H/L Crea
FREE

Market Momentum Alerter Market Momentum Alerter will inform you about danger to operate in the market.
Imagine you see a very nice setup (Forex, Stocks, Indices) and you decide to place your trade...
And you finally lose your trade and don't understand what happened.
This can happen due to big operations in the market carried out by banks and big institutions.
These operations are invisible for most people.
Now with the Market Momentum Alerter you will be able to detect those operations...

Best indicator for MT5 providing accurate and sniper signals to enter a trade without repainting!
It can be applied to any financial assets: forex, synthetic, cryptocurrencies, metals, stocks, indices . It will provide pretty accurate trading signals and tell you when it's best to open a trade and close it. Most traders improve their trading results during the first trading week with the help of the Power Indicator Pro.
Benefits of the Power Indicator Pro
Entry signals without repaint

KT Average Daily Range(ADR) shows the upper and lower levels using the average daily range covered by the currency pair or the instrument. The average daily range is calculated using the chosen period in the input settings. ADR High: ADR upper level is found by adding the average daily range value to the current day's low.
ADR Low: ADR lower level is found by subtracting the ADR value from the current day's high.
Features
It shows the ADR levels with several other helpful information benefici

KT Fisher Transform is an advanced version of the original Fisher Transform oscillator equipped with divergence detection, crossover alerts, and many more features. Originally it was developed by John F. Ehlers. It converts the asset's price into a Gaussian normal distribution to find the local extremes in a price wave.
Features
A light-weighted oscillator that efficiently identifies the upward and downward crossovers and marks them using vertical lines. It also finds regular and hidden diverg

PriceRunner MT5 The PriceRunner indicator is based on pure relative power. It gives promising results even in M1 timeframes in currency pairs and M2 in commodities and cryptos. The indicator is designed with user-friendly and simple settings. It is very suitable even for beginners who are interested in indicators and strategies. I am ready to make improvements on the indicator in line with the needs of those who buy or rent. However, even in its current state, you can see very promising results
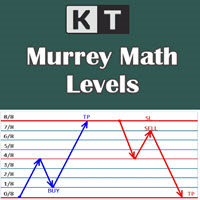
It shows the Murrey Math levels on chart and also provides an alert when price touch a particular level. T. Henning Murrey, in 1995, presented a trading system called Murrey Math Trading System, which is based on the observations made by W.D Gann.
Applications
For Murrey Math lovers, this is a must-have indicator in their arsenal. There is no need to be present on the screen all the time. Whenever the price touches a level, it will send an alert. Spot upcoming reversals in advance by speculatin
KT Candle Timer shows the remaining time in the closing of the current bar. You can use the bar closing time for multiple purposes, including time and trade management during the trading hours.
Features
It also shows the Symbol spreads along with the remaining time. It offers two convenient timer display positions, i.e., chart corner or next to the current bar. From colors to text size, it offers full customization according to user preferences. It is optimized to work without using extensive c
KT Bullish Bearish shows the bullish/bearish regime of the market in the form of a colored histogram representing both of the market states alternately. Bull Market (Blue Histogram): A bull market indicates an uptrend when an instrument price rises over a continued period like days, months, or years. Bear Market (Red Histogram): A bear market indicates a downtrend when an instrument price rises over a continued period like days, months, or years.
Applications
It prevents trading against the big
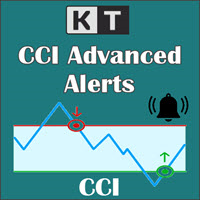
KT CCI Alerts is a personal implementation of the Commodity Channel Index (CCI) oscillator that provide signals and alerts on four custom events: When CCI enter in an overbought zone. When CCI exit from an overbought zone. When CCI enter in an oversold zone. When CCI exit from an oversold zone.
Features A perfect choice for traders who speculate the CCI movements within an overbought/oversold zone. Lightly coded without using extensive memory and resources. It implements all Metatrader alerts.
The Vortex Indicator was first presented by Douglas Siepman and Etienne Botes in January 2010 edition of Technical Analysis of Stocks & Commodities. Despite its based on a complex implosion phenomenon, the vortex is quite simple to interpret. A bullish signal is generated when +VI line cross above the -VI line and vice versa. The indicator is mostly used as a confirmation for trend trading strategies. The Vortex was inspired by the work of Viktor Schauberger, who studied the flow of water in tur
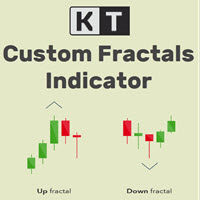
KT Custom Fractals is a personal implementation of the Fractal indicator first introduced by Bill Williams. With KT Custom Fractals you can choose a custom number of bars to allow to the left and right side of the fractal. For example, you can display the fractals that have "three" successive bars with the highest high in the middle and one lower high on both sides , or you can display the fractals that have "Eleven" consecutive bars with the lowest low in the middle and five higher lows on bot

KT Fractal Channel Breakout draws a continuous channel by connecting the successive Up and Down fractals. It provides alerts and also plots the Up and Down arrows representing the bullish and bearish breakout of the fractal channel.
Features
If you use Bill Williams fractals in your technical analysis, you must also include it in your trading arsenal. It can be very effective and useful for stop-loss trailing. A new market trend often emerges after a fractal channel breakout in a new direction.
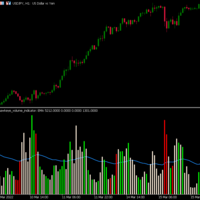
Hawkeye Volume Indicator contains a complex algorithm which executes over 300 calculations per bar in order to analyze the price action and associated volume, giving traders a tremendous advantage. Now Available in MT5 for U nlimited Use !
Volume is the only leading indicator which: .signals a price movement prior to it happening
.provides the fuel that drives the market Hawkeye Volume works in all markets and can be used in all timeframes for both tick and time charts – from longer term swing a
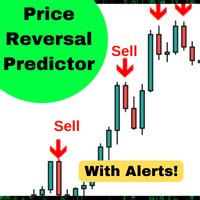
Bu algoritma, fiyattaki kısa vadeli değişiklikleri% 90 * doğrulukla öngörür. Fiyatın sinyal mumundan daha yüksek veya daha düşük olup olmayacağını tahmin eder. Daha büyük zaman dilimlerinde ortalama geri dönüş ticareti, ikili opsiyonlar veya vadeli işlem sözleşmeleri için mükemmeldir. Gösterge, 5 yıllık verilerle geriye dönük olarak test edildi ve zaman içindeki fiyat geri dönüşlerini tahmin etmek için% 90 doğruluğa sahip.
Özellikler: 1. Basit kurulum a. Herhangi bir grafiğe sürükleyip bırakın
FREE
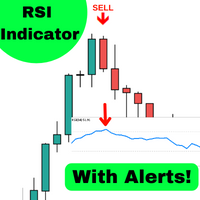
Bu algoritma, fiyattaki kısa vadeli değişiklikleri% 86 * doğrulukla öngörür. ATR tarafından belirlenen büyük bir hareket olduğunda, aşırı alım veya aşırı satım durumu sırasında gösterge sizi uyaracaktır. Fiyatın sinyal mumundan daha yüksek veya daha düşük olup olmayacağını tahmin eder. Daha büyük zaman dilimlerinde ortalama geri dönüş ticareti, ikili opsiyonlar veya vadeli işlem sözleşmeleri için mükemmeldir. Gösterge, 5 yıllık verilerle geriye dönük olarak test edildi ve zaman içindeki fiyat g
FREE
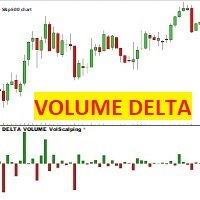
HACİM DELTA Volscalping Bu gösterge, her fiyat mumu için, alınan ve satılan sözleşmeler arasındaki fark olan bir Delta mumu çizer. Teklifte işlem gören (satılan) sözleşmeler satıştaki sözleşmeleri aşarsa mum kırmızı ve negatif, aksine ASK'da işlem gören (alınan) sözleşmeler teklifteki sözleşmeleri aşarsa mum yeşil ve pozitif olacaktır.
DİKKAT: Gösterge yalnızca gerçek piyasa veri akışı sağlayan ve imzalanan sözleşmeleri BID ve ASK olarak ayıran brokerlerle çalışır. Forex, CFD'ler ve Kripto pa
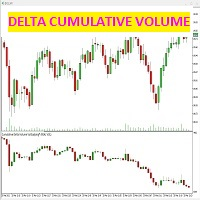
bu gösterge, her bir mum için teklifte ve talepte (saldırganlık) yapılan sözleşmeler arasındaki farkı tespit eder.
gösterge, fiyat grafiğinin altındaki özel pencerede, tam olarak satılan ve satın alınan sözleşmeler arasındaki farkla verilen ve piyasanın hacimsel gücünü oluşturan mumları gösterir.
(ekran görüntülerinden bakın) sadece kümülatif mum delta grafiğinin nasıl seçileceği veya hatta mumların kendi trend çizgisi ile nasıl seçileceği mümkündür: ikinci kutuyu seçerek u "HİÇBİR" trend çiz
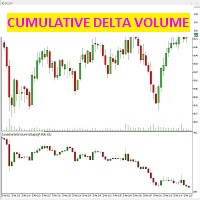
bu gösterge, her bir mum için teklifte ve talepte (saldırganlık) yapılan sözleşmeler arasındaki farkı tespit eder.
gösterge, fiyat grafiğinin altındaki özel pencerede, tam olarak satılan ve satın alınan sözleşmeler arasındaki farkla verilen ve piyasanın hacimsel gücünü oluşturan mumları gösterir.
(ekran görüntülerinden bakın) sadece kümülatif mum delta grafiğinin nasıl seçileceği veya hatta mumların kendi trend çizgisi ile nasıl seçileceği mümkündür: ikinci kutuyu seçerek u "HİÇBİR" trend çiz

KT Coppock Curve, yumuşatılmış bir momentum okumasını piyasa yönünün net bir görünümüne dönüştürür. Gösterge fiyat grafiğinin altındaki ayrı bir pencerede çalışır ve sıfır çizgisi ana referans noktasıdır. Eğrideki her küçük değişime tepki vermek yerine momentumun yükseliş veya düşüş tarafında kalıp kalmadığını hızlıca görebilirsiniz. Eğri, daha uzun ve daha kısa dönemli değişim oranlarını birleştirir ve sonucu yumuşatır. Böylece daha geniş momentum değişimlerini takip etmeye yardımcı olurken hız
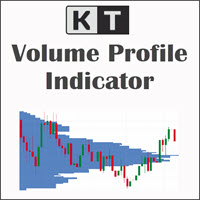
KT Volume Profile, grafikte seçtiğiniz alan içinde işlem faaliyetinin hangi fiyatlarda yoğunlaştığını incelemenize yardımcı olur. Dikdörtgeni analiz etmek istediğiniz hareketin üzerine yerleştirin ve sol veya sağ sınırını sürükleyin. Profil hemen yeniden hesaplanır ve seçilen fiyat aralığı boyunca yatay bir histogram çizer. Grafiğin gerçekten önemli bölümünü seçin Sabit bir seansa veya geçmiş dönem uzunluğuna bağlı değilsiniz. Hareketli kutu ile bir trend ayağını, sıkışmayı, kırılma tabanını, ha

Göstergemiz, aynı anda birden fazla çiftin yayılmasını izlemek için bir yayılma ayırıcı sağlar ve ayrıca bir mum zamanlayıcı geri sayımı, mevcut çubuk kapanmadan ve yeni bir çubuk oluşmadan önce kalan süreyi görüntüler.
SINIRLI SÜRELİ TEKLİF: Tüm premium göstergelerimiz sadece 50$ karşılığında mevcuttur, MQL5 blogumuza erişerek premium göstergelerimizin tüm ayrıntılarını bulacaksınız. Buraya Tıkla.
Ana Özellikler Aynı anda yayılan çoklu çiftleri izleyin. Yerel saati değil, sunucu saatini iz
FREE

ROC, fiyatın önceki bir döneme kıyasla ne kadar hızlı değiştiğini ölçer. Bu nedenle fiyat yeni bir salınım tepesi veya dibi oluştururken hareketin arkasındaki momentum bunu doğrulamadığında özellikle kullanışlıdır. KT ROC Divergence bu uyumsuzlukları otomatik olarak bulur ve fiyat grafiği ile ROC penceresinde birbirine karşılık gelen çizgiler çizer. Sabit bir aralıkta kalan osilatörlerin aksine ROC, piyasanın hızına göre genişler ve daralır. Ham değeri farklı semboller arasında karşılaştırmanız
Çift çizgi sinyalleri, sıfır seviye sistemi, çoklu zaman dilimi desteği, özelleştirilebilir görsel sinyaller ve yüksek oranda yapılandırılabilir uyarı sistemi ile gelişmiş Göreli Güç Endeksi (RVI) göstergesi.
Serbest programlama hizmetleri, güncellemeler ve diğer TrueTL ürünleri MQL5 profilimde mevcuttur.
Geri bildirim ve incelemeler çok değerlidir!
Göreli Güç Endeksi (RVI) Nedir? Göreli Güç Endeksi (RVI), John Ehlers tarafından geliştirilen bir momentum osilatörüdür; ticaret aralığına göre n
FREE

Trend yönünü doğrudan grafikte okuyun KT Trend Magic, momentum ile volatiliteyi fiyatı izleyen renkli bir çizgide birleştirir. Çizgi aktif trend durumunu sürekli gösterir ve hesaplanan yön değiştiğinde renk değiştirir. Yeşil çizgi: yükseliş trendi durumunu gösterir. Kırmızı çizgi: düşüş trendi durumunu gösterir. Renk değişimi: grafikte yeni bir yön geçişini işaretler. Süregelen bir hareket sırasında çizgi, geri çekilmeler ve devam hareketleri için dinamik bir grafik referansı olarak da kullanıla
Hangi forex seansında işlem yaptığınızı ve her seansın kaç pip hareket ettiğini doğrudan MetaTrader 5 grafiğinizde görün. KT Forex Sessions MT5, Tokyo, Londra ve New York seanslarını renkli kutular olarak çizen ve her seansın büyüklüğünü pip cinsinden kendi kutusunun üzerine yazan bir seans indikatörüdür. İndikatör brokerınızın GMT farkını kendisi okur ve her seans kendi şehrinin yerel saatini ve yaz saatini takip eder. Kutular bütün yıl doğru yerde durur, ayarlamanız gereken hiçbir şey yoktur.
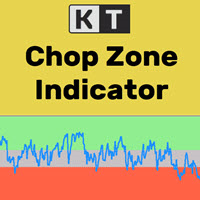
Finansal piyasalarda zamanın yalnızca %30’u trend hareketlerle geçerken, geri kalan %70’i yatay yani belirli bir aralıkta dalgalanarak geçer. Ancak, çoğu yeni başlayan yatırımcı için piyasanın gerçekten bir trend içinde mi yoksa yatay bir aralıkta mı hareket ettiğini anlamak oldukça zordur. KT Chop Zone bu sorunu çözmek için geliştirilmiştir. Piyasa durumunu açıkça üç bölgeye ayırarak gösterir: Ayı Bölgesi, Boğa Bölgesi ve Chop Zone (Yatay Bölge).
Özellikler
Yatay piyasalarda işlem yapmaktan ka
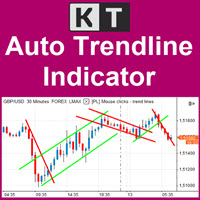
Önemli trend çizgilerini grafikte güncel tutun KT Auto Trendline, son ZigZag salınım noktalarından otomatik olarak bir üst ve bir alt trend çizgisi oluşturur, ardından iki çizgiyi de aktif grafikte ileriye doğru uzatır. Böylece aynı çizgileri sürekli elle yeniden çizmeden oluşan kırılmaları, tepkileri ve fiyat yönündeki değişimleri net bir yapı üzerinden izleyebilirsiniz. Yakın ve daha geniş salınım yapısını birlikte takip edin İlk trend çizgisi seti varsayılan olarak etkindir ve daha duyarlı bi
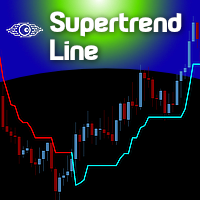
The Supertrend indicator was originally created by a french fellow named Olivier Seban , and its goal is to identify the Primary Trend of prices . Its calculation is easy and based on the average of Highs and Lows and then we add the volatility of a custom period, plus a multiplier. This way we get the Supertrend Line. You can find in the web several approaches and trading strategies using this very useful indicator.
HOW TO "READ" THIS INDICATOR
If the closing prices are above Supertrend Line,
FREE

The Analytical cover trend indicator is a revolutionary trend trading and filtering solution with all the important features of a trend tool built into one tool! The Analytical cover indicator is good for any trader, suitable for any trader for both forex and binary options. You don’t need to configure anything, everything is perfected by time and experience, it works great during a flat and in a trend.
The Analytical cover trend indicator is a tool for technical analysis of financial markets
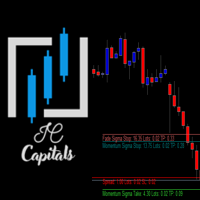
Key Features: Multi-Target Volatility: Configure multiple Take Profit and Stop Loss levels based on real-time market volatility. Fully Customizable: Set specific volatility multipliers (e.g., 4x for Stop, 10x for Take) using any look-back period (e.g., previous 20 bars on a 2-minute chart). Clear Visuals: Assign unique names to each level to be displayed directly on your symbol's chart for easy monitoring. Consistency: Every level calculated is synchronized with the volatility of your chosen per
FREE
Smart Moving Averages Indicator Smart Moving Averages is an exclusive indicator for Metatrader platform.
Instead of calculating moving averages for the selected chart time frame, the Smart Moving Averages indicator gives you the opportunity to calculate moving averages independently from the chart time frame.
For instance you can display a 200 days moving average in a H1 chart.
Inputs of the indicator are:
Timeframe : timeframe to be used for the calculation of the moving average Period : m

Bar Strength Divergence Indicator BarStrength Indicator is an exclusive indicator to trade Forex, Stocks, Indices, Futures, Commodities and Cryptos.
BarStrength Indicator shows the strength of each candle.
The indicator shows in a separate windows candles relatively to 2 price levels representing resistance and support in the market.
Once candle is near resistance it is highly probable that price movement will change direction and will go down in the next candles.
Once candle is near support
OBOS indicator
OBOS Indicator is an exclusive indicator to spot entries based on price action.
The OBOS Indicator is both effective and user friendly.
Indicator uses simple color codes and levels to indicate Overbought and Oversold conditions. No more headache.
The OBOS Indicator will only gives you indication when there are possible entries. Means you only get useful information.
Inputs of the indicator are:
MaxBars : number of bars to display in your chart Smoothing period : number of b

HighLow Arrow Indicator HighLow Arrow is a simple indicator to be used to signal major lows and major highs in your chart.
This indicator is not intended to be used to trade alone but more as an alert that a turning point might be forming.
In this case the HighLow Arrow indicator signals that a new high or a new low is forming and that traders can prepare for seeking new signals.
The formation of the High or the Low is confirmed after 2 bars have been closed. In the meantime, the alert can b
Tick imbalance bars (TIB), described in the book Advances in Financial Machine Learning (2018) by Marcos López de Prado. Indicator that show candlestick bars with an different sampling method than time fixed. Real time data is sourced to the indicator and it may be used as substitute of the default graph. Each bar is formed when a predefined tick balance is exceeded, showing in the graph the OHLC of this cluster of ticks. The input variable is the amount of ticks of each bar. The indicator may
FREE
Daily Pivots Multi Indicator Daily Pivots Multi is an exclusive indicator to draw your pivots levels and much more.
Most indicators draw daily pivots for the day. Daily Pivots Multi is able to draw levels for different days.
The indicator can do the calculation for unlimited number of days backward. It means that you can draw the levels for today but also for the past days.
This is very useful if you want to study a strategy with Pivots levels over a period of time.
Another problem is that e
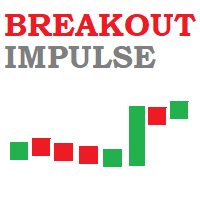
Breakout Impulse Indicator Breakout Impulse Indicator is a pattern recognition indicator for Forex, Stocks, Indices, Futures, Commodities and Cryptos.
The Breakout Impulse is a multi-bar pattern.
The purpose of the pattern is to identify a fast change in momentum.
This type of change can announce the start of a big directional move.
Inputs of the indicator are:
Distance : distance in pixel relative to top or bottom of candle to display the arrow symbol MaxBars : number of bars back used to
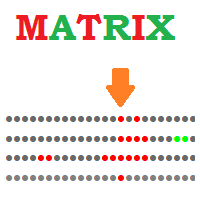
Matrix Indicator Matrix Indicator is a simple but effective indicator.
Matrix indicator displays usual oscillators indicators in a user friendly color coded indicator.
This makes it easy to identify when all indicators are aligned and spot high probability entries.
Inputs of indicator are:
Indicator: RSI, Stochastic, CCI, Bollinger Bands Param1/Param2/Param3: usual settings for the indicator ValueMin: Oversold level for oscillator ValueMax: Overbought level for oscillator The indicator can
The indicator is a trading system for AUDUSD or NZDUSD currency pairs.
The indicator was developed for time periods: M15, M30.
At the same time, it is possible to use it on other tools and time periods after testing.
"Kangaroo Forex" helps to determine the direction of the transaction, shows entry points and has an alert system.
When the price moves in the direction of the transaction, the maximum length of the movement in points is displayed.
The indicator does not redraw, all actions occ
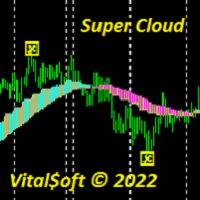
The Super Cloud indicator helps to determine the direction of the trend when trading. Shows on the chart signals about a possible upcoming trend change. The indicator provides an opportunity to detect various features and patterns in price dynamics that are invisible to the naked eye. Based on this information, traders can anticipate further price movement and adjust their strategy accordingly. Works on all timeframes except MN.
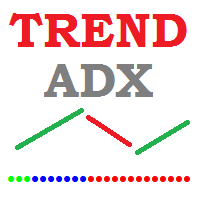
Trend Direction ADX indicator Trend Direction ADX is part of a serie of indicators used to characterize market conditions.
Almost any strategy only work under certain market conditions.
Therefore it is important to be able to characterize market conditions at any time: trend direction, trend strength, volatility, etc..
Trend Direction ADX is an indicator to be used to characterize trend direction:
trending up trending down ranging Trend Direction ADX is based on ADX standard indicator.
Tre

Trend Strength MA indicator Trend Strength MA is a part of a series of indicators used to characterize market conditions.
Almost any strategy only works under certain market conditions.
Therefore, it is important to be able to characterize market conditions at any time: trend direction, trend strength, volatility, etc.
Trend Strength MA is an indicator to be used to characterize trend strength:
Up extremely strong Up very strong Up strong No trend Down strong Down very strong Down extremely

Trend Direction Up Down Indicator Trend Direction Up Down is part of a series of indicators used to characterize market conditions.
Almost any strategy only works under certain market conditions.
Therefore it is important to be able to characterize market conditions at any time: trend direction, trend strength, volatility.
Trend Direction Up Down is an indicator to be used to characterize trend direction (medium term trend):
trending up trending down ranging Trend Direction Up Down is based
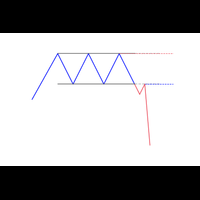
A new box will be added, if the closing price is higher than the maximum (lower than the minimum) of the current box series no less than for the specified value. Reversal will be made, if the closing price is higher (lower) than the last box on a value no less than the specified.
T his is a trend indicator and it can be used as an alternative for the trend definition instruments which use averaging.

KT Risk Reward shows the risk-reward ratio by comparing the distance between the stop-loss/take-profit level to the entry-level. The risk-reward ratio, also known as the R/R ratio, is a measure that compares the potential trade profit with loss and depicts as a ratio. It assesses the reward (take-profit) of a trade by comparing the risk (stop loss) involved in it. The relationship between the risk-reward values yields another value that determines if it is worth taking a trade or not.
Features
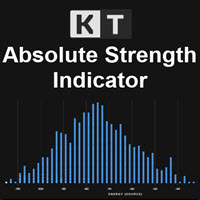
KT Absolute Strength measures and plots the absolute strength of the instrument's price action in a histogram form. It combines the moving average and histogram for a meaningful illustration. It supports two modes for the histogram calculation, i.e., it can be calculated using RSI and Stochastic both. However, for more dynamic analysis, RSI mode is always preferred.
Buy Entry
When the Absolute Strength histogram turns green and also it's higher than the previous red column.
Sell Entry
When th
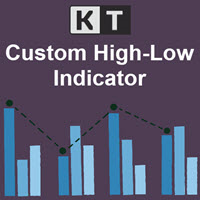
KT Custom High Low shows the most recent highs/lows by fetching the data points from multi-timeframes and then projecting them on a single chart. If two or more highs/lows are found at the same price, they are merged into a single level to declutter the charts.
Features
It is built with a sorting algorithm that declutters the charts by merging the duplicate values into a single value. Get Highs/Lows from multiple timeframes on a single chart without any fuss. Provide alerts when the current pri
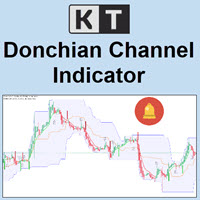
KT Donchian Channel is an advanced version of the famous Donchian channel first developed by Richard Donchian. It consists of three bands based on the moving average of last high and low prices. Upper Band: Highest price over last n period. Lower Band: Lowest price over last n period. Middle Band: The average of upper and lower band (Upper Band + Lower Band) / 2. Where n is 20 or a custom period value is chosen by the trader.
Features
A straightforward implementation of the Donchian channel ble
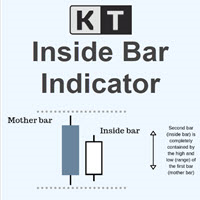
KT Inside Bar plots the famous inside bar pattern in which the bar carries a lower high and higher low compared to the previous bar. The last bar is also known as the mother bar. On smaller time-frames, the inside bar sometimes appears similar to a triangle pattern.
Features
Also plots entry, stop-loss, and take-profit levels with the inside bar pattern. No complex inputs and settings. Erase unwanted levels when the price reaches the entry line in either direction. All Metatrader alerts include
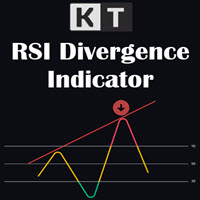
KT RSI Divergence shows the regular and hidden divergences built between the price and Relative Strength Index (RSI) oscillator. Divergence can depict the upcoming price reversal, but manually spotting the divergence between price and oscillator is not an easy task.
Features
Ability to choose the alerts only for the divergences that occur within an overbought/oversold level. Unsymmetrical divergences are discarded for better accuracy and lesser clutter. Support trading strategies for trend reve

Hunt markets with Hunttern ZigZag . Easy to use with one parameter
You can use it for the following: -Classic patterns -Heads and shoulders -Harmonic patterns -Elliott Wave -Support and resistance -Supply and Demand
Single parameter: -Period (1-120)
Features: -Candle time -Single parameter -Light mode template
This is version 1 of Hunttern ZigZag. We are very happy to receive feedback from you.
FREE

主要城市的时间。北京时间、东京时间、悉尼时间、惠灵顿时间、纽约时间、法兰克福时间、伦敦时间、迪拜时间。 城市时间可选择开启或者关闭。 点差变色提醒。设置点差提醒点数,例如,设置100点,点差大于100点,文字会变红色。 Time in major cities. Beijing time, Tokyo time, Sydney time, Wellington time, New York time, Frankfurt time, London time, Dubai time. City time can be turned on or off. Dot difference color change reminder. Set the point difference reminder points. For example, set 100 points. If the point difference is greater than 100 points, the text will turn red.
FREE

FX STEWARDS Trading Signals Alert (v5.00) – The Ultimate Hybrid Signal System (Heritage Edition) Built for traders. Engineered for precision. Designed to dominate. Harness the power of cutting-edge quantitative research with FX STEWARDS Trading Signals Alert, a professional-grade hybrid indicator that fuses a 73-feature neural network, a 30+ pattern candlestick engine, an institutional-style probability model, and full auto-timeframe intelligence into tiered BUY/SELL trade alerts — filtere
Automatic trend lines. Type 1. With two extremums. 1) From the current bar "go" to the left and look for the first (right) extremum point with the InpRightExmSide bars on both sides. 2) From the first point again "go" to the left and look for the second (left) extremum point with the InpLeftExmSide bars on both sides.

LT Easy Trend - Tek Bir İndikatörde Kesişimin (Confluence) Gücü Bir indikatör al sinyali verirken diğerinin sat sinyali vermesi yüzünden hiç kafa karışıklığı yaşadınız mı? LT Easy Trend, bu kararsızlığı ortadan kaldırmak amacıyla, dünyanın en saygın 9 teknik indikatörünün matematiksel ortak kararına dayanan yüksek olasılıklı sinyaller sunmak için geliştirilmiştir. Grafiğinizi düzinelerce pencereyle doldurmak yerine, Easy Trend tüm verileri gerçek zamanlı olarak işler ve yalnızca trend tüm filtre

Sqn Max Indicator Sqn Max is an exclusive indicator to trade the market with high effectiveness.
The indicator is based on price action, volatility and trend.
This indicator is as simple as possible but not too simple.
The indicator can generate alerts to ease the trading process. You don't have to stay all day in front of your screen.
The indicator can be used with any class of assets and with any time frame.
It is possible to achieve better results trading our list of selected assets.
We achi
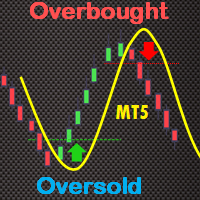
The True Oversold Overbought indicator provides you with ability to swiftly check whether the asset is oversold or overbought. Other than complementing your trading with True Oversold Overbought, you can use the indicator as your only trading system. It works with all forex instruments and will save you the headache of estimating when the market is due for a reversal or retracement. When the "Super Charge" feature is enabled, the areas where the price is in oversold/overbought status are ampli
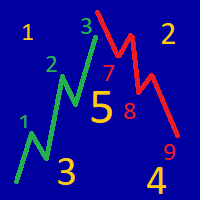
The indicator determines the strength of the trend and its possible reversal points, based on the author's arithmetic approach .
Each new peak or trough is a trend development. Such peaks and troughs are numbered so that the strength of the trend development can be seen. Attempts to change the trend are also numbered. This gives an understanding of a possible change in the direction of the trend. Indicator signals are generated when trying to change the trend .
In the settings, it is p
Mean Volume Most indicators are based on price analysis.
This indicator is based on volume. Volume is overlooked piece of information in most trading systems.
And this is a big mistake since volume gives important information about market participants.
Mean Volume is an indicator that can be used to spot when volume is above average.
It usually means that institutional traders are active.
Peak in volume can be used to confirm an entry since increased volume can sustain the move in one or anot
MetaTrader Mağazası, alım-satım robotları ve teknik göstergelerin benzersiz bir deposudur.
Yatırımcılara sunduğumuz benzersiz hizmetler hakkında daha fazla bilgi edinmek için MQL5.community - Kullanıcı Notunu okuyun: alım-satım sinyallerini kopyalama, freelancer'lar tarafından geliştirilen özel uygulamalar, Ödeme Sistemi aracılığıyla otomatik ödemeler ve MQL5 Bulut Ağı.

Alım-satım fırsatlarını kaçırıyorsunuz:
- Ücretsiz alım-satım uygulamaları
- İşlem kopyalama için 8.000'den fazla sinyal
- Finansal piyasaları keşfetmek için ekonomik haberler
Kayıt
Giriş yap
Web sitesi politikasını ve kullanım şartlarını kabul edersiniz
Hesabınız yoksa, lütfen kaydolun