Wink IND 5
- インディケータ
-
Arian Mansouri
 Smart trader assistant
 - バージョン: 1.0
- アクティベーション: 5
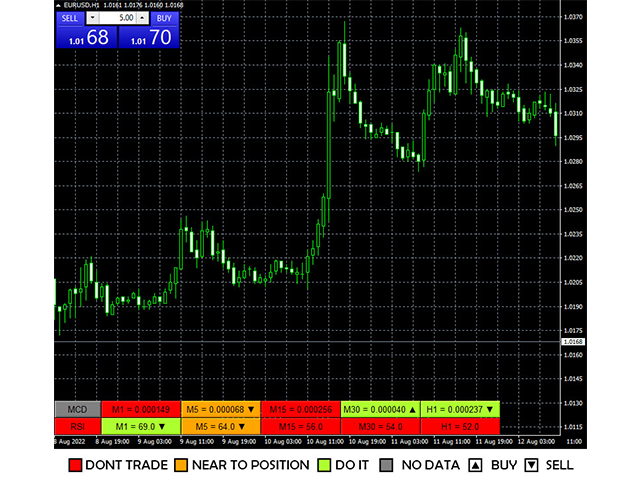
Wink IND is an indicator that tell you:
-when MACD is saying buy or sell
-when RSI is saying buy or sell
-work on multi timeframes
by Wink IND:
you don't need to have Knowledge about MACD or RSI
don't need to check and compare MACD and RSI respectly
don't need to check all of timeframes and compare the resaults
don't lose time, save more time for your decisions in trading
Wink IND:
multi timeframe indicator
multi currency indicator
show the positions by graphic shapes, arrows and colors
help you to find the positions
placed in the corner of chart and doesn't ... your focus
give you the golden positions when MACD and RSI saying it's the best time
demo version work for about two hours, try it..