 MetaTrader 5
 エキスパート
 インディケータ
 ライブラリ
 ユーティリティ
 ウィジェット
 ルール
YouTubeにあるマーケットチュートリアルビデオをご覧ください
ロボットや指標を購入する
仮想ホスティングで
EAを実行
EAを実行
ロボットや指標を購入前にテストする
マーケットで収入を得る
販売のためにプロダクトをプレゼンテーションする方法
MetaTrader 5のための無料のエキスパートアドバイザーとインディケータ - 100
 自動売買ロボットとインジケータを使用して、外国為替取引の収益性を高めます。 自動売買ロボットを使用すると、取引の開始と終了を自動化でき、インジケータは市場の行動をより正確に予測するのに役立ちます。
このページには、MetaTrader5アプリケーションのカタログが掲載されています。

Trading Statistics Dashboard — Day / Week / Month / Year P&L, Drawdown & Session Timeline A clean, real-time statistics panel for MetaTrader 5 that gives you a complete overview of your account performance without opening the Account History tab. Runs in its own indicator sub-window (does not overlay your chart), split into two side-by-side panels: a Day/Week/Month/Year performance table and a live account/position summary. Key Features Performance Table (Today / Yesterday / N past days / Week /
FREE
(Multiple Close All) for MT5 a lightweight and efficient utility designed to help traders close their open positions and pending orders directly from the chart.
It provides a clean panel with interactive buttons, allowing quick closing of opened trades and deleting the Pending Orders with one click. Key Features: Close all BUY , SELL , or ALL positions with one click. Close only profitable trades or only losing trades . Close trades filtered by Magic Number or Ticket Number . Perform par
FREE

これは、リアルタイムバイナンス先物ティックデータとリアルタイムバイナンススポットティックデータを処理するためのユーティリティです。 データをより高速にプルし、BinanceFutureの境界内にとどまるように設計されています。
動作ロジック:グローバル変数は、Binance Check ServerTimeから受信した時間情報を記録します。
他のプログラムでは、この時間情報を使用して、より速く、より効率的に作業を行います。
[ツール]メニュー>> [オプション] >> [エキスパートアドバイザー]からWebRequestを許可し、URLを追加する必要があります:https://api.binance.com 設置時や販売後に問題が発生した場合は、お気軽にお問い合わせください。
FREE

Multichart Dashboard — Your Central Command Center for Trading
The **Multichart Dashboard** Expert Advisor transforms your MetaTrader interface into a clean, professional trading hub. Manage up to **6 charts simultaneously** , switch between symbols in an instant and always stay in control — all within one compact, fully configurable panel.
What does Multichart Dashboard do?
**Up to 6 charts in parallel** — Set the desired number of charts (1–6) with a single input. All associated charts are
FREE

RSI 2-Level Scanner MT5 Multi-Symbol RSI Reversal Scanner with Clickable Chart Navigation Added the option to scan Market Watch or a custom list, as well as an option to open the chart in different views.
RSI 2-Level Scanner is a practical MetaTrader 5 tool for monitoring multiple symbols at the same time and detecting potential RSI reversal setups. Unlike a standard RSI scanner that only shows overbought or oversold values, this indicator uses a two-level confirmation system . For a LONG setup
FREE
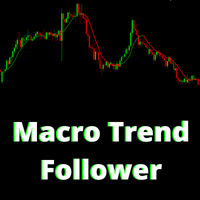
The Indicator assists in decision making along with the user's market reading. By drawing the trend, this indicator becomes very useful on days of high volatility in the market, that is, it offers strategic insights on days of economic data, news or pronouncements. On flat market days it becomes usual to identify possible market reversals. Follow Youtube to understand the most suitable scenarios for its use.
FREE

Currency Strength Meter Panel ranks the eight major currencies from strongest to weakest over the period you choose, computed from the 28 major pairs. A single currency pair mixes two forces, so it cannot tell you on its own whether the base is strong or the quote is weak. This panel separates the two and gives you a clear leaderboard, which points you toward the pairs where both currencies push the same way. The strength of each currency is shown as a percentage, the strongest in green and the
FREE

This indicator combines RSI(14) and ADX(14) to find out the signal that price moves strongly. When it appears signal (represent by the yellow dot), and price is going down, let consider to open a SELL order. Otherwise, let consider to open a BUY order. In this case, the strength of moving is strong (normally after sideway period), so we can set TP by 3 times of SL .
FREE
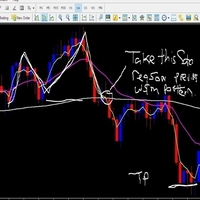
About. This indicator is the combination of 3 Exponential Moving averages, 3,13 and 144. it features Taking trades in the direction of trend, and also helps the trade to spot early trend change through Small moving averages crossing Big Moving averages Product features 1. Have built in Notification system to be set as the user desires (Alerts, Popup notification and Push Notification to Mobile devices) so with notification on, you do not need to be at home, or glued to the computer, only set and
FREE
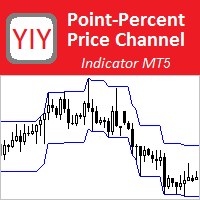
The Point-Percent Price Channel (PPPC or PP Price Channel) indicator is designed to display on the chart a channel whose width is specified both as a percentage of the current price and in points. Its appearance is presented on slide 1. When the market moves up, the upper border of the channel is built at the price of High candles. In this case, the lower boundary follows the upper one at a strictly specified distance. When the price touches the lower border of the channe
FREE

Metis Risk Guardian is an account protection utility for MetaTrader 5. It watches your equity in real time and, when a limit you set is reached, it closes every open position, deletes every pending order and keeps the account flat until you lift the lock. If you would rather stay in control, an alert-only mode warns you and touches nothing. What it protects you from
Most accounts are not lost in a single bad trade. They are lost in the hour after one, when the decision to stop has already been
FREE
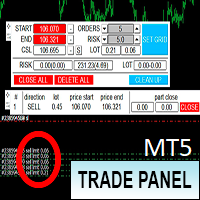
Торговая панель предназначена для установки сетки ордеров с различными параметрами. Добавлено все что есть у версии для МТ4. Предназначена для форекс счетов с хеджированием. Имеет несколько основных функций по установке ордеров в заданном диапазоне и с заданным риском, закрытию части ордеров из сетки, переносом в безубыток, закрытие части по профиту на определённом уровне, а также отображает информацию по текущему риску и отображает все сетки которые были выставлены по определённой паре при этом
FREE
VWAP (Volume Weighted Average Price) is a technical analysis indicator that shows the average price of an asset, weighted by trading volume, over a specified time period. It is calculated by dividing the total dollar value traded (price × volume) by the total volume. Formula: VWAP = sum(PRICE*VOLUME)/sum(VOLUME)
MM vwap have 4 options to set anchor:
Month Week Day Session Indicator will be updated in future.
FREE

A statistically-driven oscillator that quantifies directional market pressure through Monte Carlo simulation — designed for reversal traders who want probability on their side. What is this indicator? The Monte Carlo Oscillator measures the probability that price will be higher in the future based on the statistical distribution of recent returns. It does not use moving averages, RSI formulas, or any fixed mathematical transformation. Instead, it runs hundreds of randomized price simulations at
FREE
MultiFrame Volume Trend (MFVI) is a powerful VWAP-based indicator that displays volume trends across multiple timeframes in a clean, easy-to-read dashboard directly on your chart. Instantly capture the overall market direction in just seconds. Features Multi-timeframe VWAP analysis from M1 to MN1. Dashboard panel shows the trend state of each timeframe at a glance. Plots VWAP line and buy/sell arrows directly on the chart. Fully customizable: colors, line width, panel position, arrow symbols. Bu
FREE

Projection of Phi Is a technical indicator that calculates dynamic support and resistance levels. It uses angular geometric projections and mathematical ratios to identify market expansion ranges. Features: Dynamic Fibonacci Expansion: Extension level projection Geometric Calculation: Angular analysis and mathematical ratios Visualization: Graphical objects with informative labels Compatibility: M1 to H4 timeframes Applications: Identification of zones for trade management Analysis of volatil
FREE

Dynamic Range Pro – Indicator Dynamic Range Pro is a technical indicator designed to visualize key market zones by plotting a dynamic channel based on price extremes. Main Features: Dynamic channel calculated using the highest highs and lowest lows over a specified period. Midline representing price equilibrium. Compatible with multiple instruments and timeframes. Inputs: PeriodPR: Sets the number of bars used for channel calculation. Functionalities: Highlights potential breakouts when price mo
FREE

Trend View is a simple indicator that shows in a text the trend of the current currency in the timeframe you choose. Inputs are: Color: color of the text. Timeframe: timeframe for calculations. Trend can be: UP: bullish trend. DOWN: bearish trend. ---: trend not defined. You can use this indicator to show the main trend of a bigger timeframe helping you to choose your trades. Note: text is draggable.
FREE

MT5 to MT4 Trade Copier (Master)
SHORT DESCRIPTION Copies trades from MetaTrader 5 to MetaTrader 4 on the same PC/VPS. You also need the EA "MT5 to MT4 Trade Copier I Slave" from the Market. If you have any questions, problems, or suggestions for improvement, feel free to send me a message or leave a comment.
KEY FEATURES Market execution copying (fast, stable) Multi-symbol filter (copy only selected symbols) Symbol mapping (master symbol -> receiver symbol) Lot multiplier (scale lots on rec
FREE
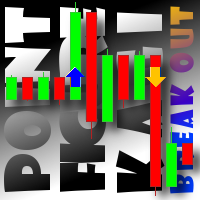
This indicator displays breakouts on Point-And-Figure-like or Kagi-like custom symbol charts, generated by special expert advisers, such as PointFigureKagiCharts . This indicator is applicable only for custom instruments generated in appropriate way (with time-invariant bars which are multiples of a predefined box size). It makes no sense to apply it to other charts. The breakouts in up or down direction are marked by arrows. The breakout price is found at crossing of one of imaginary lines of
FREE

Friends, join us!
Ask questions and connect with like-minded traders: MetaCOT Public Group
MetaCOT Information Channel: news, CFTC reports, and signals: MetaCOT Channel
Here’s to successful trading and new profitable signals for us all! Attention! Recently, certain countries have been blocking access to the cftc.gov website. As a result, users in these countries are giving the product low ratings. MetaCOT has always adhered to the highest quality standards and is in no way associated with th
FREE

MT4 version Overview The Lowess Channel indicator is a smoothed trend-following tool designed to help traders identify the direction of the trend , detect flat or ranging markets , and spot breakouts from consolidation zones. It creates a central smoothed line with upper and lower channel boundaries, adapting to market noise while maintaining clarity. How It Works The indicator builds a channel around a smoothed price line. The central line reflects the current trend. The upper and lower bounda
FREE

AUC - Super Trends は、価格の動きに基づいた視覚的なラインで市場の方向を示すインジケーターです。 このインジケーターは、価格追跡システムを使用して上昇局面と下降局面の変化を示します。ラインは市場の変動に応じて自動的に調整されます。 Forex、指数、ゴールドなどのさまざまな金融商品や複数の時間足で使用できます。 ----------------------------------------------------
機能 市場方向の可視化 価格変動の変化の識別 トレンド分析の補助
----------------------------------------------------
特徴 上昇および下降局面の視覚的表示 価格への自動適応 シンプルで分かりやすい表示 複数の時間足に対応 さまざまな金融商品で使用可能 注意
本インジケーターは分析を補助するツールであり、リスク管理や意思決定の代替ではありません。
FREE

All-in-One Dashboard for Trend, Momentum & Volatility Indicators Info Panel is a compact yet powerful MT5 tool that summarizes the most important market metrics directly on your chart.
It reads built-in MT5 indicators (no custom calculations) and displays real-time data about trend strength, volatility, momentum and multi-timeframe direction — all in one clean panel. Ideal for traders who want a fast overview of market conditions without opening multiple sub-windows. ️ Main Features Display
FREE

Advanced Quantitative Market Dashboard The Advanced Quantitative Market Dashboard is a professional-grade, multi-dimensional analytical tool designed for MetaTrader 5. Unlike traditional indicators that rely on lagging visual signals, this dashboard utilizes a Conditional Probability Engine to bridge the gap between historical market behavior and live price action. By scanning deep historical data and matching it with real-time market regimes, the indicator filters out market noise and provides
FREE

To get started, subscribe to the RealTrend Telegram channel. t.me/RealTrendFree
RealTrend is an EA that facilitates trading for expert users.
The user's aim is to identify the right business trend
and let RealTrend suggest the placement of pending orders in strategic points
where the price will retrace and then continue its trend.
RealTrend is very simple to use and includes a single user-defined stoploss input and an intuitive chart panel.
The takeprofit is placed directly by the Bot.
risk l
FREE

Grazia Matrix Pro 全時間足のトレンドを瞬時に可視化。迷いを断ち切る究極の羅針盤。 「期間限定!無料」
【こんなトレーダーにおすすめ】 環境認識に時間をかけすぎて、チャンスを逃している方。 上位足の方向に逆らったトレードで損失を出している方。 シンプルかつプロフェッショナルなチャート環境を構築したい方。 【製品概要】 「マルチタイムフレーム(MTF)分析は重要だが、チャートの切り替えが煩わしい……」 そんなトレーダーの悩みを解消するために開発されたのが Grazia Matrix Pro です。 本インジケーターは、1つのチャート上に主要な6つの時間足(M5〜D1)のトレンド状態をリアルタイムでマトリックス表示します。独自のアルゴリズムにより、移動平均線(MA)とRSIの相関関係を分析し、現在の市場が「真のトレンド」にあるのか、それとも「調整局面」にあるのかをひと目で判別可能です。 【主な機能と特徴】 6-Timeframe Matrix : M5, M15, M30, H1, H4, D1のトレンドを一画面で監視。 Perfect Order Alert :
FREE

Rhino PDF Trade Report — MT5の取引履歴をPDFにエクスポート MetaTrader 5 の口座取引履歴を、見やすく印刷可能なPDFレポートに変換します。日付範囲、取引数、または銘柄を選択して、取引日誌、パフォーマンス分析、投資家向けレポート、記録保存に使用できるレポートを作成できます。 パフォーマンス概要 1ページ目には、選択した期間の取引パフォーマンスの概要が表示されます。 パフォーマンス指標: 純損益、取引数、勝率、プロフィットファクター、期待値、総取引量。 エクイティカーブ: 対象取引の累積損益を表示します。 取引の内訳: 勝ちトレード/負けトレード、およびBUY/SELLの分布。 曜日別の結果: 曜日ごとの取引結果を確認できます。 銘柄別の結果: 異なる取引銘柄のパフォーマンスを分析できます。 完全な取引履歴 2ページ目以降には、決済済み取引の詳細な一覧が含まれます。各取引は1行で表示され、以下の情報を含みます。 ポジションチケット オープン時間とクローズ時間 銘柄と方向(BUY / SELL) 数量、エントリー価格、決済価格 ストップロスとテイクプ
FREE

The indicator draws levels based on the overbought and oversold values of the RSI indicator.
The maximum values are taken into account, which are equal to or exceeded certain limits. That is, for example, when the price has gone into the overbought zone, the highest price is selected from all prices in this zone for this period of time, and as soon as the indicator value returns to a value below the overbought value, the level is fixed and the calculation of new values begins.
The same
FREE

The M Extensions are variations of the Golden Ratio (Fibonacci Sequence). It is the World's first technique developed for Candle Projections.
Advantages:
Easy to plot. Candle anchoring; High and accurate precision as support and resistance; Excellent Risk x Return ratio; Works in any timeframe; Works in any asset / market. The M Extensions are classified into:
M0: Zero point (starting candle) RC: Initial candle control region M1: Extension region 1 M2: Extension region 2 M3: Extension regi
FREE

The indicator highlights in color the places on the chart where the price moves in one direction continuously from the selected number of candles.
You can specify the number of points from the beginning of the movement to select only movements from this amount.
It can be useful for looking for reversals or sharp impulses.
I also recommend purchasing this utility to determine local weekly / monthly trends and support and resistance lines. https://www.mql5.com/en/market/product/61401
FREE
516/5000 Average volume indicator to calculate the average volume for a given period. Useful as a filter to measure the strength of a trend, or false breaks in support or resistance.
It does not give a signal to buy or sell, it only acts as a filter to avoid entering into transactions with a drop in volume, or below-average volume, which may indicate disinterest in trading at the price level.
It has only the parameters of period, method of calculating the average and type of volume.
It h
FREE

FX Strength Dashboard ranks the Forex majors by normalized momentum strength in one simple sortable panel. It does not open trades, it does not predict, and it does not repaint. It is a clean ranking tool that shows which currency pairs are strongest and which are weakest right now. How it works. Each pair is scored from a normalized momentum reading over your chosen lookback and timeframe, mapped to a 0 to 100 strength score, and the panel lists every pair sorted from strongest to weakest, colo
FREE

This program is designed to download economic calendar news events for a specified country over a selected date range, allowing traders to analyze and incorporate important economic data into their trading strategies. By specifying both a start and end date, as well as a country code, the program retrieves relevant news events within the defined period and exports them to a CSV file for easy review and analysis. This tool helps traders stay informed about scheduled economic events that may impac
FREE

Double Correlation indicator (free) plots two windowed correlations in a separate window. the size of window is taken as input before the two symbols to correlate to. Two symbols are taken as an input parameters as well as period length. and the two correlations are computed with the currently shown symbol ex: input GBPJPY and AUDNZD. current symbol EURUSD then the following will be computed corr(EURUSD,GBPJPY) and corr(EURUSD,AUDNZD) The indicator can be useful to run a multi-symbol pair trad
FREE

Simple Calendar Events is an indicator that will mark important Important Economy Events on your chart. For example, if you are trading something that is USD based, you would like to know when some important events are coming, you can expect some volatility or some different Price action, so you can base your strategy on it. If you trade something that is country based you can also choose that, and it will show you when the event is, so you can be prepared for it. When you hover with the mouse
FREE

The TradeQL Indicator is a customizable tool that highlights specific trading patterns on candlestick charts. Users can define patterns through TradeQL queries, which the indicator then applies to the chart, visually representing matches and captured groups. Ideal for identifying complex trade setups in real-time.
TradeQL queries are specified using the TradeQL Language. See https://github.com/abdielou/tradeql for more details. This language is expressed as a regular expression. The language al
FREE

Session Bias This Strategy of bias useful for those who follow TRADESHARE on youtube. This script is designed by BokaroTraderFx for traders who want assistance in determining their session bias, particularly for those who trade within sessions typically represented by a single 4-hour candle. The method involves using price action to establish a daily bias, guiding decisions on whether to focus on buys, sells, or both. The analysis is based on the previous daily and 4-hour candle closes, fo
FREE
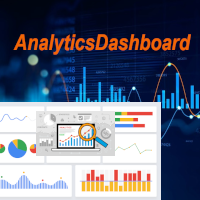
アナリティクスダッシュボードは、過去と現在の取引を分析し、詳細ビューとして円グラフを追加した分析ダッシュボードを作成するインジケーターです。
分析は主に4つのカテゴリーに分けられます。1)パフォーマンス指標、2)取引行動指標、3)約定品質指標、4)ポジションレベル指標です。
これら4つの一般的な分析指標は、さらに以下のように具体的な指標に分類されています。
パフォーマンス指標:
粗利益 粗損失 全体利益率 全体期待値 全体勝率 平均リスクリワードレシオ 最大ドローダウン 最大ランアップ これらすべてについて、円グラフを用いたチャート形式の指標表示も可能です。
取引行動指標:
総取引数 総勝ち数 総損失数 平均ホールド時間合計 平均取引サイズ SL到達により停止された取引総数 TP到達により停止された取引総数 手動ストップ注文合計 これらの指標は、平均取引サイズを除き、チャート形式でも表示されます。
約定品質指標:
平均スリッページ 平均エントリースプレッド 平均エグジットスプレッド 合計手数料 + スワップ手数料 粗利益への影響 粗損失への影響 これらの指標は、チャー
FREE

Rectangle Editor – Control total sobre tus zonas Rectangle Editor es una herramienta avanzada diseñada para traders que utilizan zonas, bloques o áreas de interés en su operativa. Permite , editar y gestionar rectángulos directamente en el gráfico de forma rápida, precisa y profesional. El indicador facilita la manipulación de objetos rectangulares en el gráfico, permitiendo: Dibujar zonas de oferta y demanda Marcar Order Blocks Delimitar Fair Value Gaps (FVG) Definir zonas de ent
FREE

This utility allows creating any amount of grid orders just by clicking with the mouse.
Instructions:
Trading mode
Deleting mode
Press ctrl and click with mouse to start drawing a grid While drawing, press shift to cancel Release buttons to send orders
Press shift and click with mouse to draw a removal line
Release buttons to confirm removal: EA deletes every pending order that the line touches
Inputs: - 3 options to calculate the grid sizing: Fixed points distance between grid level
FREE

EEFX Trade Manager is a practical trade management utility for MetaTrader 5, designed to make manual trading faster, clearer and easier to control directly from the chart. Instead of navigating through multiple MT5 windows, Trade Manager brings the key execution and position-management functions together into one simple interface. It can be used by discretionary traders as well as traders who want additional manual control over positions opened by other Expert Advisors. Main Features https://eef
FREE

Ratio X Trend Watcher – Advanced Trendline Breakout Indicator Learn More about Ratio X Systems:
Source code and compiled EA: Reasons why the .mq5 file changes everything. Integrated MQL5 message filters: How to protect professional operating systems without DLLs? How can you build your own expert advisor (EA) brand using white-label trading software? MQL5 programming methods with ChatGPT and Claude Code (no development knowledge required) You will have unlimited access to all source code (.mq5)
FREE

Force Index MTF は、古典的なフォースインデックス(Force Index、勢力指数)オシレーターの高度な実装であり、マルチタイムフレーム(MTF, Multi-Timeframe)機能を強化したものです。価格変動と出来高の積を計算することで、市場変動の背後にある生の力を定量化し、トレーダーが重要なトレンド継続と小さな押し目を見分けるのに役立ちます。
モメンタム・出来高オシレーターとして、Force Index は買い手と売り手の強さを測定します。正の値は買い圧力の優勢(蓄積、accumulation)を示し、負の値は売り圧力の優勢(分散、distribution)を示し、ゼロラインのクロスは市場の主導権が変化する可能性を示唆し、しばしば押し目・戻りの終わりを識別するために使われます。
本インジケーターには独立した MTF エンジンが搭載されており、ウィンドウを切り替えることなく、任意の上位時間足(HTF)の Force Index データを現在のチャート上で直接監視できます。デュアルモードの感度を提供します。短い期間(例:2)は感度が高く、日中取引での短期的な押し
FREE
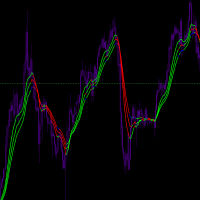
Input Parameters JawPeriod (default=9): Period for the blue line JawShift (default=0): Shift for the blue line TeethPeriod (default=7): Period for the red line TeethShift (default=0): Shift for the red line LipsPeriod (default=5): Period for the green line LipsShift (default=0): Shift for the green line Signals Bullish Conditions When price moves above all lines (all lines turn Lime) Potential buying opportunity Confirms upward momentum Bearish Conditions When price moves below all
FREE

MAD Bands(Moving Average Deviation Bands) MAD Bands は、価格に対するボラティリティの挙動を移動平均との関係から視覚的に確認したい場合に利用することを想定しています。
MAD_Bands (MQL5版) パラメータ解説 このドキュメントでは、各設定項目(Inputパラメータ)について、MT5のパラメータ入力画面を解説します。 Group: Main (基本設定) Period 初期値 : 20 解説 : 移動平均線(Mid)やバンド幅の計算に使用するローソク足の本数です。数値を大きくすると線が滑らかになりますが、反応は遅くなります。 Shift 初期値 : 0 解説 : インジケータの描画位置を左右にずらします。通常は 0 です。 Center Method 初期値 : EMA 解説 : 中心線(Midライン)の計算ロジックを選択します。 SMA : 単純移動平均 EMA : 指数平滑移動平均(直近重視) WMA : 加重移動平均 SMMA : 平滑移動平均(長期目線) ZLMA : ゼロラグ
FREE

Push Notif for Mobile Trading
(Now you can trade perfectly through notifications to your Mobile Gadget, with Signals that you can adjust to your trading style, Use VPS to activate real time trading)
Description Push Notif for Mobile Trading is a custom MetaTrader 5 (MT5) indicator designed to send mobile push notifications to traders when certain price or indicator-based conditions are met. This allows traders to monitor markets remotely and act quickly, even when not at their trading terminal.
FREE

STO & ZeroMaxシステム:正確な決済と最大限の利益を実現する革新的なアルゴリズム 市場の急落時に利益を失ってしまうことにうんざりしていませんか?早すぎる決済ではなく、最大の勢いを捉えるためにトレードを決済するタイミングを推測することに疲れていませんか?
ZeroMaxプロフェッショナルトレーディングシステムの一部である、高精度なベースメントフェーズ&モメンタムオシレーター「STO」をご紹介します。この次世代分析ツールは、金(XAUUSD)のようなボラティリティの高い資産において、利益確定と反転ポイントの特定に絶対的な精度を求めるトレーダーのために設計されています。
STOインジケーターの秘密とは?
STOの最大の特徴は、モメンタムの減衰を正確に追跡し、買われすぎと売られすぎの状態を正確に検出できることです。多くのトレーダーは感情に流され、損失を被る調整局面に留まったり、早すぎる決済をしてしまう傾向がありますが、STOは理想的な決済のための明確な数学的シグナルを提供します。
このインジケーターは市場の局面変化に瞬時に反応し、価格が急激な反落に入る前に、動
FREE

TRADE WITH MAGIC – Professional One-Click Trading Panel
| Crystal AI Systems
Trade With Magic is a fast, lightweight, and highly efficient one-click trading panel designed for traders who require precise manual execution and full control over magic numbers, comments, and risk parameters. It is suitable for both manual trading and advanced EA testing environments where ac
FREE

Introduction:
The RosMaFin Trading Panel is not just a standard order execution tool. It is a comprehensive, professional assistant designed for manual and price-action traders who want to save time, manage risk with mathematical precision, and maintain full market awareness. Say goodbye to manual lot size calculations and tedious Stop Loss adjustments. This panel streamlines your entire trading workflow from analysis to trade exit. KEY FEATURES & BENEFITS: Advanced Risk Management & Exec
FREE
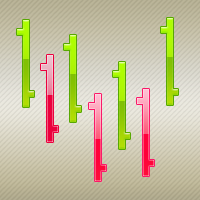
The ColorBars Indicator paints bars with different colors depending on the volume changes. If the volume has increased, the color is green, overwise the color is red.
FREE

MOST PROP ACCOUNTS DON'T DIE FROM BAD STRATEGIES. THEY DIE FROM BAD DAYS.
The Prop Firm AI Assistant is a professional monitoring dashboard that protects your funded account from the three killers: drawdown breaches, toxic market conditions, and your own emotions.
=== WHAT IT DOES === • CIRCUIT BREAKER — Tracks daily loss & max drawdown exactly like prop firms do. When a limit is hit, it warns you or closes everything instantly. • GROWTH ADVISOR — Tells you your exact risk per trade, your s
FREE

Phoenix Vision v2.1: Professional Description Phoenix Vision is a high-performance Heads-Up Display (HUD) and Algorithmic Pattern Scanner for MetaTrader 5. It is engineered to condense complex price action into a single, draggable command centre, providing traders with an "X-ray" view of market sentiment. Key User Benefits Draggable Intelligence: The HUD can be moved anywhere, ensuring your main price action area remains clear while keeping vital data in sight. Automated Pattern Detection: Scan
FREE
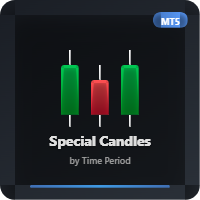
This indicator allows you to observe candle formation over a specific period, such as the Nasdaq, which starts at mid-hour. For example, for the first hour. The distance and size of the candle positioned on the right side can be adjusted. Color can also be assigned based on falling and rising candles. The needle can be made visible or invisible if desired. The body size can also be adjusted as desired.
FREE
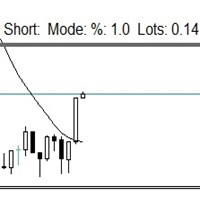
この小さなツールは、チャート上で線をドラッグするだけでリスク管理を定義するのに役立ちます。アカウント%または固定金額に基づいて計算された実際のロットサイズがラインで直接表示されます。
キーボードの「t」キーを押してラインをアクティブにし、ラインをストップロスポイントまでドラッグするだけです。それでおしまい。
設定では、線とテキストの色と幅、行と右側のテキストのスペースを定義でき、リスクを口座または固定金額のパーセントで設定できます。
ご質問やご希望がございましたら、お気軽にお問い合わせください。
この小さなツールは、チャート上で線をドラッグするだけでリスク管理を定義するのに役立ちます。アカウント%または固定金額に基づいて計算された実際のロットサイズがラインで直接表示されます。
キーボードの「t」キーを押してラインをアクティブにし、ラインをストップロスポイントまでドラッグするだけです。それでおしまい。
設定では、線とテキストの色と幅、行と右側のテキストのスペースを定義でき、リスクを口座または固定金額のパーセントで設定できます。
ご質問やご希望がございましたら、お気軽にお問
FREE

Position Guard automatically manages your open positions on MetaTrader 5. It does not open trades and makes no market prediction - it is a money- and risk-management layer on top of manual trades or trades opened by another EA. Features: - Breakeven: move the stop to entry (with a spread-safe offset) after a set profit in pips. - Staged partial close: take partial profit at up to three configurable profit levels. - Trailing stop: starts after a set distance, then trails with a configurable step.
FREE

SMC Donchian PD Overlay Signals The SMC Donchian PD Overlay Signals indicator for MetaTrader 5 offers a sophisticated and visually intuitive way to analyze market dynamics. It combines a multi-timeframe Donchian Premium/Discount overlay with a powerful theme engine and de-duplicated signal arrows, providing a comprehensive solution for discretionary traders. Note: This overlay uses external DKTB signals from the “SMC Donchian Trend Breakout” indicator to draw arrow signals. Without that indicat
FREE

Overview Copy Trades Master is a high-performance local signal broadcaster for MetaTrader 5. It tracks active positions on your master account in real time and streams execution data directly to one or multiple SlaveCopier terminals running on the same PC or local network via ultra-fast local file IPC ( FILE_COMMON ). https://www.mql5.com/en/market/product/189485 Key Features Local Common-File IPC: Uses local file streaming ( MQL5\Files ) for near-zero latency execution without requiring externa
FREE
Volatility Distance Indicator The Volatility Distance Indicator measures in real time the distance between current price and the moving averages you choose, expressed in points . Its purpose is to provide a clear, objective, and quantitative view of the market’s expansion relative to its equilibrium zones , allowing you to instantly assess whether price is in a phase of overextension, compression, or neutrality . Key Features: Point-based measurement: displays the exact distance between current
FREE

Confluence Signal Engine (MT5 Indicator) A powerful multi-indicator confluence tool that analyzes market conditions using EMA trend, RSI, MACD, Stochastic, ADX, Bollinger Bands, Volume, and candlestick patterns to generate high-confidence trading signals. It filters trades using: Minimum indicator agreement (confluence) Market session quality Multi-timeframe confirmation Risk-to-reward validation (ATR-based SL/TP) The indicator provides: Real-time dashboard with signal strength (%) Early alerts
FREE
Clean Reversal Signals is a clean and efficient visual tool designed to highlight when price touches the upper or lower extremes of a Donchian channel (120 periods) — zones that are often critical for potential reversals or price reactions. This indicator does not generate buy or sell signals and should not be used to enter trades by itself . As the name implies, it’s an indicator — its job is to indicate , not confirm. Use it as an extra layer of confirmation within your own trading strategy .
FREE

News Indicator. Shows the interest rate of 12 countries (Australia, Brazil, Canada, Mexico, euro zone, UK, India, New Zealand, Switzerland, United States, South Korea, Japan). It will help to analyze the impact of the interest rate on the exchange rate. It makes sense to set an indicator on large timeframes. To improve the information content, it makes sense to change the settings style of the indicator of the desired country, so that the line stands out from the total mass of indicators, as ind
FREE

FREE

PEAK MASTER LITE – PRECISION RESISTANCE NAVIGATOR
Peak Master Navigator is a non-repainting technical indicator designed to accurately identify and visualize structurally confirmed resistance levels in real time.
It detects valid swing highs based on market structure confirmation rules, ensuring that only meaningful and reliable resistance points are displayed on the chart. By filtering out weak or premature highs, Peak Master Navigator helps traders focus on true price reaction zones , improvi
FREE
マルチタイムフレーム対応、カスタマイズ可能なビジュアルシグナル、設定可能なアラートシステムを備えたForce Indexインジケーター。
フリーランスのプログラミングサービス、アップデート、その他のTrueTL製品は MQL5プロフィール でご利用いただけます。
フィードバックとレビューを大変感謝いたします!
Force Indexとは? Force IndexはAlexander Elderによって開発され、価格の方向性、価格変動の大きさ、出来高を組み合わせて価格動向の背後にある力を測定します。今日と昨日の終値の差に、その期間の出来高を掛け合わせ、移動平均スムージングを適用することで計算されます。 正のForce Index値は買い圧力(強気派が優勢)を、負の値は売り圧力(弱気派が優勢)を示します。短期のForce Indexはトレンド内の調整での参入ポイントの特定に使用し、長期のものは主要な転換点を特定します。ゼロラインのクロスはトレンド方向の変化を確認します。 機能: 出来高統合モメンタム計算 スムージング用の設定可能なMAメソッド(SMA、EMA、SMMA、LWMA) 矢
FREE

Confluence Scope consolidates four classic signal engines across up to nine timeframes into a single horizontal panel. It helps identify when momentum, strength and CCI alignment converge on the same direction. FEATURES - Four engines per timeframe: Stochastic, RSI, fast CCI entry, slow CCI trend - Nine timeframes from M1 to MN1, each independently toggleable - Per-timeframe verdict from MIXED up to four-star BUY or SELL - Adaptive panel that scales with the subwindow width - Native popup,
FREE

Initial Balance Pro – Institutional Opening Range Professional MT5 Indicator
Trade Like Institutions
Initial Balance Pro automatically identifies the Institutional Initial Balance (IB), Opening Range and key market session levels used by professional traders.
Designed for MetaTrader 5, the indicator provides precise reference zones for brea
FREE

A prop-firm account runs under a second rulebook MetaTrader 5 knows nothing about: a maximum loss measured from a fixed starting balance, a daily limit that resets at an hour the broker's clock does not agree with, a payout consistency ceiling, a minimum number of trading days, a news blackout, a Friday cutoff. Break the first rulebook and you lose a trade. Break the second and you lose the account. PropFirm Defense watches all of them at once, on any account, next to whatever else you are runni
FREE

Wilder Trend Indicator (MT5) The Wilder Trend Indicator is a clean and lightweight trend-following tool based on Wilder’s Moving Average smoothing method .
It visually highlights market direction by separating uptrend and downtrend movements directly on the price chart. The indicator is designed to be simple, flexible, and non-intrusive , making it ideal for discretionary traders who want clear trend confirmation without cluttering the chart. Key Features Uses Wilder-style smoothing for st
FREE

Trarity Analytics is a professional trading journal and performance workspace - built by traders, for traders. Need help getting started? Check out our tutorial .
With seamless MT5 integration, your trades are imported automatically - including auto-screenshots for every execution - so you spend less time journaling and more time improving. Trading Journal Auto-import via MT5 + clean trade history sync Auto-screenshots for every execution (faster review, full context) Add notes, tags, and setu
FREE
MetaTraderマーケットは、開発者がトレーディングアプリを販売するシンプルで便利なサイトです。
プロダクトを投稿するのをお手伝いし、マーケットのためにプロダクト記載を準備する方法を説明します。マーケットのすべてのアプリは暗号化によって守られ、購入者のコンピュータでしか動作しません。違法なコピーは不可能です。

取引の機会を逃しています。
- 無料取引アプリ
- 8千を超えるシグナルをコピー
- 金融ニュースで金融マーケットを探索