 MetaTrader 5
 エキスパート
 インディケータ
 ライブラリ
 ユーティリティ
 ウィジェット
 ルール
YouTubeにあるマーケットチュートリアルビデオをご覧ください
ロボットや指標を購入する
仮想ホスティングで
EAを実行
EAを実行
ロボットや指標を購入前にテストする
マーケットで収入を得る
販売のためにプロダクトをプレゼンテーションする方法
MetaTrader 5のための無料のエキスパートアドバイザーとインディケータ - 95
 自動売買ロボットとインジケータを使用して、外国為替取引の収益性を高めます。 自動売買ロボットを使用すると、取引の開始と終了を自動化でき、インジケータは市場の行動をより正確に予測するのに役立ちます。
このページには、MetaTrader5アプリケーションのカタログが掲載されています。

ROMAN5 Time Breakout Indicator automatically draws the boxes for daily support and resistance breakouts. It helps the user identifying whether to buy or sell. It comes with an alert that will sound whenever a new signal appears. It also features an email facility. Your email address and SMTP Server settings should be specified in the settings window of the "Mailbox" tab in your MetaTrader 5. Blue arrow up = Buy. Red arrow down = Sell. You can use one of my Trailing Stop products that automatical
FREE

Native Spread Monitor answers a simple question: is the spread you are being charged right now normal for this hour of the day, or are you about to overpay? Every free spread tool shows the CURRENT spread. None of them show what is typical for this hour, because MetaTrader 4 never kept per-bar spread history. MetaTrader 5 does, and this indicator uses it.
HOW TO USE IT
1. Drag the indicator onto any chart. A panel appears in the bottom-left corner (you can move it to another corner in the set
FREE

The indicator highlights the points that a professional trader sees in ordinary indicators. VisualVol visually displays different volatility indicators on a single scale and a common align. Highlights the excess of volume indicators in color. At the same time, Tick and Real Volume, Actual range, ATR, candle size and return (open-close difference) can be displayed. Thanks to VisualVol, you will see the market periods and the right time for different trading operations. This version is intended f
FREE
ZigZag Reversal Detector Signals This is a technical indicator based on the ZigZag principle, designed to automatically detect market reversal points and generate clear buy and sell signals. Customizable Parameters ️: Level : Determines the sensitivity of the ZigZag to price changes. Ecart : Sets the minimum distance between two ZigZag points. Rebond : Adjusts the confirmation threshold for a reversal. Alerts & Notifications : Enable or disable according to your needs. Pe
FREE

Free prop firm rules monitor for MetaTrader 5: daily loss limit, maximum drawdown and the open risk of all your stop losses on one read-only panel. It shows how much money is left before the daily-loss rule and the maximum-loss rule, and whether your open stop losses would break a rule if they were all hit.
It never opens, modifies or closes a trade. It runs as an Expert Advisor only because it uses the terminal's own profit calculation for every open position, which indicators are not allowed
FREE
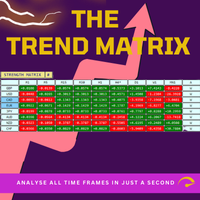
Trend Teller は、すべての主要通貨ペアと全時間足(M1 から MN1)にわたる市場トレンドを一目で把握できる、パワフルで直感的なダッシュボードツールです。
トレーダーによって、トレーダーのために作られたこのツールは、トレンド分析の迷いを排除し、市場の全体像に沿ったトレードを可能にします。 初心者トレーダーの多くが市場の方向性を判断するのに苦労しており、実はプロトレーダーでさえも見誤ることがあります。 だからこそ、Trend Teller はすべてのレベルのトレーダーに最適です。 主な機能: マルチタイムフレーム分析
全時間足にわたって、主要通貨ペアのトレンドの強さと方向性を瞬時にスキャン。スキャルピングからスイングトレードまで、あらゆるスタイルに対応。 カスタマイズ可能な表示
情報が多すぎる?問題ありません。値のみの表示、色付きシグナル、特定の時間足の非表示など、自由に調整可能。 通知機能付き
ずっと画面を見ている必要はありません! 強いトレンドやトレードアイデアが出現したときに通知を受け取り、最適なタイミングで行動できます。 初心者にもプロにも最適
トレンドの方向性を知る
FREE

インストールの前に:このツールにできないこと。 まずこちらをお読みください。以下のいずれかを目的としてお越しの場合、このツールは目的に合いません。チャートに載せる前に知っておく方が良いはずです。
- 仮想ストップや隠しストップは一切ありません。 すべてのストップはブローカーのサーバーに置かれる本物のストップであり、ブローカーにもプロップファームにも見えます。設計上、どちらに対しても何も隠しません。 - 1チャートにつき1銘柄。 無料版は、適用したチャートの銘柄のみを取引します。余力(ヘッドルーム)の試算は、このパネル自身が当該銘柄で行う取引のみを対象とします。複数銘柄を同時に取引する場合、試算は口座全体を把握できません。これは1チャート型ツールの実際の能力上の制限であり、意図的に無効化された機能ではありません。 - ストラテジーテスターでの取引は不可。 クリック式パネルはテスター内で意味のあるクリックができません。パネルは描画されるだけです。 - Risk Sentinel や Prop Guardian と同一チャートには置けません。 MetaTrader 5 は1チャートにつき
FREE

1年間のレンタルなら、月額わずか$1.67でフルアクセスをご利用いただけます。 これは、Trading Statistics、Auto Reports、Price Alerts、およびTrade Notificationsを1つの最新Telegramモニタリングシステムに統合した、プロフェッショナル向け多機能ユーティリティです。 このユーティリティは、 Telegramチャンネルから /menu コマンドを使用して直接リモート操作 することをサポートしています。MetaTrader 5 ターミナルに戻ることなく、Trade Reports の送信、オープンポジションの確認、Price Alerts の作成・削除・管理を行えます。 スケジュールされた自動Telegramレポートに対応しているほか、 Daily / Weekly / Monthly / Yearly / All Time の各期間の Trade Reports をTelegramから手動で送信することもできます。 このユーティリティには、 Dark/Light テーマ対応の最新インタラクティブコントロールパネル、柔軟な取
FREE

APT – Advance Pivot Trader Indicator for MetaTrader 5 APT – Advance Pivot Trader is a technical indicator developed for MetaTrader 5.
The indicator is based entirely on mathematical and algorithmic calculations and is designed to analyze market structure using pivot-based logic. Professional Trading Tools for Every Trader: https://www.mql5.com/en/users/royalcrescent777/seller
Join our Community & Signal channels: https://www.mql5.com/en/channels/xauusd-signal Timeframe and Risk Guidance The in
FREE

Top Stocks Mini: Science-Based Algorithmic Trading A Quantitative System Grounded in Academic Research Top Stocks Mini is not just another EA. It's an institutional-grade trading system designed for medium/long-term investors seeking a methodical approach to equity markets with first-class performance. Our entry-level product, ideal for familiarizing yourself with quantitative momentum strategies. The Core System: The MAD Score (Momentum-Adjusted Direction) Our methodology is based on r
FREE
In the world of finance, correlation is a statistical measure of how two securities move in relation to each other. Correlations are used in advanced portfolio management. This indicator measures how different securities move in relation to a reference one, thus making portfolio management easier. [ Installation Guide | Update Guide | Troubleshooting | FAQ | All Products | Get Help ] Avoid concurrent trades in highly correlated instruments Find trading opportunities among highly correlated
FREE

Input Description The indicator provides flexible options to display trading history directly on the chart, including: Days to show Profit
Displays only trades executed within the last X days from the current time. Font Size
Allows selecting the font size used to display trade information on the chart. Show Volume
Enables or disables the display of trade volume for each position. Show Currency
Enables or disables the display of the currency unit for profit values. Color for Win Trade
Sets t
FREE

Multi-period Parallel Random Oscillator 1. Main chart cycle main line and signal line 2. 15M 30M 1H fixed cycle signal line Mainly used to observe the overbought and oversold conditions of other cycles in the same chart。 Its main function is to identify moments of multi-cycle resonance, enabling you to better grasp opportunities for buying and selling points.
FREE

The indicator shows your profit and loss (PnL) for the current day right on your trading chart. Anchored at the top-right corner, it displays "PnL: [amount]"—green if you’re up, red if you’re down, white if it’s zero. Every time you close a trade, it updates instantly, adding up your profits, commissions, and swaps from all buys and sells trades since midnight. No fuss, no extra charts—just real-time feedback on how your day’s going.
FREE

MT4/5通用交易库( 一份代码通用4和5 ) #import "K Trade Lib5.ex5" //简单开单 long OrderOpen( int type, double volume, int magic, string symbol= "" , string comment= "" , double opprice= 0 , double sl= 0 , double tp= 0 , int expiration= 0 , bool slsetmode= false , bool tpsetmode= false ); //复杂开单 void SetMagic( int magic, int magic_plus= 0 ); void SetLotsAddMode(int mode=0,double lotsadd=0); long OrderOpenAdvance( int mode, int type, double volume, int step, int magic, string symbol= "" , string comm
FREE
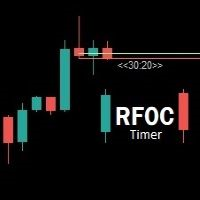
Uma informação de grande valor para o trader se localizar no tempo é a informação de quanto tempo temos para o encerramento do candle atual ou quanto falta para a formação de um novo candle. O RFOC Timer apresenta esta informação de forma clara e alocada à direita do candle atual. Adicionalmente o RFOC Timer acompanha a opção de inclusão das linhas de preços ASK e BID com e sem extensão a direita e/ou esquerda. Esta função auxilia, por exemplo, a não sobreposição das linhas de ASK e BID com as
FREE

The POC_Levels indicator calculates and displays the 3 most frequently occurring price levels (Points of Control – POC) based on historical candles. It is useful for identifying areas of high market interest (like support/resistance zones) across any timeframe. How It Works
The indicator analyzes the last LookbackBars candles. It counts how many times each price level (based on the selected price type) appears. Then it selects the top 3 most frequent prices and draws horizontal lines at those l
FREE
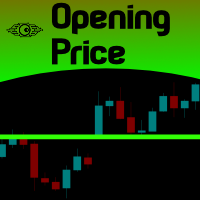
For those Price Action traders who love to trade strong Price points, like today's Opening Price (or even yesterday's Price), here is an indicator to ease the identification of those values, drawn directly on your chart! Opening Price will automatically draw a line showing you this point for you, AND, if you like any OPENing price in the past, not just today's price. A must-have in your Price Action toolbox!
SETTINGS
How many past days do you want to be drawn? Do you want to draw the current da
FREE
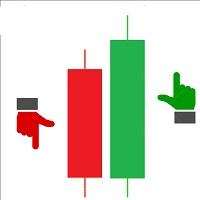
Maximum Minimum Candle indicator is a basic indicator (but useful) that shows the highest and lowest candle in a period of time .
The indicator shows the maximum candle and the minimum candle for a defined period of time. You can choose the number of candles that make up the period The indicator will show with color points the maximum and minimum values. A message tells you when the price reaches the maximum or minimum.
Parameters number_of_candles: It is the number of candles that will be c
FREE

SMC Donchian CandleBlend The SMC Donchian CandleBlend for MetaTrader 5 is a powerful indicator that simplifies your chart analysis by coloring candles based on a fusion of signals from two powerful indicators: the "SMC Donchian Trend Breakout" and the "SMC Donchian Fusion ZigZag". This provides a clear and immediate visual representation of market sentiment, helping you to make more informed trading decisions. Key Features: Fused Signal Logic: The indicator intelligently combines signals from t
FREE

Path of Candle Stick (Version.2) — Advanced Multi-Bollinger Band Volatility Navigator. "Not flawless, but priceless in purpose."
*** Push notifications are now available in this second version. "เปิดใช้งานระบบแจ้งเตือนแบบ Push notification แล้วในเวอร์ชันที่สองนี้"
Path of Candle Stick - The Quad-Bollinger Band Signal for MT5. *** Stop guessing where the next candle will close! *** Stop trading inside messy, cluttered charts! Maps out the exact mathematical corridors of the market using
FREE

Introduction:
The RosMaFin Trading Panel is not just a standard order execution tool. It is a comprehensive, professional assistant designed for manual and price-action traders who want to save time, manage risk with mathematical precision, and maintain full market awareness. Say goodbye to manual lot size calculations and tedious Stop Loss adjustments. This panel streamlines your entire trading workflow from analysis to trade exit. KEY FEATURES & BENEFITS: Advanced Risk Management & Exec
FREE

Introducing the "Super Trend Filter Oscillator," your ultimate trading companion designed to enhance your technical analysis and help you make informed decisions in the financial markets. This innovative oscillator is crafted to provide valuable insights into market trends and price movements, assisting traders like you in identifying potential entry and exit points. Features: Trend Identification: The Super Trend Filter Oscillator excels in detecting prevailing market trends, whether they are b
FREE

Made for Educational purposes. Check the YouTube video for full details. This is a simple RSI mean reversal strategy using the RSI 2 made popular by Larry Connors. It's been updated using some machine learning. How to use: Add to daily SP500 chart. IMPORTANT. Change name of subchart to the name of SP500 your broker uses.
What this strategy does It buys when price drops hard, but only if interest (volume) is picking up — then sells after a strong bounce. Entry (when it buys) 1. RSI(2) < 10 P
FREE

FT WISO — Where Is Stop-Out?
FT WISO is a free MT5 planning utility that visualizes estimated Stop-Out price levels before entering a trade. Move the orange START line to any price on the chart. The indicator instantly draws estimated Stop-Out levels for the selected leverage values: Blue levels below START for long scenarios Red levels above START for short scenarios Clear labels with leverage, price distance in percent, and distance in points FT WISO is designed for traders who want to quickl
FREE

After downloading, message me via MQL5 inbox to receive your FREE User Kit - setup guide, practical checklist, and workflow resources built specifically for XAUUSD traders. If you've been trading Gold long enough, you already know the drill. Before the session opens, you pull up the chart and start looking for the same levels you've been marking every week: previous week high, previous week low, the midpoint, and yesterday's high and low. You draw them manually, label them, and keep an eye on t
FREE

Professional Drawdown Monitoring & Risk Alert System Drawdown Sentinel is free a specialized utility designed for traders who need real-time monitoring of their account exposure and drawdown levels. This version focuses on providing instant awareness , allowing you to stay informed about your risk status without the need for automated intervention. It is essential for all traders who use commercial 'risky' EAs that may not have been thoroughly tested or which use dangerous martingale or grid
FREE

プロップファームや個人のリスク管理ルールは、通常、特定のドローダウン指標(多くの場合、固定時刻にリセットされる日次制限)に基づいて構築されていますが、取引中は、その制限に対して自分がどの位置にいるのかを見失いがちです。
Phoenix Drawdown Meterは、変動ドローダウンや過去最大ドローダウンではなく、取引日の開始時点(深夜0時にリセット)の口座残高に対するドローダウンの割合を追跡するため、画面に表示される数値は、実際の日次リスクルールで最も一般的に使用されている指標と一致します。
リスクを可視化する仕組み
- 深夜0時の残高に基づく日次ドローダウン率のリアルタイムゲージ
- 自身のリスク制限に合わせた3つの設定可能な閾値(緑/黄/赤)
- 針の動きが平滑化されているため、ティックごとの変動で数値が不規則に跳ね上がることはありません
- ドローダウンが赤ゾーンに突入した際にアラートを発信(クールダウン時間は設定可能)
「Phoenix Drawdown Meter」の活用方法:
- 1日のドローダウン制限に対する状況を一目で常に確認できる
FREE

Helios Smart Position Manager 概要 Helios Smart Position Manager は MetaTrader 5 向けのプロフェッショナルなトレード同期ツールです。いずれかのポジションのストップロスまたはテイクプロフィットを変更すると、EAが自動的にその変更を検出し、同一シンボルの他のすべてのポジションに適用します。これにより、各ポジションを個別に手動で更新する必要がなくなり、同一銘柄で複数のポジションを管理する際の時間の節約とミスの防止が実現します。 仕組み EAはすべての未決済ポジションを継続的に監視し、現在のストップロスおよびテイクプロフィットのレベルのスナップショットを保持します。いずれかのポジションのSLまたはTPが変更されたことを検出すると、同一シンボルの他のすべてのポジションを特定し、同じ変更を自動的に適用します。同期は一度に一つの変更を処理し、競合を防ぐために内蔵のクールダウン期間を設け、同期ループを避けるために直前に変更したポジションはスキップします。 ストップロスとテイクプロフィットの変更はそれぞれ独立して検出されます。スト
FREE

Auto-Shutdown MT5 Terminal - Saves you from Over-Trading by automatically closing MT5 Termial when daily loss limits are breached Love it? Hate it? Let me know in a review! Feature requests and ideas for new tools are highly appreciated. :)
Try "The AUDCAD Trader":
https://www.mql5.com/en/market/product/151841 ️ Your Automated Discipline Enforcer "I'll just make back what I lost..."
"One more trade to break even..."
"I can't end the day red..."
Sound familiar? These thoughts have d
FREE
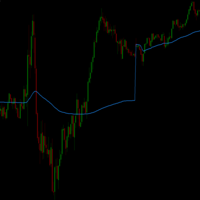
VWAP_PC_MQL5 — a simple home-built VWAP indicator showing real-time volume-weighted price levels directly on your MT5 chart. TF:
Works on all timeframes. Pair:
Compatible with all symbols — Forex, indices, commodities, and stocks. Settings: Applied Price – price type used for VWAP calculation (Close, Typical, Weighted, etc.) Line Color / Width / Style – customize VWAP line appearance Session Reset – optional reset per day or continuous mode How it works (VWAP principle):
VWAP (Volume Weighted
FREE

トレーダーなら誰もが知っているお決まりの手順があります。インジケーターの設定を開き、数字を変え、OK を押し、チャートを目を細めて眺め、違うと判断して、また設定を開く。Relative Vigor Index で設定する数字は期間ひとつだけですが、自分の銘柄で 10 と 14 を比べたくなるたびに、その一度のダイアログ往復が「変えては睨む」サイクルを毎回強いてきます。RVI Live Tuner はそれを終わらせます。 これは チャート上でリアルタイムに 調整できる、古典的な 2 ライン構成の RVI(RVI とその Signal)です。チャート上には期間スライダー付きの小さなパネルが表示されます。ドラッグすれば、見ているその場で 2 本のラインが即座に再計算・再描画されます。「10 か 14 か」の疑問は、フォーラムのスレッドではなく自分のチャート上で数秒で解決します。 ラッパーではない、本物の RVI。 本インジケーターは教科書どおりの計算を自前で実装しています。4 本のバーに対称加重をかけた close-to-open の値動きと high-to-low のレンジを、それぞれ期間
FREE

MT5 Visual Theme Indicator – Clean Chart and Full Customization Enhance the appearance of your charts in MetaTrader 5 with this fully customizable visual indicator, designed to provide a clean, modern, and easy-to-read trading environment. This indicator does not generate signals or open trades. Its sole function is to optimize chart visualization to help you analyze the market with greater clarity. If you find this useful, please leave a 5-star rating and follow me for future tools, indicators,
FREE

ある足の終値と次の足の始値の間の価格ギャップを表示します。未充填のギャップは価格が埋めるまで伸びるボックスで描画され、埋まったギャップは非表示にできます。 主な機能 確定足で計算され、値はリペイントしません あらゆるシンボルと時間足で動作 すべての期間、レベル、色は入力パラメータで変更可能 最大バー数の設定によりリソース消費が軽量 インジケーターを削除するとオブジェクトは自動的に削除されます 入力パラメータ ギャップ: 最小ギャップサイズ(ポイント)、検索するバー数、埋まったギャップを表示、ギャップアップの色、ギャップダウンの色。 表示: 計算する最大バー数。 注意 これは分析ツールです。トレードは行いません。 ご自身の戦略に合わせたカスタマイズや、フィルターとアラートを追加した上位版が必要ですか?MQL5でプライベートメッセージをお送りください。見積もりをご返信します。
FREE

Market Sessions HUD Pro turns any chart into a clear, professional session map. See exactly which market is open, how far it has moved, when the next one opens — plus elegant session zones with a fully configurable opening range. Built to look great on any broker and any timeframe, with real Daylight Saving handling so your sessions are always on time. Real-time HUD panel Active session name in its own color, with a live server clock Session progress bar (% elapsed) and countdown to the next
FREE

This is not an EA – it’s a simple and powerful MT5 indicator designed to help you manage trades quickly and easily. Key Features: TP1 Auto-Set – Fixed at 1RR TP2 Auto-Set – Set at 2RR Fast Lot Calculation – Calculates lot size based on SL in 1 second Quick Actions: Close All Trades Move to Breakeven Set TP at RR1 / RR2 User-Friendly – No complex setup, just attach to chart and start using Support:
Telegram – @inForexVIP
WhatsApp – +923118409597 MT4 Version Coming Soon
W
FREE
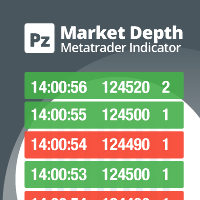
Do you like scalping? Th is indicator displays information about the latest price quotes received from the broker. [ Installation Guide | Update Guide | Troubleshooting | FAQ | All Products | Get Help ] Identify tick trends easily A blue row means the price has increased A red row means the price has decreased Customizable colors and font sizes Display your desired amount of rows The indicator is non-repainting
Parameters Rows: amount of rows with data to display in the chart Font size: font
FREE
A "simple design" trading panel, which is characterized by small byte size, low CPU usage, simple steps, and quick operation, 1 to 2 clicks to complete a functional operation,
saving time and increasing efficiency . The panel is easy to use, and it is not complicated to set parameters, which is in line with traders' habits. At the same time, its compact-
design, clear at a glance, and comprehensive functions are a powerful tool for manual trading! Key features of the panel: Click "Bid/Ask P
FREE
If you use several charts open at the same time, you know how boring it is to apply formats to each chart individually. This script can change all open charts using a single command. Parameters: 1 - Choose symbol to put on charts: apply the selected symbol to all charts. If "current", it does not change the symbol; 2 - Choose timeframe or leave empty: apply the selected timeframe to all charts. If "CURRENT", it does not change the timeframe; 3 - Apply template to the charts: If true, apply the t
FREE

Introducing the "Cybercycle Trend" Forex Oscillator, a powerful technical indicator designed to enhance your trading experience in the foreign exchange market. This innovative tool utilizes advanced algorithms to identify and analyze market trends, providing you with valuable insights and helping you make informed trading decisions.
The Cybercycle Trend Forex Oscillator is specifically designed to detect and measure cyclical price movements in the forex market. By incorporating this oscillator
FREE
Trend Envelopes indicator is calculated based on a % of price change. That % is then used to determine if there is a new trend or trend remains the same.
This version is using Standard Deviation for the price change calculation instead and is adding prices smoothing prior to be used in calculations. The smoothing can be done using one of the 4 average types:
* Simple Moving Average
* Exponential Moving Average
* Smoothed Moving Average
* Linear Weighted Moving Average
Also, this
FREE

1. The principle of InequationEurUsdChf4 intelligent trading system: The three currency hedge unbalanced arbitrage is the extension and continuation of the triangle arbitrage. As a common arbitrage method, triangle arbitrage has been used by many investors in foreign exchange trading. Triangle arbitrage is based on cross exchange rates, which is the basis of triangle arbitrage. The so-called cross exchange rate refers to the price of a non-US dollar currency expressed by another non-US dollar
FREE

AI Smart Risk Trade Manager is a professional trade-management utility panel for MetaTrader 5. It does not open trades on its own signal - instead it gives you a one-click, risk-based way to enter the market and then automatically manages every open position (yours or from any other EA) with breakeven, trailing and partial-close logic. Key features: One-click BUY / SELL panel buttons that size the position automatically from your chosen risk percent of account balance Automatic Stop Loss and Tak
FREE

See Your Key Trading Measurements at a Glance Smart Pips Meter is a free utility that displays important market measurements directly on your chart—so you can make faster trading decisions without manually calculating pip distances. WHAT IT SHOWS ADR (Average Daily Range)
See the current ADR pip value directly on your chart. Current Candle Size
Instantly see the size of the current candle in pips. Previous Candle Size
Quickly check the size of the last completed candle.
FREE

Overview Copy Trades Master is a high-performance local signal broadcaster for MetaTrader 5. It tracks active positions on your master account in real time and streams execution data directly to one or multiple SlaveCopier terminals running on the same PC or local network via ultra-fast local file IPC ( FILE_COMMON ). https://www.mql5.com/en/market/product/189485 Key Features Local Common-File IPC: Uses local file streaming ( MQL5\Files ) for near-zero latency execution without requiring externa
FREE

製品概要 本製品はMT5用インジケータであり、MT5に内蔵されてるフラクタルインジケータに改良を加えたも のです。 フラクタルインジケータは標準でMT5に搭載されていますが、計算期間が「5」に固定されており変更することができません。
そこで、いくつかの機能を追加したフラクタルインジケーターを再開発しました。 本ツールは、フラクタルを重要な水平線と考えているトレーダーだけではなく、適切な水平線の描画方法を学習しているが、参考となる情報も同時に見たいと考えている初心者の方にとっても役立つと考えています。
FlexibleFractalsLine インジケーターの利点 フラクタルラインのOn/Off ラインを描画していないチャートを確認したいと思った時に、プロパティ画面からスイッチをOffにするだけでラインを消すことができます。インジケータを都度削除してラインを消す必要はありません。
フラクタルラインの計算期間の変更 本ツールのフラクタルの計算期間は初期値として「21」が設定されていますが、任意の期間に変更できます。 ただし、設定可能なのは「奇数」の番号のみであることにご注意くださ
FREE

The Previous High Low Levels indicator displays the high and low of the previous candle from a selected higher timeframe. This helps traders identify key support and resistance zones while trading on lower timeframes. Features:
Plots the previous high and low from a higher timeframe
Works on all timeframes and instruments
Helps identify strong support and resistance levels
Lightweight and does not repaint How to Use: Select a higher timeframe (e.g., H1, H4, D1) in the settings. T
FREE

Elliott Wave PRO MTF & SQX Engine: Manual Técnico Este indicador es un sistema algorítmico avanzado que escanea el mercado buscando la estructura clásica de Ondas de Elliott (Impulso 1-5 + Corrección ABC). Combina volatilidad adaptativa (ATR), fuerza de tendencia (ADX), filtros Multi-Timeframe (MTF) y una salida de datos especializada para integrarse con constructores de estrategias automáticas como StrategyQuant X. ️ 1. Parámetros de Entrada (Inputs) Los parámetros están agrupados lógicame
FREE

Professional Manual Trading Panel for MT5 TRDR Panel is a manual trade execution and management panel for MT5 , redesigned by TRADEWYZE .
Built on a proven open-source foundation and significantly refined, TRDR Panel delivers a clean, fast, and trader-focused interface designed for discretionary and semi-systematic traders. Optimized for high-volatility instruments, TRDR Panel allows precise order placement, rapid trade management, and instant risk control all directly from the chart.
Key Featu
FREE

Gotobi Day and Tokyo Fixing Marker は、五十日(ごとうび)・東京仲値の時刻・日本の銀行休業日を MetaTrader 5 のチャートに印し、次の五十日を小さなパネルに表示する無料のインジケータです。 五十日は毎月 5・10・15・20・25 日と月末です。その日が土日または日本の銀行休業日に当たるときは、前の東京の営業日に繰り上がります。五十日には多くの日本企業が支払いを行い、日本の銀行が日本時間 9 時 55 分に決める東京仲値は、特に USDJPY で注目されます。USDJPY 向けに作っていますが、どの銘柄・時間足でも動きます。五十日の仲値の前後で取引する方、その考えをテストする方、次の五十日がいつかを知りたい方に役立ちます。 表示するもの 五十日 : 東京の 1 日を塗った帯(または縦線)と、「Gotobi 15」「Gotobi 20 (moved)」のような札。ツールチップに、どの日の分か・仲値のサーバー時刻を表示します。 東京仲値 : 日本時間 9 時 55 分の破線です。五十日だけ、または東京の営業日すべてを選べます。 日本の銀行休業日
FREE

# MiniBull Report (v1.06) — free
**Your market briefing in a sub-window. MiniBull Report answers the questions an intraday trader asks before every decision — in plain language, in your own time zone, and with the same answers on every chart timeframe.**
*Where is price against the monthly, weekly, daily and 4H trend? How far is it stretched? How much of today's typical range is used? Where are the nearest resistance and support? Is a high-impact event coming? What speaks for a long, what spe
FREE

This indicator is based on the Moving Average indicator. It helps the user identifying whether to buy or sell. It comes with an alert that will sound whenever a new signal appears. It also features an email facility. Your email address and SMTP Server settings should be specified in the settings window of the "Mailbox" tab in your MetaTrader 5. Blue arrow up = Buy. Red arrow down = Sell. Line = Trailing Stop. You can use one of my Trailing Stop products that automatically move the Stop Loss and
FREE

The Retracement indicator shows the current and historical high, low and mid values. Optionally, it can also display major retracement levels. All these levels together form the significant levels of support and resistance. Therefore, it is essential to know them for every kind of trader.
Levels High Low Midpoint 76,4 % 61,8 % 38,2 % 23,6 %
Main features The indicator shows the actual levels of High, Low, Mid and selected retracements. Four optional retracement levels. Alert notifications
FREE

このインディケーターはEAの一部です: HIPERCUBE PRO GALE BTC Darwinex Zeroの20%割引コード: DWZ2328770MGM_20
Donchianインディケーターの新バージョンを発表
私たちは、 新しいバージョンのDonchianインディケーター を発表できることを非常に嬉しく思います。最先端の改善と精度を備えた設計で、今や HiperCube Pro Gale に完全対応。このアップデートされたツールは、より効果的なトレードに向けたスムーズな体験を提供します。
このバージョンが画期的な理由:
HiperCube Pro Gale対応 : この最新アップデートは、 HiperCube Pro Gale との統合を念頭に置いて特別に設計されており、トレード戦略における最大の互換性と効率性を保証します。 比類なきパワー : Donchianインディケーターは市場動向を追跡するための人気ツールであり、新バージョンではその性能が最適化されています。 実証済みの効果 : 市場の動きを予測するその能力により、Donchianインディケーターは
FREE

The Average Force Indicator is a technical analysis tool designed to measure the strength of price movements by analyzing both momentum and volatility. This indicator is based on the Force Index , which combines price changes and volume data, but with a smoothing mechanism to provide a clearer and more stable reading of market dynamics.
Key Features: • Momentum and Trend Strength Measurement – Helps traders identify the intensity of buying or selling pressure. • Smoothed Force Index Calcula
FREE

visual trade planner for MetaTrader 5. It draws multi-timeframe ATR reward and stop zones on the chart so you can judge distance and payoff before you place the trade yourself. It does not send, modify, or close orders. Motive A single ATR on the chart timeframe often hides the larger and smaller ranges a trade is actually working against. This EA stacks three take-profit slices, each from its own timeframe, period, and multiplier, then places an ATR stop and an optional fixed stop beside them.
FREE

CCI Multi-Timeframe Dashboard shows the CCI reading of four timeframes at the same time, so you can measure momentum extremes across the market at a glance. By default it displays the M15, H1, H4 and D1 timeframes, and the period, applied price and levels are configurable. Each timeframe is color coded, with red when the reading is above the upper level, green when it is below the lower level and grey when it is in the normal zone, which makes stretched conditions easy to see. Alerts are based o
FREE

Daily PnL Dashboard is a clean, draggable on-chart panel that shows your real trading results at a glance — no more digging through the account history tab.
What it shows: - Today's result — big and clear, with the number of closed trades. - Daily breakdown for the week: each of the last 7 days (or the current week from Monday) with a proportional bar per day, so you instantly see your best and worst days. - Weekly and all-time totals, including the all-time result as a percentage of your net d
FREE
The Indicator assists in decision making along with the user's market reading. By drawing the trend, this indicator becomes very useful on days of high volatility in the market, that is, it offers strategic insights on days of economic data, news or pronouncements. On flat market days it becomes usual to identify possible market reversals. Follow Youtube to understand the most suitable scenarios for its use.
FREE

This MT5 alert is designed to identify potential buying opportunities based on several technical indicators and price action patterns. Here's how it works: Buy Conditions 1. RSI Condition: The Relative Strength Index (RSI) for the current period is below a specified low threshold (RsiLow). This indicates oversold conditions.
2. Candlestick Pattern: It checks for a specific candlestick pattern across three consecutive candles: - The current candle (1) closes higher than it opens (bulli
FREE

Script to create arrows and lines on chart of history positions traded on account for the symbol where you launch the application. From inputs you can select: - Magic number (default is -1; -1 = all magics number) - "From" date and time (default is 1970.01.01 00:00; all positions) - "To" date and time (default is 1970.01.01 00:00; all positions) - Color for buy open positions (arrows and lines between open and close) - Color for buy closing positions (arrows) - Color for sell open positions
FREE

CandleFrame Time Boxes is a native multi-timeframe visualization indicator for MetaTrader 5. It displays candles from a selected timeframe as clear, color-coded range boxes directly on the current chart. Each box represents the complete High-to-Low range and full time span of one source candle. This makes higher-timeframe market structure easier to read while working on lower chart timeframes. KEY FEATURES • Multi-timeframe candle boxes
• Bullish, bearish and doji classification
• Live current b
FREE

This is an ordinary MACD indicator displayed in the main window according to the selected chart style, i.e. Bars, Candlesticks or Line. When you switch the chart type, the indicator display also changes. Unfortunately I could not improve the chart type switching speed. After switching, there are delays before the arrival of a new tick.
The indicator parameters Fast EMA period Slow EMA period Signal SMA period Applied price
FREE

どんなにチャートを動かして注目する時間ポイントに瞬時にフォーカス移動できます。
もし気に入っていただけたら、「Focus Time Line」もご検討下さい: https://www.mql5.com/ja/market/product/154363 本機能に加えて複数チャートでのMTF同一時刻での同期が可能でマルチタイムフレーム分析が楽にできます。
【機能】 ・Focus Mode: SingleLine (デフォルト表示) ・Crt FocusLine: 任意の時間にフォーカスラインを1本作成 ・Position: 表示位置切替 ・Focus: 作成したフォーカスラインにチャート画面を移動 ・Xボタン: プログラム終了
【操作手順】 ・Focus Mode はデフォルトの SingleLine のままで使用 ・Crt FocusLine ボタンを押して1本の FocusTimeLine を作成 ・Position ボタンで表示位置を選択 ・Focus ボタンでチャートを注目ポイントに移動 ・Xボタンでプログラムを終了
エディション別機能比較 以下の表は、本製品(Pl
FREE

OVERVIEW Sierra Capital Multi-Timeframe EMA draws the moving averages of the timeframes you choose as horizontal levels on your chart. Each timeframe gets two lines in one color, a fast one (solid) and a slow one (dashed), 55 and 200 by default. On an M15 chart you can see at a glance where the H4, daily, weekly and monthly averages sit. It is a display tool. It gives no signals or alerts and does not open or manage trades.
WHAT YOU SEE Two horizontal lines per timeframe, in the same color: fas
FREE

Unlock the power of trend analysis with the Candle Trend Bars Indicator – your go-to tool for identifying and understanding market trends like never before. This innovative indicator transforms traditional candlestick charts into a dynamic and visually intuitive representation of market trends. Key Features: Trend Clarity: Gain a clear and concise view of market trends with color-coded bars that instantly convey the direction of price movements. User-Friendly Design: The indicator is designed wi
FREE

Moving Average Colored
A very simple indicator, but one that cannot be missed when carrying out your operations. Considered one of the oldest and indispensable indicators to have on your chart now with coloring to make your operations even easier. Configuration Parameters: Time course Averaging Method
Come and see our mql5 signals too https://www.mql5.com/pt/signals/914535?
FREE

Also Available in MetaTrader4 https://www.mql5.com/en/market/product/174746 Introducing: ZERO HOUR RUNNER NON-REPAINT indicator SHORT PRECISE & NOISELESS A system engineered around one principle Clarity + Timing + Discipline = Consistency What Makes ZERO HOUR RUNNER Different? No Repainting. No Tricks. Signals do NOT repaint, redraw, or recalculate What you see is exactly what you get—even after refresh Instant Decision Signals Signals appear at the OPEN of a candle No waiting
FREE

PEAK MASTER LITE – PRECISION RESISTANCE NAVIGATOR
Peak Master Navigator is a non-repainting technical indicator designed to accurately identify and visualize structurally confirmed resistance levels in real time.
It detects valid swing highs based on market structure confirmation rules, ensuring that only meaningful and reliable resistance points are displayed on the chart. By filtering out weak or premature highs, Peak Master Navigator helps traders focus on true price reaction zones , improvi
FREE
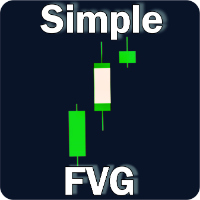
Simple Fair Value Gap Unlock the power of fair value gaps with this simple and precise, easy to use indicator designed to identify and visualize market inefficiencies
Simple Fair Value Gap is an mt5 indicator which paints the center of a fair value gap candle with a different color. A Fair Value Gap (FVG) is a three candle formation in which the middle candle does not get completely overlapped by the left and right candle. i.e The difference between the high and low of either left or right cand
FREE
MetaTraderマーケットは自動売買ロボットとテクニカル指標を販売するための最もいい場所です。
魅力的なデザインと説明を備えたMetaTraderプラットフォーム用アプリを開発するだけでいいのです。マーケットでプロダクトをパブリッシュして何百万ものMetaTraderユーザーに提供する方法をご覧ください。

取引の機会を逃しています。
- 無料取引アプリ
- 8千を超えるシグナルをコピー
- 金融ニュースで金融マーケットを探索