 MetaTrader 5
 エキスパート
 インディケータ
 ライブラリ
 ユーティリティ
 ウィジェット
 ルール
YouTubeにあるマーケットチュートリアルビデオをご覧ください
ロボットや指標を購入する
仮想ホスティングで
EAを実行
EAを実行
ロボットや指標を購入前にテストする
マーケットで収入を得る
販売のためにプロダクトをプレゼンテーションする方法
MetaTrader 5のための無料のエキスパートアドバイザーとインディケータ - 88
 自動売買ロボットとインジケータを使用して、外国為替取引の収益性を高めます。 自動売買ロボットを使用すると、取引の開始と終了を自動化でき、インジケータは市場の行動をより正確に予測するのに役立ちます。
このページには、MetaTrader5アプリケーションのカタログが掲載されています。

Umagads Candle Timer MT5:規律あるトレーダーのための精密タイミングツール 動きの速い相場において、ローソク足が閉じる正確なタイミングを知ることは、完璧なエントリーと絶好の機会を逃すことの分かれ目となります。 Umagads Candle Timer MT5 は、実行に絶対的な精度を求めるMetaTrader 5ユーザー向けに設計された高性能ユーティリティです。M1のスキャルピングから日足のスイングトレードまで、このツールは必要な場所にカウントダウンを表示し、常に市場の一歩先を行くことを可能にします。 主な機能: スマート表示: 時間足に応じてフォーマットを自動変更(MM:SS、HH:MM:SS、または日数表示)。 視覚的警告: 終了10秒前に色がオレンジに自動変更され、執行に集中するための直感的な視覚信号を提供します。 ダイナミック配置: 価格のすぐ横に表示、またはチャートの四隅に配置可能。テクニカル分析を妨げないクリーンなワークスペースを提供します。 マルチ通知: ポップアップ、スマホへのプッシュ通知、メールに対応。終了30秒前(デフォルト)に事前警告を設定可
FREE

The Ultimate Real-Time Account Dashboard & Pro Stats Monitor AURA Trade Information Panel - Ultimate Edition Maximize your trading efficiency with the ultimate all-in-one on-chart dashboard. The AiO Trade Information Panel provides a comprehensive, real-time overview of your trading performance, essential market data, and vital technical indicators without cluttering your workspace. Designed for both day traders and scalpers, this panel helps you stay disciplined and make informed decisions in
FREE

RADAH Dashboard is an advanced performance analytics utility for MetaTrader 5, designed to transform your account history into a clear, organized and interactive trading performance overview.
It does not open, modify or close trades. Its purpose is exclusively analytical, allowing you to review the performance of the entire account, a specific symbol, or a strategy identified by its Magic Number.
Chart View
Visualize your trading performance through an integrated balance/equity performance c
FREE

The dashboard functions as a decision-support tool rather than an execution panel. It centralizes technical data across seven timeframes (M1 to D1) so you can see the "big picture" at a glance. Price: Displays real-time bid/ask values for each timeframe. Signal: Provides a basic "BUY" or "SELL" recommendation based on recent candle close data. Trend & Summary: Shows the dominant market direction (e.g., "UP" and "BULLISH"). Structure: Identifies "BOS BULL" (Bullish Break of Structure), indicati
FREE

Jackson Support and Resistance it a powerful advance support and resistance indicator which provide signal base on price action, it Design to make things easy for everyone to draw support and resistance. we believe most strategies are built with support and resistance as a foundation .Having support and resistance perfect can be a game change to you way of trading. It flexible to all instrument .don't forget to watch our video on how to us this indicator prefect and progressive.
FREE

RBM ATR PRO v1.10 Quem opera mercado volátil sabe como é ruim tomar stop por causa de uma violinada de pavio e ver o preço andar forte a favor logo depois. O RBM ATR PRO foi desenvolvido exatamente para resolver isso. Ele evolui o indicador clássico de volatilidade combinando a leitura do ATR com dois níveis independentes de suavização. A linha no gráfico fica limpa e objetiva: verde para estrutura de alta e vermelha quando o mercado vira para a baixa. Funciona perfeitamente para rastrear a ten
FREE
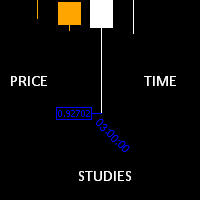
Time and Price Fractal Studies is an indicator that will help you identify certain patterns that tend to repeat themseleves at certail times of the day or at certain prices. It is used to study Fractal Highs ad Lows in relation to time and price. You will get to answer certail questions like: At what time of day does this market usually turn around. At what price does the market turn. Is it at round numbers etc.
FREE

English Description Title: Chart Cleaner (Eye Tool) Subtitle: Clean your charts instantly with 1 click while preserving your technical analysis. Inspired by TradingView's eye tool. Description: Have you ever wanted to look at clean price action without cluttering your chart with trendlines, support/resistance levels, and Fibonacci studies? Deleting and redrawing everything takes too much time. Chart Cleaner (Eye Tool) is designed to solve this exact problem. Featuring a minimalist design—a small
FREE

"Risk Copilot" is a s imple and powerful tool to manage risk (in % or $), calculate position size, define target based on Risk-Reward and send orders to market automatically.
Input Parameters:
PositionType = Buy ou Sell // Position Type Risk = 0.3 // Risk (%) RiskMoney = 0.0 // Risk ($) RiskReward = 1.0 // Risk/Reward OrderSplit = 1 // Order split (only for HEDGE accounts) SLLineColor = clrGreen // Line Color (SL) SLLineWidth = 1// Line Width (SL) SLLineStyle = STYLE_SOLID // Line Style (SL) T
FREE

Most candles say very little. A few say a great deal. Candle Strength makes the difference visible without you measuring anything. It colours every candle by how much of its move is body relative to current volatility: strength = |close - open| / ATR A candle with a large body relative to ATR is a committed move: one side took control and held it into the close. A candle with a small body is indecision, no matter how far the wicks travelled. How to read it Blue - strong bullish candle, body at
FREE

The CSI Currency Strength indicator ranks all ten G10 currencies by momentum strength using a multi-lookback Z-score model, displayed as a live on-chart panel. Attached to any chart, it runs independently of the chart's symbol or timeframe. The methodology follows the multi-horizon momentum framework from Asness, Moskowitz & Pedersen (2013), applied cross-sectionally to G10 currencies. Rather than comparing a single bar against the previous close — which introduces a cliff-edge artifact at each
FREE

HTF Vision - Higher Timeframe Candle Display Free now, celebrating release of Live Chart Viewer utility https://www.mql5.com/en/market/product/158488
HTF Vision provides traders with an intuitive way to visualize higher timeframe price action directly on their current chart. This powerful indicator overlays candlestick data from selected higher timeframes (H1, H4, or Daily) as customizable boxes, giving you instant context of larger market movements without switching charts. Key Features: Mult
FREE

SwingTrade Candle Patterns EA uses Pin Bar, Engulfing, Morning/Evening Star and Hammer patterns with RSI confirmation and ATR-based money management. Stable swing trading with low drawdown and steady profit growth. Valid for Prop Firms. Strategy Recognizes Pin Bar, Engulfing, Morning/Evening Star, Hammer candlestick patterns. Confirms trades with RSI trend filter . Uses ATR-based Stop Loss and Take Profit → adapts to volatility. Built-in breakeven system to protect profits. No m
FREE
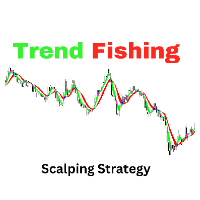
The "Trend Fishing Indicator" is a powerful custom indicator designed to help traders identify potential trend reversal points and capitalize on market momentum. This indicator uses multiple moving averages of varying periods to evaluate short-term and long-term market trends. By comparing the short-term moving averages against the long-term ones, it generates clear buy and sell signals that can guide traders in making informed trading decisions. Key Features: Multiple Moving Averages : Incorpor
FREE

GLX1 Renko Euro Expert Advisor (EA) can create the Renko bar charts on EURUSD or EURAUD symbols only. The Renko charts are generated as real-time custom EURUSD or EURAUD charts which can be further used for technical analysis with any MT5 compatible indicator. If you want to create Renko charts on any symbol, please use GLX1 Renko Builder Expert Advisor from here. https://www.mql5.com/en/market/product/115077
Included Features: Truly responsive Renko Charting on a custom EURUSD or EURA
FREE
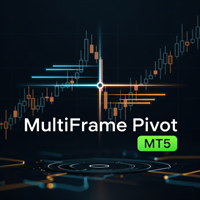
MultiFrame Pivot: A Multi-Timeframe Analysis Tool MultiFrame Pivot is an analysis indicator designed to provide an overview of the market based on Pivot Points across multiple timeframes. The indicator synthesizes information from different timeframes to give you a more comprehensive view of important price levels. KEY FEATURES: Multi-Timeframe Analysis: MultiFrame Pivot allows you to simultaneously monitor the price's status relative to Pivot Points (PP), Support 1 (S1), and Resistance 1 (R1)
FREE

The CV Ribbon Indicator dynamically visualizes market trends using modern ribbon-based technology. By combining multiple moving averages, the indicator helps traders identify trend direction, momentum and market phases with clarity and speed. Features: Dynamic ribbon visualization Trend & momentum detection Modern and clean design Suitable for Forex, Gold, Indices, Crypto and Stocks Supports multiple trading styles Disclaimer: This product is intended for analytical purposes only and does not co
FREE

Trading Stats Panel Your Trading Performance. At a Glance. Trading Stats Panel is a professional MetaTrader 5 indicator designed to give traders a clear and convenient overview of their recent trading activity directly on the chart. Instead of constantly opening the MT5 History tab and manually calculating your results, the panel presents key trading statistics in one easy-to-read dashboard. What Does Trading Stats Panel Show? The dashboard provides important performance information including
FREE
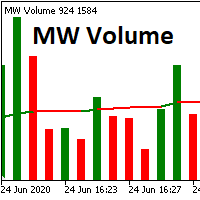
The Martinware Volume indicator plots a colored moving average over volume bars. The coloring uses three colors and can be done in different ways choosable by the user and is applied both to the average as to the volume bars.
Three types of coloring are possible: None: no coloring is done Increasing or decreasing: changes the color depending on the current value being bigger or lesser than the previous one Volume relative to average: colors vary if the current volume is bigger or lesser then
FREE

In which direction should I trade today? For “TREND followers”, we need to determine the TREND . This indicator determines the Trend based on the price High, Low and Close of every bar, for a given period and timeframe. Calculating and plotting the Trend UP and Trend DOWN lines. If the: “Trend UP” line (Green) is above the “Trend DOWN” line (Red), then it is a BULLISH Trend (see "Screenshots" tab). “Trend DOWN” line (Red) is above the “Trend UP” line (Green), then it is a BEARISH Trend (see "
FREE
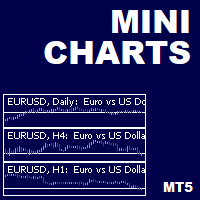
This is a utility indicator that creates mini charts on left side of the chart you are looking at.
It is very useful to watch many timeframes simultaneously, without having to change between multiple charts. Its configuration is very simple. You can have up to 4 mini charts opened. They automatically load the template of the "parent" chart. If you have any doubt please contact me. Enjoy!
This is a free indicator, but it took hours to develop. If you want to pay me a coffee, I appreciate a lot
FREE

これは何か
Execution Caliper は自動売買ロボットではなく計器です。チャート1枚の上に置いて、あなたの口座がその銘柄でいくら執行コストを課すかを測り、そのコストを、これから走らせようとしているEAのストップ幅で割ります。出てくるのは1つの比率、つまりストップに対するコストの割合です。発注はせず、ポジションも持たず、同じ端末の他のEAには一切触れません。そして勝てるとも言いません。利益が増える、安全になる、成績が良くなる、そのどれも主張しません。あなたの口座がいくら取っているかを、高い授業料を払う前に知らせるだけです。
なぜ必要か
この段落の数字は私たちのEAのものではありません。他人のEAの公開 MQL5 シグナルを、その約定エクスポートから私たち自身が再集計した値で、シグナルの識別子、再計算、そして私たち自身の以前の作業表への訂正は本サイトの作者ブログに書いてあります。そのうち2本は、同じEAを2つの異なるブローカーで走らせています。取引を1対1に突き合わせた760組では、2つのブローカーの建て値の差は中央で1オンスあたり4セント、両口座が数分以内に決済した組で
FREE

New candlestick alert, the alert appears according to the timeframe it is placed on. The indicator works on any asset, the alert can be silenced at any time, without the need to remove the indicator from the graph. It's great for those who can't keep an eye on the chart all the time. You can use this tool at work, college or anywhere else. It is also possible to receive signals directly on your cell phone by connecting to the metatrader. Aurélio Machado.
FREE

StopFirst Loss Limit Monitor は、口座全体について、1日の損失上限と最大損失のうちどれだけを使い、どれだけ余裕が残っているかを、プロップファームと同じ方法で計測して表示します。無料です。
インジケーターなので、計測と警告だけを行い、何も決済しません。チャートの EA 枠を使わないため、どの EA とも一緒に動かせます。
計測するもの
1日の損失上限(初期設定 4 %) - 口座サイズに対するパーセントまたは金額で指定。 - 日初の残高(初期設定)、日初の残高と有効証拠金の大きい方、または日初の有効証拠金から計測 - ファームが定義する3つの方法です。 - 含み損を含める(初期設定)か、決済済み取引のみ。 - 1日は、ブローカー時間、GMT、中央ヨーロッパ時間、ニューヨーク時間のうち選んだ時計の指定時刻にリセットされ、それぞれ独自の夏時間の日付に従います。初期設定は中央ヨーロッパ時間の午前0時。ブローカーの午前0時でリセットするモニターは、1年のうち一定期間1時間ずれます。
最大損失(初期設定 8 %、固定) - 下限は口座サイズから上限を引いた値
FREE

Chart Navigator MT5 Base は、価格チャート上を素早く移動し、チャート上の自分のマークへすぐにジャンプするためのミニマップです。 このインジケーターは、価格チャート全体のコンパクトなミニマップをチャートに追加します。このマップにより、履歴内を素早く移動し、垂直線でマークした重要な場所へ戻ることができます。 このシンプルなナビゲーターの主な利点は、単なるチャートのスクロールではなく、手動で長くスクロールすることなく必要なエリアへ素早く移動できることです。重要なイベントのマークとしてチャートに垂直線を置くと、その線はミニマップにも表示されます。その後、履歴のかなり先または過去へ移動しても、ミニマップ上でそのマークを見つけ、ワンクリックで必要な場所へすぐに戻ることができます。重要な日付、シグナル、取引、ニュース、分析ゾーン、または素早く戻りたい任意のポイントをマークする場合に便利です。
仕組み ミニマップは、選択された履歴範囲をコンパクトな価格ラインとして表示します。メインチャートの現在表示されている範囲は枠で強調表示されます。ミニマップをクリックするとチャートが選択
FREE

どのトレーダーにも覚えのある手順があります。インジケーターの設定を開き、数値をひとつ変え、OK を押し、チャートをじっと眺め、違うと判断し、また設定を開く。MACD にいたっては悩みどころが一度に三つ、Fast・Slow・Signal があり、定番の 12/26/9 も慣習にすぎず、絶対のルールではありません。MACD Live Tuner はこの繰り返しを終わらせます。 これは チャート上でそのままリアルタイムに 調整できる MACD で、専用のサブウィンドウで動作します。チャートに小さなパネルが置かれ、Fast EMA の期間、Slow EMA の期間、Signal の期間を動かすスライダーが並びます。どれかをドラッグすれば、MACD ライン、Signal ライン、Histogram のすべてが目の前で即座に再計算され、描き直されます。12/26/9 のままでよいのか、自分の相場に合わせるべきなのか。その答えはフォーラムのスレッドではなく、数秒で出ます。 多くのトレーダーが誤解している点があります。Signal ラインは Simple Moving Average であり、EMA
FREE

Fractales Auto (Automaticos) Identifique automáticamente fractales de compra y venta para detectar puntos de giro del mercado Fractales Automáticos es un indicador para MetaTrader 5 que detecta de forma automática los fractales alcistas y bajistas utilizando la estructura clásica de máximos y mínimos relativos. El indicador marca sobre el gráfico los puntos donde el precio forma un máximo o mínimo significativo, facilitando la identificación de posibles zonas de reversión, soportes, resistencias
FREE

Overview? The **Pivot Points On Custom Timeframe** indicator for MetaTrader 5 calculates and displays traditional pivot levels (P, S1–S3, R1–R3) based on a higher timeframe of your choice, regardless of the current chart's timeframe. It is designed to help traders identify potential support and resistance zones using classic pivot formulas, calculated from user-defined periods such as D1, W1, H4, etc.
This indicator can optionally show price labels and trigger alerts when price crosses the piv
FREE

This utility is designed to receive volumes from order books from larger crypto exchanges and transfer information to the indicator RealCryptoLevels . The RealCryptoLevels indicator by downloading the order book of crypt exchanges with maximum depth shows horizontal volumes of popular crypto currencies on the chart, so you can see not only the volumes, but also the levels and them strength (see screenshots), which is very important for successful trading in all strategies from scalping to m
FREE

Mentoria Individual — Manual Trade Execution and Risk Management Mentoria Individual is a free manual trade execution and risk management tool for MetaTrader 5, developed by Gean Patrick. It combines lot size calculation, order preparation, visual Stop Loss and Take Profit adjustment, and position management in an interactive panel directly on the chart. The tool is designed for traders who want to maintain full control over their trading decisions. It does not provide trading signals or execut
FREE

Copilot Trend ATR Lite Full version (unrestricted): https://www.mql5.com/en/market/product/175467 This is a limited version of the Copilot Trend ATR EA designed for testing and evaluation before purchasing the full version.
The system is built for automated multi-symbol trading using structured execution and ATR-based logic.
Multi-symbol trading engine Automatic trade execution Built-in Stop Loss and Take Profit Smart trade management No manual intervention required
This version al
FREE

NOW FREE!!
Introducing RichRush EA, This expert advisor, armed with cutting-edge trading strategies, can assist on your path to navigating the forex market. Optimized specifically for EURUSD, RichRush EA operates on moving averages, and calculated lot sizes to manage risks. The EA interprets market movements, adjusts to volatility, and aims to identify entry points. As part of our commitment to providing top-tier trading tools, we invite you to explore our range of premium products designed to
FREE

For those who needs a levels of a first day of a month fully coded with Grok AI Standard settings: * line width * historic Lvl's * Line colors/type *************************************************************************************** Inspired by trader, to use these levels, but i wanted to mark these levels fast and not waste my time on drawing them.
FREE

Description L'indicateur Bid/Ask Spread Signal est un outil avancé conçu pour les traders utilisant MetaTrader 5 (MT5) qui souhaitent surveiller et réagir efficacement aux variations du spread Bid/Ask. Il offre une visualisation claire du spread actuel, de sa moyenne mobile, et des niveaux d'alerte personnalisables, permettant ainsi une meilleure prise de décision et une gestion des risques optimisée.
Caractéristiques Principales • Visualisation du Spread en Temps Réel : Affiche le spread Bid
FREE

İŞLEM GİRİŞ KOÇU - Ücretsiz MT5 Eğitim Göstergesi Trade Entry Coach, MetaTrader 5 kullanıcılarının trendleri, destek ve direnç seviyelerini ve mum çubuğu onaylarını daha yapılandırılmış bir şekilde değerlendirmelerine yardımcı olmak için geliştirilmiş ücretsiz bir eğitim göstergesidir. Bu gösterge, mevcut grafik zaman dilimindeki piyasa koşullarını analiz eder ve sonuçları kompakt bir bilgi panelinde görüntüler. Otomatik olarak işlem açmaz veya kullanıcı adına işlem kararları almaz. ANA ÖZELLİK
FREE

This is a simple EA Can only open ONE trade EVER then MUST be reattached to the chart everytime you want to use it. Designed to help manual traders Has lot sizes and stops / targets in pips. For a buy trade the engulfing bar must close above the previous red bars high Includes Alarm and Phone notifications
Basically if you find a price zone you like and will take a trade if there is an engulfing bar . use this.
FREE
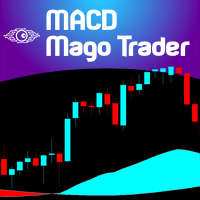
For those traders and students who follow the famous brazilian trader Igor Rodrigues (Mago Trader) here it is another tool he uses: a 2-line MACD specially set with Phi ratios. This MACD is packed with a twist: a Filling Area , to easily and visually spot the corresponding trend on the chart. Obviously, you can turn On and Off this filling feature. If you don't know Igor Rodrigues and you are a brazilian trader and student, just google for him... Very simple and useful indicator.
If you are loo
FREE

is an exit manager for trades you open yourself. It does not open positions and it does not send signals. After a manual buy or sell, it gives that trade a stop and up to six exit stages based on volatility. Three stages come from Average True Range, each with its own timeframe. Three come from completed range: daily (ADR), weekly (AWR), and monthly (AMR). Each stage can be switched on or off. Enabled stages are sorted by distance. Nearer stages trail the stop. The furthest is posted as the take
FREE
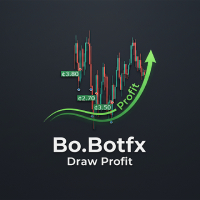
Tired of sifting through your account history to track closed trade profits? The Draw Profit indicator by Bo.Botfx is here to revolutionize how you visualize your trading performance! This intuitive and powerful indicator automatically draws the profit (or loss) of your closed orders directly onto your chart . No more guessing or tedious calculations – with Draw Profit, you can instantly see the exact outcome of each trade right where it happened. Key Features: Visual Profit Tracking: Clearly di
FREE

Force Index MTF は、古典的なフォースインデックス(Force Index、勢力指数)オシレーターの高度な実装であり、マルチタイムフレーム(MTF, Multi-Timeframe)機能を強化したものです。価格変動と出来高の積を計算することで、市場変動の背後にある生の力を定量化し、トレーダーが重要なトレンド継続と小さな押し目を見分けるのに役立ちます。
モメンタム・出来高オシレーターとして、Force Index は買い手と売り手の強さを測定します。正の値は買い圧力の優勢(蓄積、accumulation)を示し、負の値は売り圧力の優勢(分散、distribution)を示し、ゼロラインのクロスは市場の主導権が変化する可能性を示唆し、しばしば押し目・戻りの終わりを識別するために使われます。
本インジケーターには独立した MTF エンジンが搭載されており、ウィンドウを切り替えることなく、任意の上位時間足(HTF)の Force Index データを現在のチャート上で直接監視できます。デュアルモードの感度を提供します。短い期間(例:2)は感度が高く、日中取引での短期的な押し
FREE
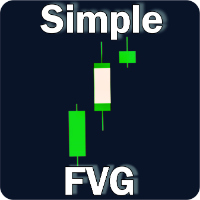
Simple Fair Value Gap Unlock the power of fair value gaps with this simple and precise, easy to use indicator designed to identify and visualize market inefficiencies
Simple Fair Value Gap is an mt5 indicator which paints the center of a fair value gap candle with a different color. A Fair Value Gap (FVG) is a three candle formation in which the middle candle does not get completely overlapped by the left and right candle. i.e The difference between the high and low of either left or right cand
FREE

即時のDiscord通知。チャート上で直接価格レベルを設定し、価格がそれを通過したときにメッセージを受け取ります。レベルの追加はワンクリックで行えます。マウスでラインをドラッグして、希望する価格レベルを正確に設定できます。 便利なコントロールパネル: すべてのアクティブなアラートはリストに表示されます
ラインをドラッグしてレベルを編集できます
不要なアラートはワンクリックで削除、または「Clear All Alerts」で一括削除できます
アラートは発動後に自動的に削除されます
チャート上のアラートラインを非表示にするオプション
カスタム通知テキストのサポート(例:crossed、reached、touched)
Dark/Lightモード対応 動作方法: Add Alert をクリック
チャートに価格レベルのラインが表示されます
希望する価格レベルに移動します
価格がそのレベルを通過すると - Discordでメッセージを受け取ります 簡単な設定: Discordでテキストチャンネルを作成し、そのWebhook URLをコピーします。
MetaTrader 5 → Tools → O
FREE

LAUNCH OFFER - FREE for the first users (in exchange for an honest review + feedback). After that the price steps up as copies are claimed: $49 → $69 → $99 → $129 , up to the launch price of $149 . Early adopters lock in the lowest price. Rental $30/month and a free Strategy-Tester demo are always available. Aegis Meridian is a fully automated AUDCAD adaptive mean-reversion grid for MetaTrader 5, with a one-knob risk facade and optional high-conviction TURBO profiles. All figures below are St
FREE

# Star light mini v6 - Free
**Type:** Free version (Scalping EA with DD-step & Resume features) **Copyright:** 2026, KOKONOE **Description:** For XAUJPY, EURJPY and other instruments
---
## Overview
**Star light mini v6** は、有料版 Star light v6 の主要機能を搭載した無料版です。Auto lot 試験版を除くほぼすべての機能が使用可能で、特に以下の点が強化されています:
- **ドローダウン・ステップ機能** — DD率に応じた動的複数オーダー管理 - **高度な再開スケジュール** — 利益目標/損失上限達成後の自動再開(日次/週次/月次指定) - **時間帯制限機能** — エントリー・決済時間の精密コントロール - **Buy/Sell分離パラメータ** — 方向別の利益目標・注文密度設定 - **マルチタイムフレーム対応**
FREE

商品名: ATR_SLTP v2 — SL・TP自動計算 + ロット計算 + アラート(GOLD・FX・BTC対応) 短い説明文: エントリー価格を入力するだけでATRベースのSLとRR2:1のTPを自動描画。3スロット管理・ロット計算・アラート・指値対応。 詳細説明文: 裁量トレーダーが抱える共通の問題 正しいところでエントリーした。相場も思った通りに動いた。なのに、損失で終わった。 エントリーは間違っていなかった。問題はSLとTPの置き方にあります。 感覚でSL・TPを決め続ける限り、トレードの結果は安定しません。狭すぎればヒゲ一本で刈られ、広すぎれば損失が膨らむ。このインジケーターはその問題を解決します。 ATR_SLTP v2でできること エントリー価格をパネルに入力するだけで即座に表示されます。 ・ATRベースのSLライン — 相場のボラティリティに自動追従 ・RR2:1のTPライン — SL距離から自動計算 ・推奨ロット数 — 口座残高とリスク%から自動算出 手計算は一切不要。すべてリアルタイムで更新されます。 主な機能 ① ATRベースのSL・TP自動計算 固定pipsで
FREE

KD MTF Candle Timer — Multi-Timeframe Candle Countdown & Synchronized Clocks for MetaTrader 5 Have you ever entered a trade prematurely on the lower timeframe, only to watch a Higher Timeframe (H1 or H4) candle wick violently against you before closing as a rejection pinbar? Or entered right before the candle close and suffered severe slippage during the transition? In discretionary trading and prop firm challenges, entry timing relative to candle closure is just as critical as your price level
FREE
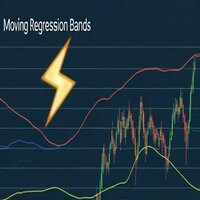
MovingRegressionBands - Polynomial Regression Indicator with Adaptive Bands Description MovingRegressionBands is an advanced technical indicator that combines polynomial regression with adaptive bands to identify market trends and reversal points. Using sophisticated mathematical calculations, the indicator provides a more precise view of price movements through a higher-order regression model. Key Features Configurable polynomial regression order for greater accuracy Adaptive bands based on mod
FREE
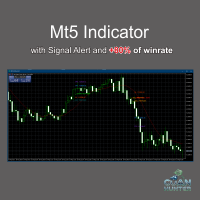
FREE VERSION FOR GOLD (XAUUSD) AND BTCUSD Dont forget to rate after use this indicator, Thanks.
Features: Clear Buy/Sell labels with directional arrows. Automatic Take Profit (TP) & Stop Loss (SL) labels for better risk management. Easy-to-read chart signals (no messy lines). Works on any timeframe and any asset (Forex, Gold, Indices, Crypto, Stocks). Compatible with MetaTrader 5 (MT5 desktop & mobile sync) . Perfect for: Beginner traders who need straightforward sign
FREE
Swing High & Low Trendline Indicator is a professional tool that automatically identifies swing points on your chart and draws trendlines for easy visualization.
No need to manually scan candles, the indicator highlights key highs and lows based on your chosen settings, helping you analyze market structure and trade with confidence. Features: Automatically detects swing highs & swing lows Draws clean trendlines directly on the chart Works on all symbols (forex, indices, crypto, stocks,
FREE

GOLD SecScope AI は、 GOLD(XAUUSD)専用 に設計された、超軽量のリアルタイム・マイクロ分析ツールです。 内部エンジンで 1秒足を自動生成 し、さらに AI が算出するマイクロモメンタムスコア を小型のフローティングウィンドウに表示します。 ウィンドウはダブルクリックする事で、自由にドラッグ可能。チャート上の好きな位置に配置できます。 本ツールは 自動売買やシグナルを出しません 。 スキャルパー向けの 視覚的アシスタント です。 主な特徴 1秒足カスタムチャートエンジン 内部で秒足を生成 外部データやカスタムシンボルは不要 毎ティック更新でも非常に軽量 AI マイクロモメンタムスコア 過去 300秒 の価格変動を AI が解析 スコアは –1.2 ~ +1.2 の範囲で連続的に変化 GOLD のボラティリティに特化した カスタムオシレーター(AUC 0.89) 微細な方向転換や勢いの変化を視覚化 フローティング小窓(HUDスタイル) ダブルクリックでドラッグ移動可能 サイズ・不透明度を調整可能(パラメータ) シンプルで視認性の高いデザイン マルチモ
FREE

ADX Trend Strength Multi-Timeframe Dashboard shows how strong the trend is and in which direction, on four timeframes at once, using ADX together with the Directional Indicators. It answers the question that decides which tools to trust: is the market trending strongly or simply ranging. By default it reads the M15, H1, H4 and D1 timeframes, and the period and the strong threshold are configurable. Each timeframe appears in green for a strong up move, red for a strong down move and grey when the
FREE

Monthly Calendar MT5 simply presents your MT5 Trading History Beautifully. Your Entire Trading Month. At a Glance. Key Features
Download:
User can download screenshot by clicking Download icon.
Customizable Title:
Users can change the default “Monthly P/L Calendar” title to their preferred title.
Instant Profit/Loss Recognition:
Live tracking and P\L updates in seconds.
Click-to-Inspect:
Click any trading day to open detailed trade information.
Complete Trade Details:
Review time, sym
FREE

AMSV Zones - Adaptive Market Structure + Volatility Zones
Stop trading blind support/resistance levels. Start trading zones that adapt to real market conditions.
AMSV Zones combines multi-timeframe market structure analysis with volatility-adaptive zones to identify high-probability trading opportunities. Unlike traditional indicators using fixed levels, AMSV automatically adjusts zone widths based on current ATR, ensuring relevance during both calm and volatile periods.
KEY FEATURES
1. Mu
FREE

1. The Expert Adviser is built with a basic, simple and stable trading strategy with a touch of Price Action Principle that is highly effective and accurate for a sniper entry system. The EA have a good money management System.. 2. The expert advisor works best as from 5minutes time frame and above, The higher the time frame, the more accurate is the signal.... 3. The expert advisor work with all broker all currency pair and synthetic indices... 4. Use a reasonable lot size and correct settings
FREE

The Simple Moving Average (SMA) is a technical indicator that calculates the average price of an asset over a specific period. It smooths out price fluctuations, helping traders identify trends, support and resistance levels, and potential entry or exit points. Inputs:
SMA Periods
Timeframe
Line Color
This is a basic SMA indicator. I needed one but couldn’t find it anywhere, so I created it myself.
FREE

Engulfing Failed Zone by RWBTradeLab
A clean, non-repainting FAILED engulfing detector for MetaTrader 5. Most traders only look for engulfing patterns — professionals also watch what happens when an engulfing FAILS, because a broken pattern traps traders on the wrong side and often fuels the opposite move. This indicator finds those failures automatically, sorts them into 8 types, and marks the exact level that broke — all from CLOSED candles only.
What This Indicator Does
Step 1 — Engulfing
FREE
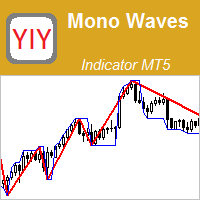
The Mono Waves indicator is designed to display the wave behavior of the market on a chart. Its appearance is presented on slide 1. This indicator uses the PPPC (Point-Percent Price Channel) indicator, which can be downloaded for free from the Market . When the market moves up, the upper border of the price channel is built on High candlestick prices (for more details, see the description of the PPPC indicator at the link given above). The higher the High prices rise
FREE

This is my ea Gold Structure Hunter EA
https://www.mql5.com/en/market/product/174076?utm SMART MARKET DASHBOARD Everything You Need. One Clear View. Make your market analysis faster, cleaner, and more organized with a dashboard that brings important price, VWAP, opening-price, and trend information together in one place. Instead of checking multiple indicators separately, the dashboard gives you a quick market overview so you can understand where price is trading and what the current t
FREE

GPF Stochastic: a momentum indicator that compares a specific closing price of an asset to a range of its prices over a certain period. It helps traders identify potential overbought or oversold conditions in the market. The indicator consists of two lines: %K Line : The main line, which represents the current closing price relative to the price range over a set period. %D Line : The signal line, which is a moving average of %K. The Stochastic Oscillator ranges from 0 to 100 , with levels typic
FREE

Trading Reportは軽量かつ非常に実用的なビジュアルインジケーターで、アカウントとトレードの主要情報をリアルタイムで表示します — すべてがエレガントで完全にドラッグ可能なミニマリストパネルに集約されています。 主な機能 ティック毎に更新(オープンポジションと浮動損益がリアルタイム) 現在ポジション詳細(BUY/SELL+ロット+エントリー価格+浮動損益(緑/赤カラー)) 当日損益と残高変動(自動着色:緑=利益 | 赤=損失 | 白=ゼロ) 完全統計:Balance、Equity、総トレード数、勝ち/負け、勝率(%)、PF、最良/最悪トレード 「Report」ボタンクリックで表示/完全非表示切り替え ボタンをドラッグして好きな場所へ移動可能
FREE

MultiForça 4 em 1 (MACD + Bulls + Bears + Média 50).
Descrição Geral O MultiForça 4 em 1 é um indicador sintético de análise técnica que reúne em um único painel quatro ferramentas essenciais para identificação de tendência e momento do ativo: MACD (Moving Average Convergence Divergence) – tendência e momentum. Bulls Power – força dos compradores. Bears Power – força dos vendedores. Média Exponencial de 50 períodos (EMA 50) – direção da tendência de médio prazo. Cada um desses
FREE
MACD-V — Volatility-Normalized Momentum Indicator Inspired by award-winning quantitative trader Alex Spiroglou ,
the MACD-V is a powerful evolution of the classic MACD — delivering a volatility-normalized momentum framework that produces consistent, actionable signals across all securities and timeframes. While the traditional MACD measures the difference between two EMAs, the MACD-V goes a step further by dividing this difference by the market’s volatility (ATR).
This normalization makes the
FREE
Session Buffer Lines is a lightweight MetaTrader 5 indicator that marks the main trading sessions directly on the chart and exposes session event data through indicator buffers. Core idea: the indicator gives traders a clean session timing reference for Tokyo, London, New York and the London-New York overlap, while also providing EA-readable open and close events through iCustom() . Quick Summary Product type MetaTrader 5 indicator Main focus Session timing, chart markers and EA-readable buffer
FREE

Volume Profile Custom Pro Volume Profile Custom Pro est un indicateur MetaTrader 5 permettant d'afficher la distribution des volumes directement sur le graphique sous forme d'histogramme horizontal. L'indicateur analyse les volumes sur une plage configurable de bougies et met en évidence les zones de prix les plus échangées afin d'identifier rapidement les niveaux clés du marché. Fonctionnalités Profil de volume horizontal en temps réel Nombre de bougies analysées configurable Nombre de ni
FREE

Sapphire Strat Maker Alt is an EA builder ( Expert Advisor Builder) . With it you can easily create new strategies and optimize them to find the bests parameters to improve your results at maximum. The objective is to bring the capabilities of MQL5 to everyone, even if you don't know how to code. Check out the Pro Version clicking here - Sapphire Strat Maker .
With this Expert Advisor you can create strategies by combining the indicators provided by the EA. A few of the functionalities ar
FREE

The Support n Resistance V2 is an advanced technical indicator that automatically calculates and plots highly accurate S/R channels based on Pivot Points . Upgraded with ATR volatility filtering and Smart Classification, this tool not only finds key levels but also analyzes historical price action and tick volume to validate the strength of each zone . Key Features Smart Classification: Automatically analyzes historical wick rejections and price touches to classify levels strictly as Support (S
FREE

>> Announcements Channel << ATR Plus is an enhanced version of the classic ATR that shows not just volatility itself, but the directional energy of the market .
The indicator converts ATR into a normalized oscillator (0–100), allowing you to clearly see: who dominates the market — buyers or sellers when a trend begins when a trend loses strength when the market shifts into a range where volatility reaches exhaustion zones ATR Plus is perfect for momentum, trend-following, breakout and volatilit
FREE

### FTBP Telegram Panel - Your On-Chart Notification Center
**FTBP Telegram Panel** is not just an Expert Advisor, but a full-featured tool for traders who want to receive instant notifications about their trades in Telegram and manage the visual style of their terminal. The product is completely free!
### Key Features
* **Instant Telegram Notifications:** Get alerts for every opened and closed trade, including the ticker, volume, and financial result. * **Interactive Control Panel:** Forget
FREE

プロップファームの選択 あなたの財務的な可能性を発掘する準備はできていますか?Gold Diggerを今すぐ購入して、真のゴールドディガーになりましょう! Gold Digger EAの説明: よく分析されたグリッドシステムを利用して、月間4-8%のリターンを達成 概要 Gold Diggerは、XAUUSD(ゴールド)を取引するために特別に設計された高度なグリッドトレーディングシステムを使用する洗練されたエキスパートアドバイザー(EA)です。このEAは、月間4-8%の安定したリターンを提供することを目指しています。このEAは、プロのトレーダーや機関投資家のために設計されており、厳密な定量分析、適応アルゴリズム、および包括的なリスク管理戦略を組み合わせて、さまざまな市場状況での取引パフォーマンスを最適化します。 Gold Diggerは、Myfxbookによって検証された実績を誇っています。興味のある方は、以下のリンクから特定の月の詳細なパフォーマンス指標とライブアカウントの状況を確認できます。 グリッドシステムの分析 Gold Diggerの戦略の中心は、その高度に最適化されたグリッ
FREE

Stochastic + RSI Multi-Timeframe Dashboard with Momentum Strength Need Trade Assistant? Trade Panel Pro MT 5
Please leave a review, if you like this.
OVERVIEW A professional multi-timeframe dashboard indicator that displays Stochastic Oscillator and RSI (Relative Strength Index) values from 7 different timeframes simultaneously on a single compact panel. Perfect for scalpers and day traders who need quick m
FREE
MetaTraderマーケットは、履歴データを使ったテストと最適化のための無料のデモ自動売買ロボットをダウンロードできる唯一のストアです。
アプリ概要と他のカスタマーからのレビューをご覧になり、ターミナルにダウンロードし、購入する前に自動売買ロボットをテストしてください。完全に無料でアプリをテストできるのはMetaTraderマーケットだけです。

取引の機会を逃しています。
- 無料取引アプリ
- 8千を超えるシグナルをコピー
- 金融ニュースで金融マーケットを探索